Many of San Francisco's capital improvements are funded with voter-approved General Obligation Bonds (G.O. Bonds), General Fund debt called Certificates of Participation (COPs), or revenue bonds.
Issuing debt is a typical method for financing capital enhancements with long useful lives and high upfront costs, which the City would not be able to cover through the Pay-Go Program. The use of debt also spreads the financial burden of paying for facilities between current residents and future generations who will also benefit from the projects.

General Obligation Bonds
G.O. Bonds are backed by the City’s property tax revenue and are repaid directly out of property taxes through a fund held by the Treasurer’s Office.
The Plan structures the G.O. Bond schedule around the notion of rotating bond programs across areas of capital need, although the City’s debt capacity, election schedules, and capital needs also inform these levels. This approach was established in the original Capital Plan and has been maintained ever since.
Priority areas of need for capital improvements include Earthquake Safety & Emergency Response, Parks & Open Space, Transportation, Public Health, and the Waterfront. As part of incorporating Affordable Housing into the Capital Plan, there is also a bond in that area. The Plan occasionally recommends bonds outside these categories if there is a demonstrated capital need that the City would otherwise not be able to afford. Table 5.1 lays out the planned G.O. Bond schedule for upcoming elections.
Table 5.1
|
G.O. Bond Debt Program (Dollars in Millions) |
|||||||||
|---|---|---|---|---|---|---|---|---|---|
|
Election Date |
Bond Program |
Amount |
|||||||
|
Mar 2024 |
Affordable Housing & Shelters |
340 |
|||||||
|
Nov 2024 |
Public Health & Shelters |
320 |
|||||||
|
Nov 2026 |
Transportation |
300 |
|||||||
|
Mar 2028 |
Waterfront and Climate Safety |
250 |
|||||||
|
Nov 2028 |
Earthquake Safety & Emergency Response |
310 |
|||||||
|
Jun 2030 |
Parks and Open Space |
200 |
|||||||
|
Nov 2030 |
Public Health |
250 |
|||||||
|
Nov 2032 |
Transportation |
200 |
|||||||
|
Total |
|
2,170 |
|||||||
Chart 5.1 illustrates the impact on the local tax rate of issued, expected, and planned G.O. Bond debt. The red line represents the property tax limit policy established in 2006 that sets the annual level of bond debt repayment. The space between the red line and the bars on the chart illustrates the projected capacity for bond debt for each year. All amounts attributed to future bonds are estimates and may need to be adjusted to account for new federal and state laws, programmatic changes, site acquisition, alternate delivery methods, changing rates of construction cost escalation, and/or newly emerged City needs.
Chart 5.1
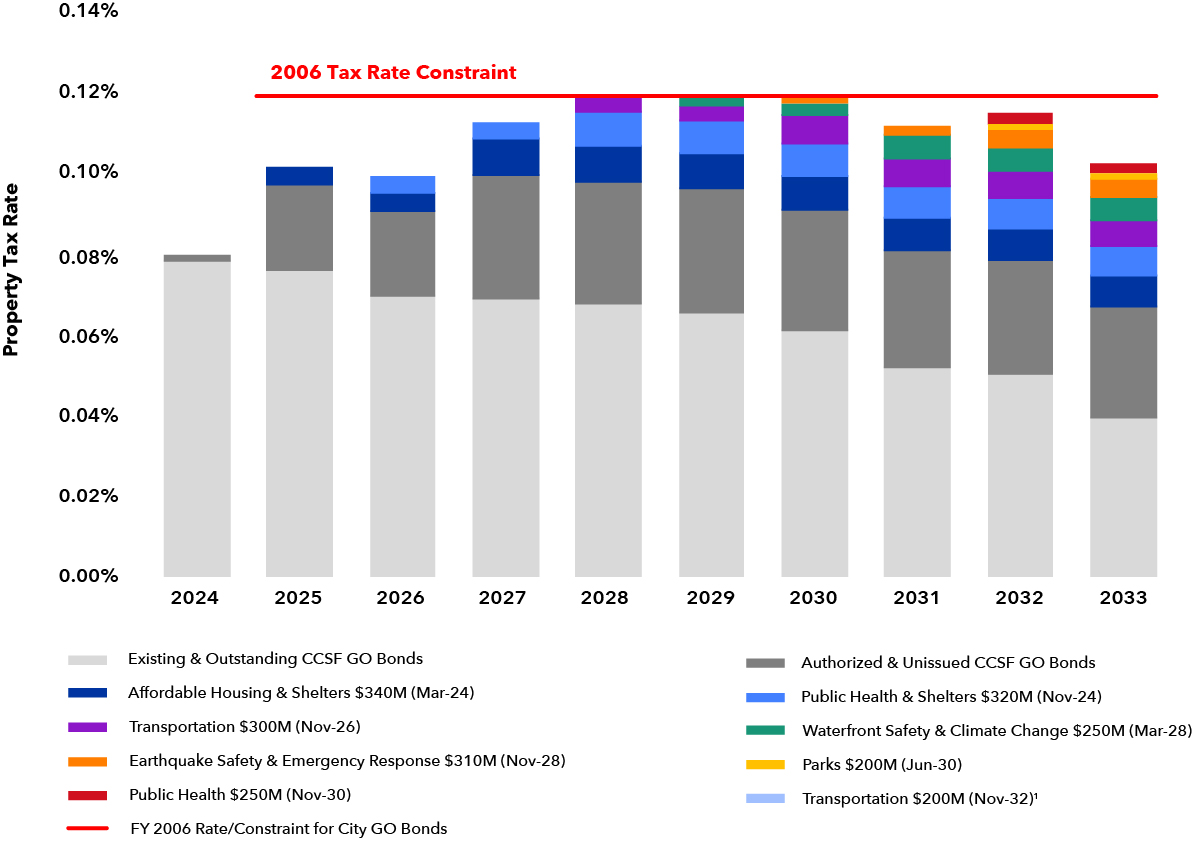
The G.O. Bond program’s capacity is largely driven by changes in assessed value and associated property tax revenues within the city. While the passage of recent bonds is a sign of the effectiveness of the capital planning process, it also impacts the available bond capacity going forward. The passage of four bonds for a total of $2.14 billion since 2018 means there is considerably less capacity for this 10-year capital planning cycle compared to previous ones. For more information on the G.O. Bond policies and past bonds, please see the Introduction chapter.
Certificates of Participation
Certificates of Participation (COPs) are backed by a physical asset in the City’s capital portfolio and supported through annual General Fund appropriations or revenue that would otherwise flow to the General Fund. The City utilizes COPs to leverage the General Fund to finance capital projects and acquisitions. Funding from COPs is planned to support basic City responsibilities such as relocating City staff from seismically deficient buildings.
Table 5.2 shows the Capital Plan’s COP Program for the next ten years. This Program includes two years of issuances for critical repairs, and one issuance for street resurfacing, to mitigate cuts to the Pay-Go Program due to COVID-19.
Table 5.2
|
COP Program (Dollars in Millions) |
|||||||||
|---|---|---|---|---|---|---|---|---|---|
|
Fiscal Year of Issuance |
Project |
Amount |
|||||||
|
FY2024 |
Relocation of HSA Headquarters |
70 |
|||||||
|
FY2024 |
Critical Repairs / Recession Allowance |
30 |
|||||||
|
FY2024 |
Street Resurfacing |
30 |
|||||||
|
FY2025 |
Critical Repairs / Recession Allowance |
30 |
|||||||
|
FY2027 |
HOJ Replacement |
167 |
|||||||
|
FY2030 |
HOJ Replacement |
200 |
|||||||
|
Total |
|
527 |
|||||||
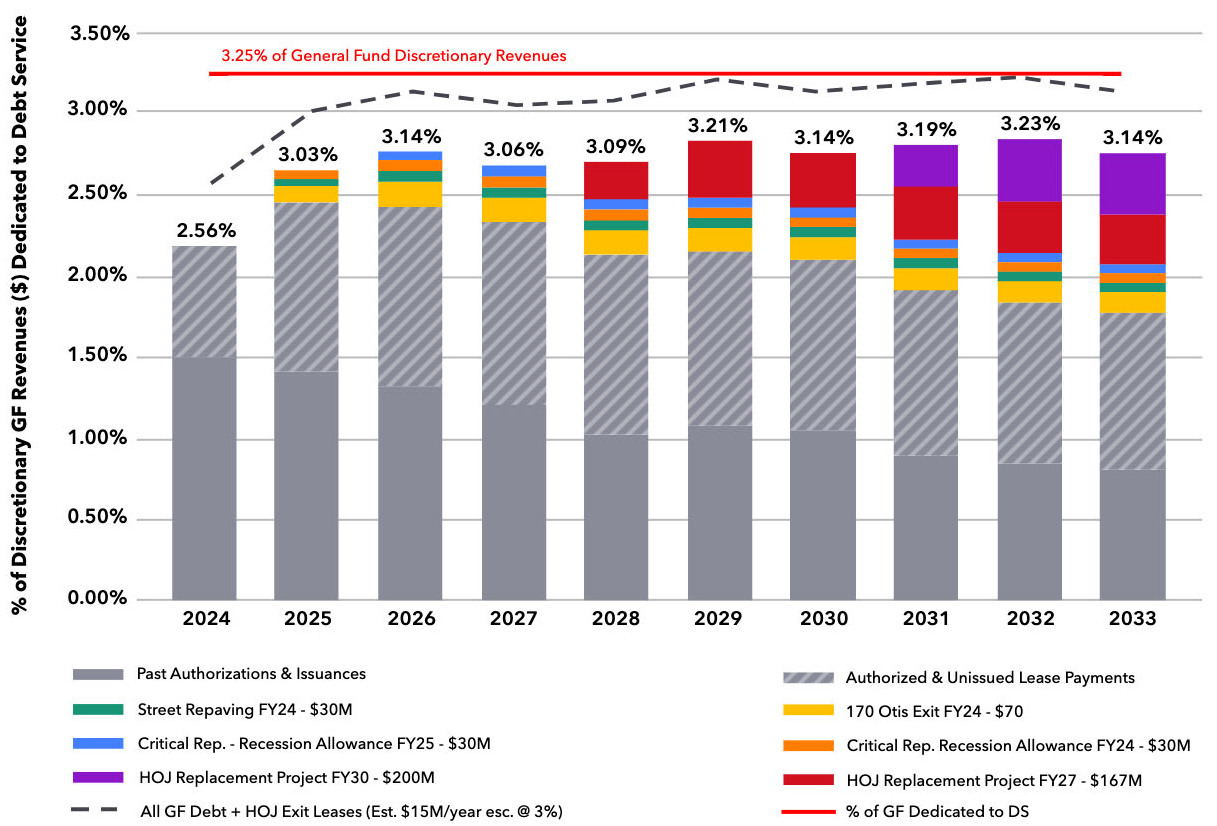
Chart 5.2 shows the planned COP Program against the policy constraint for General Fund debt not to exceed 3.25% of General Fund Discretionary Revenue, represented by the red horizontal line. The black line depicts the annual lease costs related to the Hall of Justice Administrative Exit efforts approved in 2018, which are also counted against this Program’s constraint.
The bottom portions of the columns represent debt service commitments for previously issued and authorized but unissued COPs, including the debt issued for the Moscone Center, the War Memorial Veterans Building, and the Animal Care & Control Shelter replacement. New obligations are represented in discrete colors, beginning in FY2024. As with the G.O. Bond Program, all amounts attributed to future COP-funded programs are estimates and may need to be adjusted in future plans to account for new federal and state laws, programmatic changes, site acquisition, alternate delivery methods, changing rates of construction cost escalation, and/or newly emerged City needs.
Chart 5.2
Revenue Bonds
Revenue bonds are a type of debt that is repaid from department or other revenue streams. Revenue bonds are typically used by the City’s enterprise departments (SFMTA, Port, SFPUC, and SFO), which generate their own revenues from fees paid by users of services provided by those agencies. This type of debt is repaid solely by users of those projects and therefore does not require payments from the General Fund. Examples of projects funded by revenue bonds are the SFPUC’s Water Systems Improvement Program and the Airport’s Terminal Renovation Program.
Table 5.3 shows the currently planned amount of revenue bonds to be issued over the 10-year term of this Plan. All revenue bond issuances are subject to change based on market conditions and cash flow needs of the associated projects.
Table 5.3
|
Planned Revenue Bond Issuances FY2024-33 (Dollars in Millions) |
|||||||||
|---|---|---|---|---|---|---|---|---|---|
|
Agency |
FY24-28 |
FY29-33 |
Total |
||||||
|
SFPUC |
5,289 |
1,258 |
6,546 |
||||||
|
Airport |
669 |
1,060 |
1,729 |
||||||
|
Total |
5,958 |
2,318 |
8,276 |
||||||