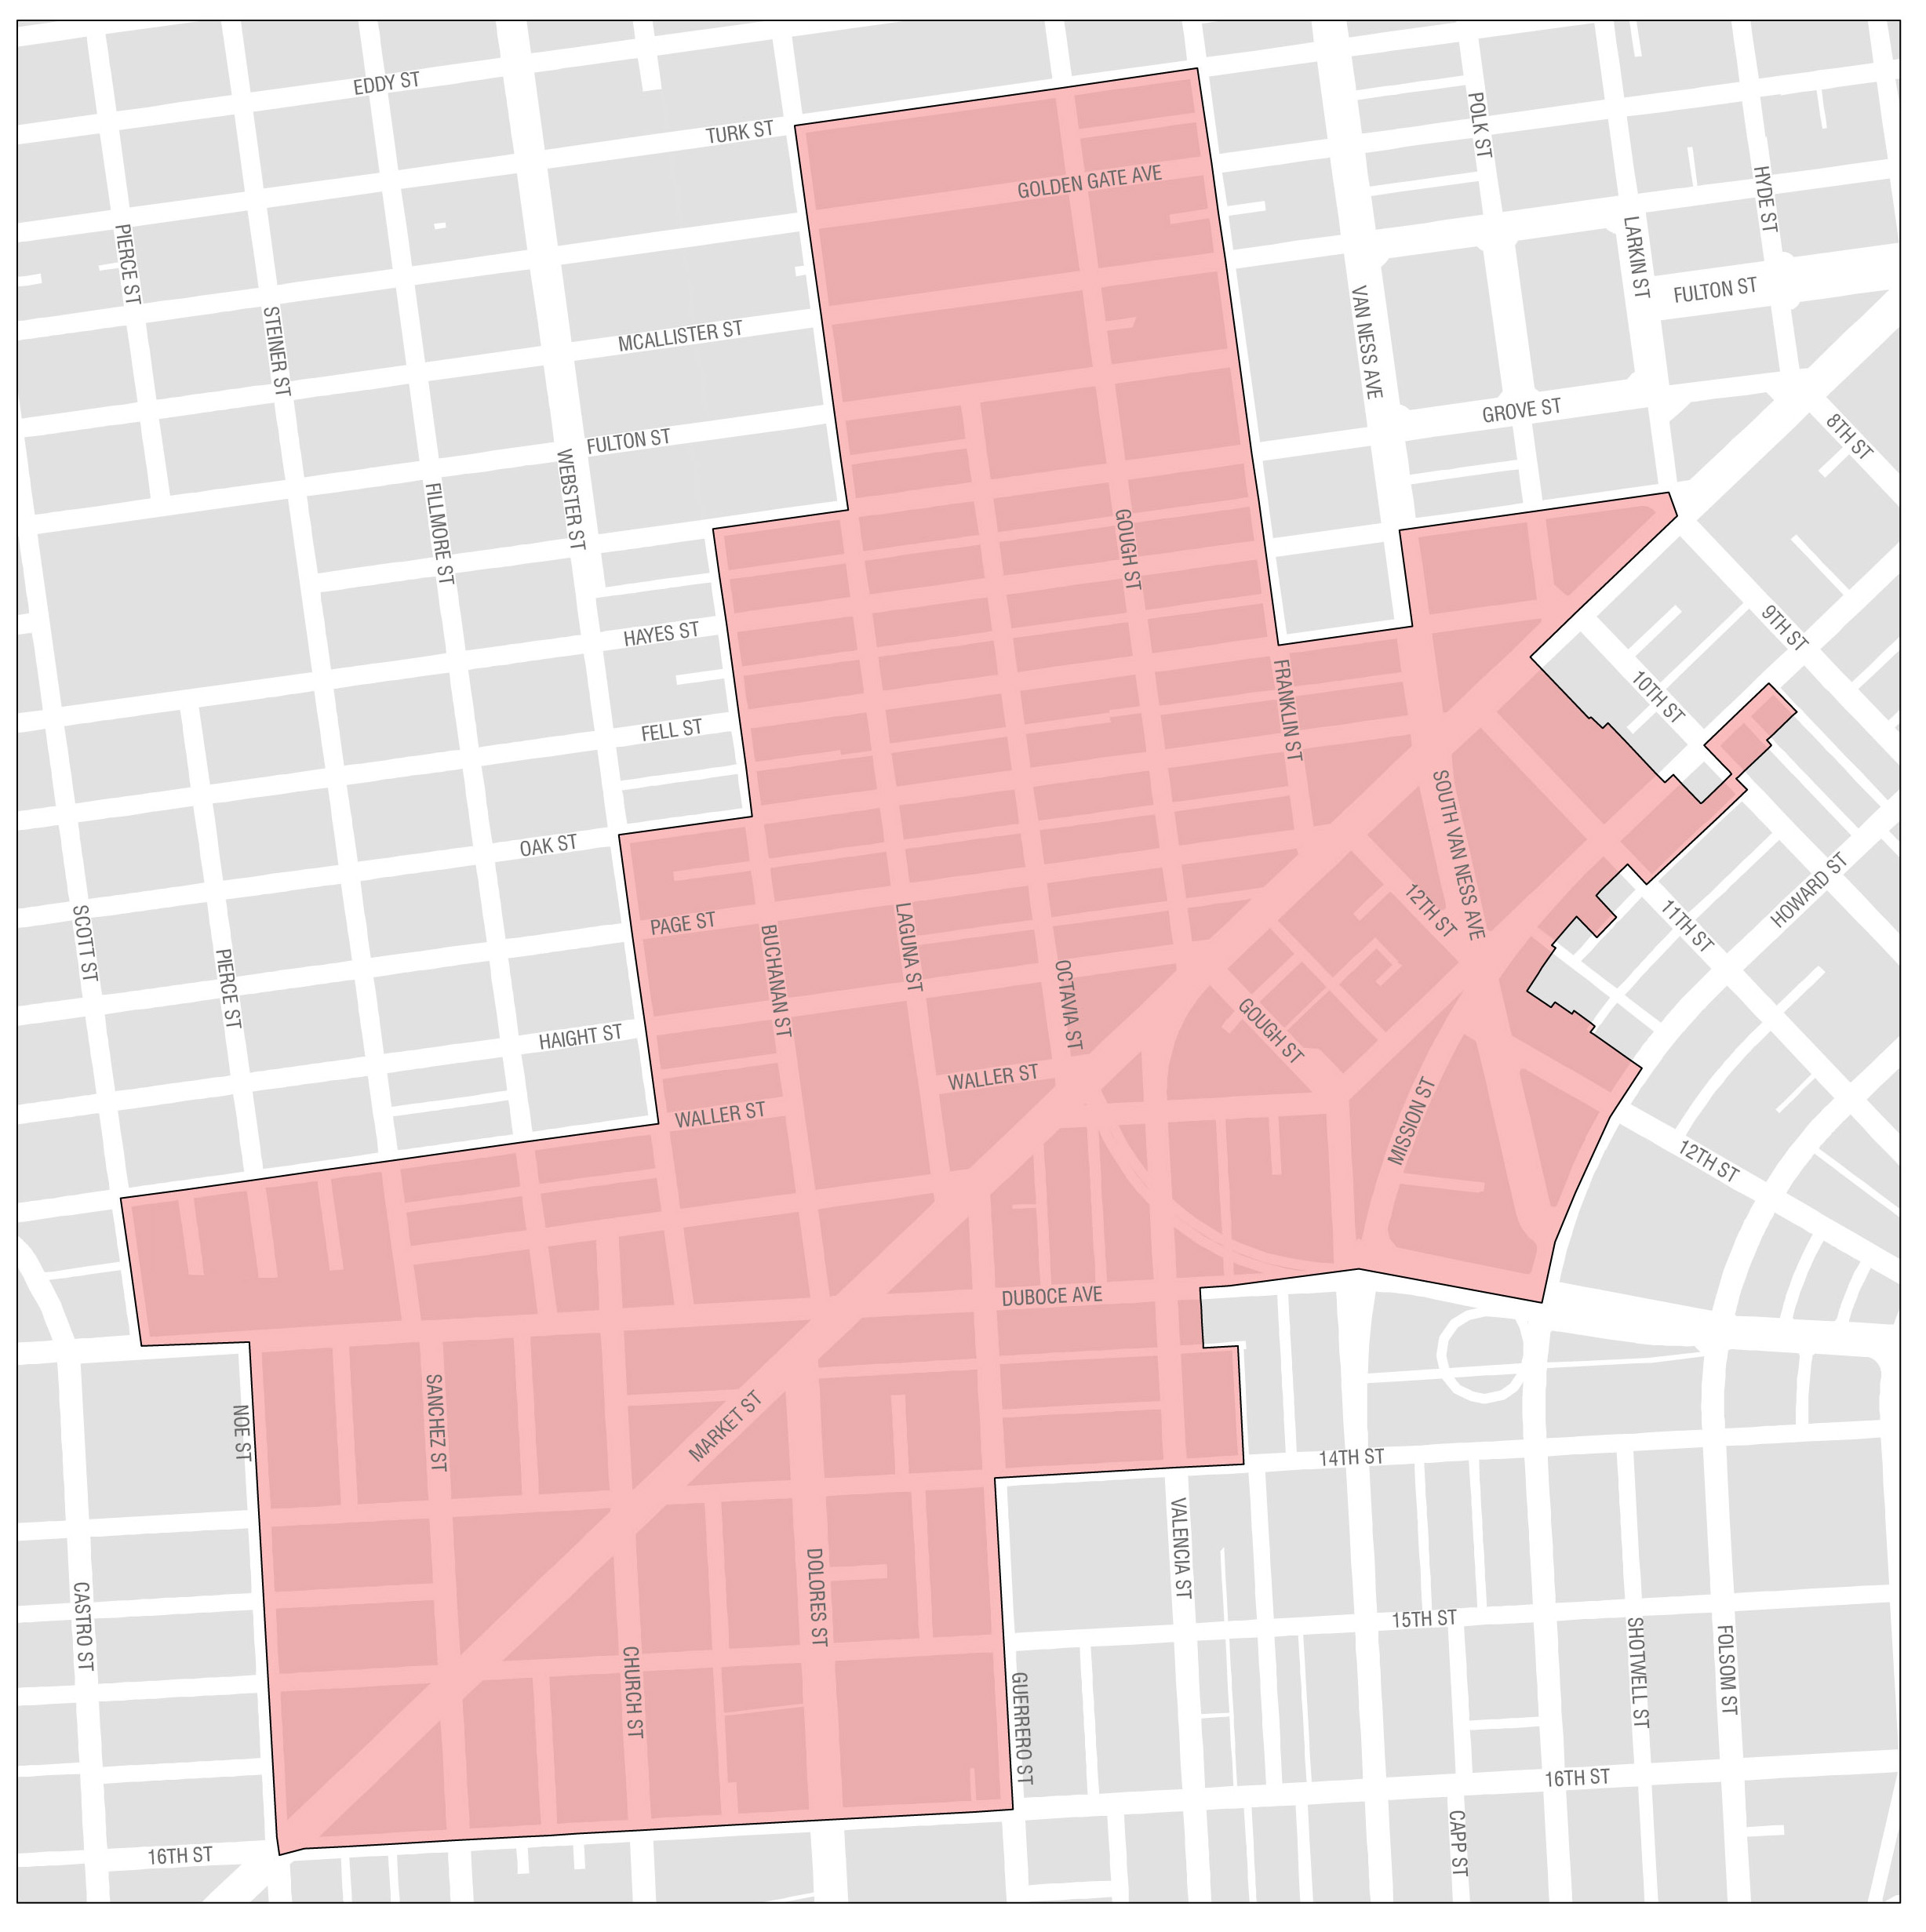
Market Octavia is located just west of the Civic Center, governmental, and cultural institutions there attract a wide range of people both day and night. Its pattern of streets and alleys make it very walkable and bikeable. More than a dozen transit lines cross the neighborhood, including all of the city’s core streetcar lines. It is accessible from the entire Bay Area by BART and the regional freeway system.
Market Octavia’s history as a crossroads also poses enormous challenges. Large redevelopment projects occurred in the 1960s and 1970s, and the Central Freeway bisected the neighborhood before it was demolished in 2003. Large flows of automobile traffic are channeled through the area creating hazardous conditions for pedestrians. However, its centralized location and transit accessibility make Market Octavia a key area to add new housing to the City.
The Market Octavia Area Plan identified many needs related to complete streets, transit, open space, and childcare that will provide the necessary services for new people living and working in the area. The total estimated revenues for proposed projects in Market Octavia is currently estimated at $173 million, including prior years. The following tables show the Market Octavia spending plan, sources of funds, and funding gap.
Return to Impact Fee Areas
| Key Proposed Eastern Neighborhoods Projects through 2029 |
|---|
| COMPLETE STREETS |
|
Better Market Street |
| 13th St. Protected Bike Lanes |
| Upper Market Pedestrian Improvements |
| Octavia Blvd. Enhancement |
| Page St. Neighborway |
| TRANSIT |
|
Van Ness Bus Rapid Transit |
| Valencia Bikeway |
| 22-Fillmore: Duboce & Church |
| Muni Light Rail Expansion |
| Western Addition CBTP Improvements |
| RECREATION AND OPEN SPACE |
|
Margaret Hayward Park Renovation |
| Buchanan Street Mall |
| Hub Open Space Improvements |
| SPENDING PLAN (Dollars in Thousands) |
Prior Years | FY 2020 |
FY 2021 |
FY 2022 |
FY 2023 |
FY 2024 |
FY 2025 - 2029 | Plan Total |
|---|---|---|---|---|---|---|---|---|
|
Complete Streets |
13,478 |
1,101 |
3,085 |
1,335 |
3,267 |
- |
- |
8,788 |
| Transit | 11,540 | 2,976 | 8,976 | 5,630 | - | - | - | 17,582 |
| Open Space | 30,573 | - | - | - | - | - | - | - |
| Childcare | 3,523 | - | - | - | - | - | - | - |
| Program Administration | 2,674 | 369 | 895 | 1,803 | 151 | 151 | 453 | 3,823 |
| TOTAL | 61,788 | 4,447 | 12,956 | 8,768 | 3,418 | 151 | 453 | 30,193 |
| REVENUES | ||||||||
|
Impact Fees |
47,286 |
6,238 |
13,282 |
43,904 |
3,155 |
3,155 |
15,472 |
85,205 |
| General Fund - Other | 970 | 1,776 | - | 1,910 | - | - | - | 3,686 |
| Bonds | 17,390 | - | - | - | - | - | - | |
| Other Local | 2,772 | 1,015 | 4,236 | 4,905 | 3,267 | - | - | 13,423 |
| External Grants | 2,112 | - | - | - | - | - | - | - |
| TOTAL | 70,530 | 9,029 | 17,518 | 50,719 | 6,422 | 3,155 | 15,472 | 102,314 |
| Cumulative | ||||||||
| Annual Surplus (Deficit) |
8,742 |
4,583 | 4,562 | 41,950 | 3,004 | 3,004 | 15,019 | 80,863 |

