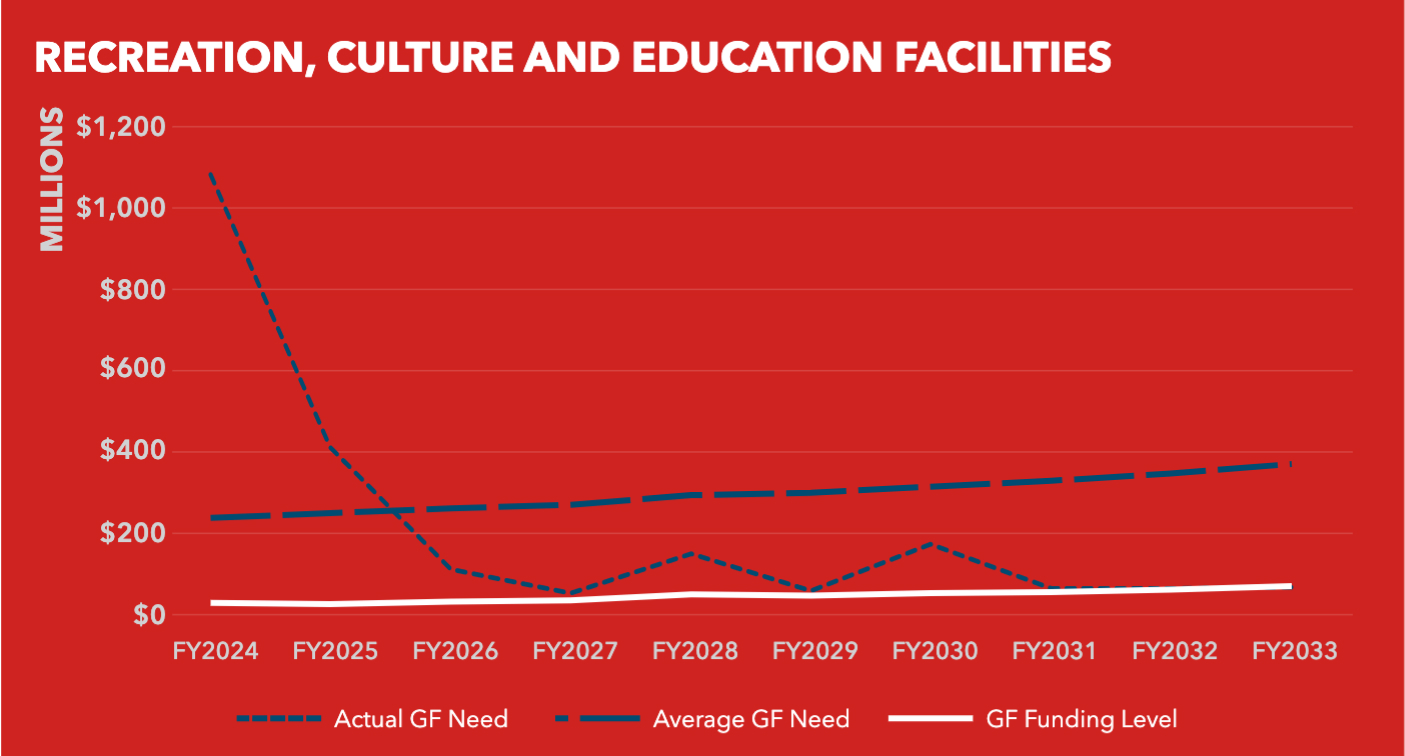
2024 - Recreation, Culture + Education: Enhancement Projects
Enhancement Projects
|
Project Name |
Description |
|---|---|
| REC – Neighborhood Park Projects & Open Space Improvements |
Neighborhood parks typically include a mix of facilities and amenities, such as playgrounds, courts, fields, clubhouses, restrooms, and dog play areas. This program focuses on improving and modernizing facilities to provide recreational opportunities that meet current and future demand. New investment is needed to modernize the system, increase open space and recreational opportunities, improve the quality of park experience, and address currently unmet as well as future needs in high growth areas. These projects often have partnership investment, which are developed along with the projects, particularly for projects delivered from the Community Opportunity Fund. This program will receive $24 million from the 2020 Health and Recovery G.O. Bond. Additional funding is expected from the REC set-aside within the General Fund and the planned 2030 G.O. Bond, pending voter approval. |
| REC – ADA Improvements to Parks Facilities |
In coordination with the Mayor’s Office on Disability (MOD), this program includes disability access improvements to specific sites and facilities, advanced by ADA complaints and needed barrier removals. Corrections include bathroom modifications, walkway and pathway paving to compliant accessible slopes, ramp and stair handrails, and provision of accessible parking. Current projects include a Barrier Removal Project at Louis Sutter Playground (Planning Phase), the renovation of the perimeter path at Stow Lake (Construction Phase), and repaving existing asphalt paths along the southern edge of Jefferson Park. Additional work is being done in Golden Gate Park including the renovation of curb ramps and pathways. $1.8 million has been identified for ADA work at Harding Park. The Botanical Garden Bookstore is a potential future project. REC is also leveraging grants and other capital funds where possible to support this program.
The planned funding for this program is $800,000 per year from the REC set-aside within the General Fund. MOD continues to receive complaints related to physical access within this portfolio and may make additional requests from the General Fund. |
| REC – Buchanan Street Mall Improvements |
Buchanan Street Mall is comprised of five consecutive blocks of green space, asphalt paths, and underperforming playgrounds from Eddy Street to Grove Street. Presently within the five blocks are several temporary gardens, tree planters, seating areas, decorative lighting, and interactive sculptural multimedia installations that explain the neighborhood’s history. Developed through a robust community process, the project is intended to reinvigorate a long-underfunded community by creating a place that serves as a primary gathering place for the neighborhood, starting with the blocks between Eddy Street and Golden Gate Avenue and McAllister and Fulton Streets. Core design elements on all five blocks include new pedestrian lighting, new planting areas, pathways and seating areas, the memory walk, and stormwater retention features. New children’s play areas will be constructed on the two northernmost blocks; communal gardens on the two southernmost blocks and Turk-Golden Gate; and microenterprise kiosks on the three central blocks. Other program highlights include a new lawn, stage, picnic and BBQ areas, a multiuse sports court, and full basketball court. The project is still seeking additional funding for utility contingency, the memory walk, and microenterprise kiosks.
This project’s total budget is $27 million, including $2 million from the 2020 Health and Recovery G.O. Bond, $5.8 million from Prop 68 funding, $3.9 million from ORLP grant round 5, $1.3 million from the General Fund, $835,000 from the Let’s Play SF Fund, $900,000 from TPL in-kind, $3.9 million from SF PUC Green infrastructure funding, $4.8 million from CA State budget allocation, and $3.6 million expected from Market Octavia Impact Fees. |
| REC – Buena Vista Park |
Buena Vista Park is a 36-acre park and includes a children’s play area, dog play area, tennis courts, restroom facilities, park maintenance facilities, trails, pathways, and landscaped and natural areas. The park contains one of the City’s few remaining coast live oak groves on its northern side. Improvements include the restoration and repair of the pathway network on the park’s interior.
This project is budgeted at $3 million, funded by the 2020 Health and Recovery G.O. Bond. |
| REC – Chinatown/Portsmouth Square Improvements |
The much-needed improvements to Portsmouth Square will create a central community space that is safe and welcoming to all, including the many residents of nearby affordable housing. The proposed project design was informed by community feedback with majority support from Chinatown community. The proposed project will renovate the existing park with a new children’s play area, exercise equipment, plazas, shade structures, seating areas, wayfinding, signage, sidewalks, landscaping, terraces, ramps, and a new 8,300-square-foot clubhouse. The proposed project will also re-waterproof the roof of the Portsmouth Square Garage located underneath the park and portions of the adjacent streets and sidewalks, seismically upgrade portions of the parking garage, and demolish and remove the pedestrian bridge spanning Kearny Street that connects Portsmouth Square with 750 Kearny Street. An Environmental Impact Report for the project was completed and certified in January 2022, and the Notice of Determination was filed in February 2022.
This project is estimated to cost $72 million and will receive $54 million from the 2020 Health and Recovery G.O. Bond and $6 million from State funding. The project has previously received $10.8 million in Transit Center Community Facilities District funding and plans to use $500,000 of Downtown Park Fund fee revenue. |
| REC – Citywide Parks |
Together, San Francisco’s citywide serving parks – Golden Gate Park, John McLaren Park, and Lake Merced Park – comprise almost 2,000 acres of open space, each with vast, ongoing capital needs. This program renovates and improves park features, including restoration of natural features, recreational assets, trails, connectivity and access at these citywide parks. This program also includes the new Gardens of Golden Gate, a newly developed entity that comprises the Botanical Garden, Japanese Tea Garden and the Conservatory of Flowers.
This program will receive $18 million from the 2020 Health and Recovery G.O. Bond. |
| REC – Community Garden Improvements/GROW Center |
REC’s Urban Agriculture Program manages 42 Community Gardens across the city where volunteers can grow produce and other plants for personal use. The program is currently implementing outstanding critical life safety improvements before shifting into addressing deferred maintenance projects and enhancing site amenities. The program’s main project is the SF GROW (Garden Resource Outreach and Workshop) Center that will renovate the McLaren Park Horse Stables in Louis Sutter Playground to be reused as staff offices and a new environmental center for the REC Urban Agriculture and Community Gardens Program. |
| REC – Crocker Amazon Playground |
Crocker Amazon Playground is a host to numerous athletic fields, tennis and basketball courts, two concrete bleacher structures and a clubhouse. It is a regional hub for ground sports athletics, soccer, lacrosse, baseball and softball, and an important community facility for the neighborhood. The department is engaged in a potential public-private partnership with the San Francisco Giants to support equitable access through a variety of youth enrichment programs, such as baseball, softball, academic support, etc. Identified opportunities could include renovation of the baseball diamonds, ancillary structures, and other amenities including educational facilities, restroom improvements, security, pathways, parking improvements, site amenities, and potential development of multi-use natural grass areas. This project is estimated to cost $38 million. The project will receive $15 million from the 2020 Health and Recovery G.O. Bond. An additional $15 million is expected from a San Francisco Giants grant. |
| REC – Gene Friend Recreation Center |
Located in an area where open space and recreation opportunities are limited, this facility is heavily used by children, seniors, and people who live and work in the SoMa neighborhood – which is also one of the city’s fastest growing neighborhoods. REC collaborated with the Trust for Public Land on a feasibility study and concept plan, which replaces the existing facility with one almost twice the size. The new facility would include a double basketball court gym, two multi-purpose rooms, a large exercise room and a new kitchen. The project includes improved lighting, security, and new outdoor amenities: a basketball court, plaza space and landscape, and playground. The Recreation and Park Commission approved the concept design in September 2019, and construction is anticipated to begin in Summer 2023.
This project is estimated to cost $59.3 million. The project will receive $30 million from the 2020 Health and Recovery G.O. Bond and $520,000 from TPL in-kind grant. $1.8 million has already been received from 706 Mission impact fees, and 1 million from the 5M development. Previous funding also includes $27.8 million from Eastern Neighborhood and Central SoMa impact fees, which are not yet available due to pandemic-related market impacts. REC has identified sources to fill the project funding gap ($16 million), with the understanding that these sources will be reimbursed once impact fees are available. |
| REC – Herz Playground New Recreation Center |
Herz Playground, situated on the southeast corner of John McLaren Park, serves the Visitacion Valley and Sunnydale neighborhoods. The Herz Recreation Center project includes the construction of a new recreation center within the park. The new facility will be approximately 11,500 square feet and feature an indoor basketball court, bleachers, office space, a multi-purpose room, restrooms, and other spaces for storage and building systems equipment. Outdoor improvements will include a plaza at the entrance, installation of adult fitness equipment, a new nature exploration and picnic area, lighting, removal of hazardous trees, and pathway improvements to connect the park with the Sunnydale community and neighboring Community Center that will be developed as part of the HOPE SF Sunnydale redevelopment. |
| REC – India Basin / 900 Innes | Located in the Bayview-Hunters Point neighborhood the 900 Innes property, acquired in 2014 as a brownfield, was remediated under phase 1 of the India Basin project in 2022. Development of the 900 Innes Property began in Fall 2022. By connecting the site to adjacent India Basin Shoreline Park, REC will be able to create one grand waterfront park, close a critical gap in the San Francisco Bay Trail, and increase access to open space in an under-served area of the city. Along with planned improvements to India Basin Open Space funded by the adjacent housing development, a 20-acre network of new and/or improved open space will be created. With an emphasis on access, social equity, waterfront recreation, sea level rise resiliency, and marsh and wetland habitat, this project will feature pedestrian and bicycle shoreline access, passive open space, fishing areas, tidal marshes, plazas and event spaces, picnic areas, site furnishings, and historical and educational displays. The India Basin / 900 Innes project is projected to cost $200 million. The project will receive $29 million from the 2020 Health and Recovery G.O. Bond. $25.8 million will be allocated to 900 Innes Park Construction with the difference expended on the previous phase, 900 Innes Remediation. Other sources for 900 Innes Park Construction and India Basin Shoreline Park include $65.1 million from four state grants and $26.5 million from private sources. Secured sources fund the design contract and 900 Innes Park Construction. Partially funded phases of the project include India Basin Shoreline Park development and the Equitable Development Plan that includes site activation. REC is in the process of launching a private fundraising campaign, along with pursuing public grants, to bridge the funding gap to complete all initiatives of the project. |
| REC – Jackson Playground |
The renovation of Jackson Playground will ensure the continued operation as an important local and regional resource and create a vibrant and safe open space for children and adults to enjoy for generations to come. The 4.9-acre Jackson Playground is located in Potrero Hill and occupies an entire city block. Jackson Playground includes picnic areas, tennis, and basketball courts, two ball fields, a children’s play area and clubhouse. REC, in collaboration with the Friends of Jackson Park (FoJP) community group, have worked on a design for the renovation of the park. Environmental review for REC’s preferred plan at Jackson Playground was completed in 2022. Improvements will include reorientation and renovation of some existing park amenities such as the sports fields, construction of a new playground, and the relocation, renovation, and extension of the historic clubhouse.
This project will receive $10 million from the 2020 Health and Recovery G.O. Bond. In addition, the project is expected to receive $6.36 in FY2024 and 2025 from Eastern Neighborhood IPIC funding. The project has also previously been appropriated $1.6 million of Eastern Neighborhoods IPIC funding. This project is a partnership with Friends of Jackson who are expecting to raise approximately $9 million. |
| REC – Japantown Peace Plaza Improvements |
Japantown Peace Plaza, located in the heart of Japantown, was last renovated in 2000. For many years, the plaza has been leaking water to a public garage situated below the mall and plaza. The Japantown project will resolve the water intrusion and provide a reinvigorated space for the community. The renovation will include new planting, paving, seating, lighting, and structural reinforcement of the Plaza and Peace Pagoda. The new community-driven, culturally sensitive design will provide more functional access to the Plaza, both for everyday and special event use, while harnessing the symbolism that this site holds within the neighborhood, city, and region.
This project is estimated to cost $34 million. The project will receive $25 million from the 2020 Health and Recovery G.O. Bond and $6 million from State funds. |
| REC – Marina East Yacht Harbor Renovation |
This project is part of a Settlement Agreement between RPD and PG&E for sediment remediation and marina renovation at the East Harbor, and incorporates adjacent improvements along the Bay Trail previously planned. Under the remedial design, the resulting depth in the southern portion of East Harbor will be too shallow for existing marine operations, making it unusable for berthing of motorized boats, large sail boats, and commercial vehicles. The East Harbor improvements are expected to provide approximately 5-acres of protected open water, allowing for small non-motorized recreation (kayaking, canoeing, paddle boarding, small sail craft). The project may also include upland improvements to increase public waterfront access and pedestrian and bicycle safety and reduce conflict motor vehicles.
The target budget for the improvements is $130 million. REC is responsible for $11.7 million, payable over 30 years following completion of all work, with zero interest, using future Marina revenues. The parties have agreed to an additional $60 million contingency for a not-to-exceed amount of $190 million. |
| REC – Golden Gate Park/Richmond Senior Park |
Richmond Senior Park improvements near the Golden Gate Park Senior Center will provide outdoor elements for senior or intergenerational engagement. These improvements could include outdoor, intergenerational exercise equipment to provide opportunities for both independent and guided activities, landscaping, communal gardening beds, pathways, and benches. This project will receive $1 million from the 2020 Health and Recovery G.O. Bond. |
| REC – South Ocean Beach |
As part of the City’s first Climate Adaptation Project at South Ocean Beach, this initiative will create a new multi-use trail between Sloat Avenue and Skyline Boulevard, with a restroom and plaza by Sloat Avenue and a parking lot near Skyline Boulevard. The trail extension will connect the Lake Merced Trail and the Lower Great Highway Trail. The trail, restroom and parking lot elements will be implemented in conjunction with other improvements at South Ocean Beach that are a part of the City’s Ocean Beach Climate Change Adaptation Project, such as the creation of dune habitats, access stairs to the beach, and the SFMTA, Caltrans and PUC-led projects in the area. Other anticipated projects include conservation, protection, and restoration efforts, such as forest management; water conservation measures; energy generation and conservation measures; landscaping with native plants; acquisition, improvement, or expansion of urban agriculture sites; and development of new spaces to improve resiliency.
REC will contribute $8 million from the 2020 Health and Recovery G.O. Bond towards the larger Ocean Beach Climate Change Adaptation Project, which is currently estimated to cost $130 million. |
| REC - South Sunset Playground |
South Sunset Playground is a 4-acre park featuring ball fields, basketball and tennis courts, a playground, a paved multi-use play area and the clubhouse. The 2,600 square-foot single-story clubhouse includes a multi-purpose room, restrooms, a kitchen, and an office. The building was originally constructed in 1957 and has not seen any major renovation in decades. Improvements to the park include the reconfiguration and renovation of interior spaces in the clubhouse, access improvements, landscaping, and beautification.
This project is estimated to cost $5.3 million. The project will receive $3 million from the 2020 Health and Recovery G.O. Bond and $2.3 million in State funds. |
| REC – Kezar Pavilion Seismic Upgrade |
With a seating capacity of more than 5,000, the historic Kezar Pavilion, situated in the southeastern corner of Golden Gate Park, is used for large sporting events, and could be used for functions such as shelter, mass care and mutual aid after a major disaster. In 2013, an engineering study by Public Works found that Kezar Pavilion needs a seismic upgrade to ensure safety for staff and public use. The facility also requires comprehensive systems upgrades and historic rehabilitation.
The cost estimate for this project is $88 million. It will receive $70 million from the 2020 ESER G.O. Bond, and $5 million from the 2020 Health and Recovery G.O. Bond. Additional funding sources are yet to be identified. |
| REC - Esprit Park |
The Esprit Park renovation is a partnership project between REC, UCSF, and the Dogpatch and Northwest Potrero Hill Green Benefit District. Renovation of this roughly 2-acre park includes drainage and irrigation improvements, refined circulation throughout the park, retaining the urban forest feel, demarcating functional use areas by providing infrastructure and amenities for different user groups including children, the adult fitness community, and off-leash dog walkers. Concept plans were approved by the REC Commission in February 2021. Construction began in the Fall of 2022. This project is estimated to cost $8.5 million. The project has received $5 million from UCSF and $3.5 million through impact fees. |
| REC – New Park at 11th and Natoma Street |
The recently acquired site at 11th Street in western SoMa needs to be remediated, planned, designed and developed. Planning and community outreach for the new park began in Spring 2022.
This project will receive $11.9 million in impact fees from SoMa and Market Octavia, of which $800,000 is on-hand and will be used for the planning and environmental review phases. This project has also received $9.7 million for acquisition and $275,000 for remediation needs from REC’s Open Space Acquisition Fund. |
| REC – Twin Peaks Promenade and Trail Improvements |
This project will convert the pilot road closure at Twin Peaks into a permanent linear park along the trail system. It would improve pedestrian and bicycle access, along with defined trail connections and corridors. The promenade scope includes reducing the width of asphalt roadway, adding park trail at eastern edge, barrier removal, planting, signage, seating, and bike racks. The associated trails scope includes replacement of trail and natural surface box steps on the south peak, as well as two other trail segments that connect the promenade to the neighborhood and public transit.
This project is estimated to cost $4.4 million. The project will receive $1 million from the 2020 Health and Safety Bond and $2.4 million in state grant funding. |
| REC – Golden Gate Park - 9th Ave & Lincoln Gateway |
This project proposes improving the prominent gateway into Golden Gate Park with placemaking improvements including an expanded paving area on each side of 9th Avenue, with seating, native planting, and improved signage to welcome park visitors. Crossings will be brought to ADA compliance and the existing bus shelter will be relocated to create a more usable space. Scheduled completion is Fall 2023.
This project is estimated to cost $3.1 million. The project received $2.8 million from the General Fund and $250,000 from the Open Space Fund. |
| REC – Additional Public Restrooms at Parks |
The department plans to add additional stand-alone public restrooms at several parks, based on need and funding availability, starting with Noe Valley Town Square, and planning for a future restroom at Precita Park.
Noe Valley Town Square and Precita Park Restrooms have received $200K each from the General Fund, with additional funding sources expected. |
| ARTS – African American Art & Culture Complex Retrofit & Renovation Project | Located in the historic Fillmore/Western Addition neighborhood, the African American Art & Culture Complex (AAACC), a 32,000+ square foot facility, is one of the premier Black arts and cultural institutions in the San Francisco Bay Area. AAACC provides a wide variety of art and cultural programming and affordable space rentals for events, and office, administrative services, and access to rehearsal, performance and exhibition spaces. The facility is also home to the 206-seat Buriel Clay Theater which serves as a site for annual theater productions, dance performances, musical concerts, film and video screenings, seminars, and workshops. In 2020, a facility assessment for the AAACC showed significant seismic vulnerability with a Seismic Hazard Rating (SHR) of 4. In addition to seismic strengthening, this renovation will include the correction of significant building deficiencies to improve the longevity, safety and comfort of this 1935 structure. The estimated cost for this project is $14.5 million, funded through the General Fund and FY2023 Certificates of Participation. |
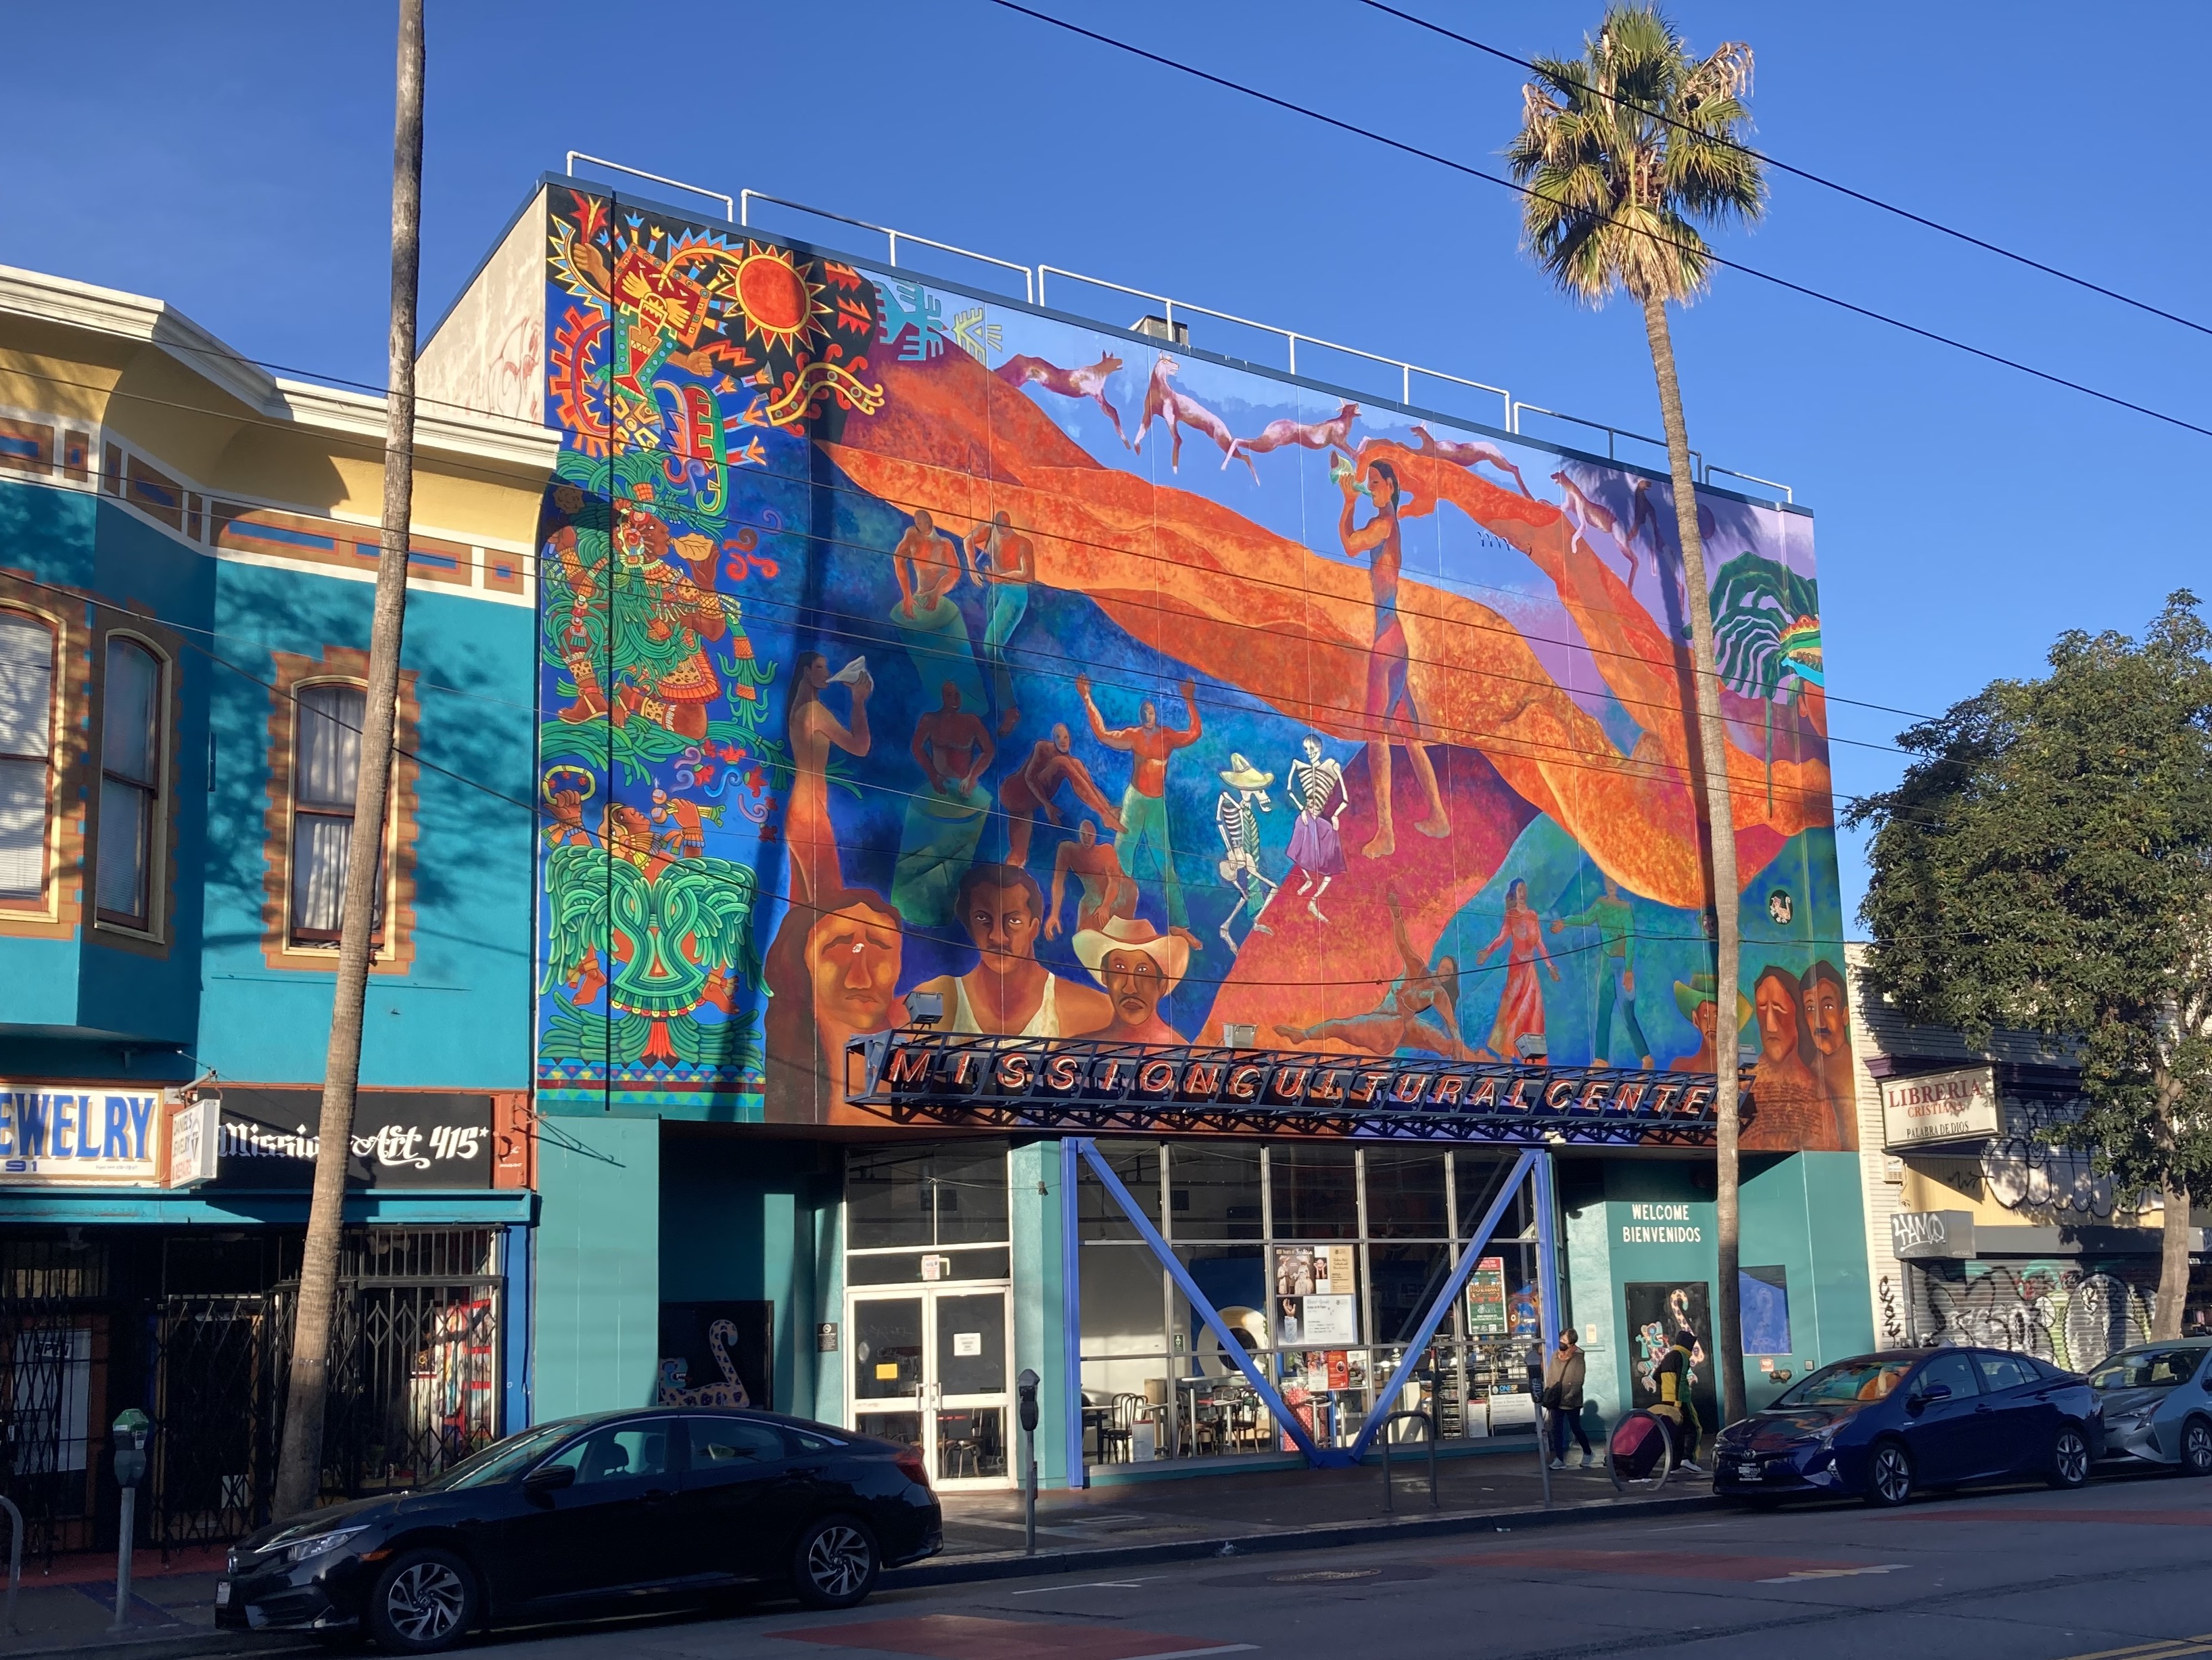
| ARTS – Mission Cultural Center for Latino Arts Retrofit & Renovation Project |
The Mission Cultural Center for Latino Arts (MCCLA) was established in 1977, and is a 40,000+ square foot facility that provides the community with an arena in which to develop new artistic skills, as well as support local and established artists. MCCLA collaborates with other arts, social and humanitarian groups to provide the widest range of programming possible. MCCLA is on the Federal Register of Historic Places and was designated a City Historic Landmark in 2022. In 2020, a facility assessment for the MCCLA showed significant seismic vulnerability with a Seismic Hazard Rating (SHR) of 4. In addition to seismic strengthening, this renovation will include the correction of significant building deficiencies to improve the longevity, safety and comfort of this circa 1962 structure.
The estimated cost for this project is $19.5 million, funded through the General Fund and FY2023 Certificates of Participation. |
| LIB – Chinatown Branch Renovation | The Chinatown Branch Library renovation will address the needs of the community and include the latest innovations in delivery of library collections, programs, and learning. The Chinatown Branch has special historical architectural significance, and the restoration of previously lost historical features will also be explored. The estimated cost for this renovation is $29.4 million, with a $3 million contingency, funded through a combination of the Library Preservation Fund and General Fund. |
| LIB – Ocean View Branch Project |
Originally planned as a renovation, work for the Ocean View Branch Library has been expanded to a new, more substantial facility. Planning work has begun, engaging the community during the last several years to discuss project scope, and identify a probable site. There has been discussion about dovetailing the Library project with traffic improvements in the area long been desired by SFMTA, which may impact the timeline.
The estimated cost for the Ocean View construction projects is $47 million. As of FY2023, $17.5 million has been funded for this effort through the Library Preservation Fund. |
| LIB – Main Library Safety Enhancements |
Over the last two years, working with Public Works architects, the Library began installing architecturally appropriate safety barriers to augment the height of the handrails around multi-story spaces.
The estimated cost for this project is $4 million, funded through the Library Preservation Fund. |
| LIB – Main Library Seismic Moat and Joint |
Initial exploration and design work were accomplished on the seismic moat, working with Public Works architects and engineers. While the project was delayed by COVID-19, the moat covers have remained stable with minor maintenance.
The estimated cost for this project is $7 million, funded through the Library Preservation Fund. |
| CCSF – Ocean Campus Utility Infrastructure Replacement |
Infrastructure replacement and capital improvements at the Ocean Campus will address systems at risk of catastrophic failure and correct deficiencies that represent significant hazards to students, faculty, staff and the public. The scope of the project will repair, modify, replace, and/or construct infrastructure including fire suppression systems, potable water, sanitary sewer, storm drainage, natural gas and electrical distribution, data and emergency notification, video surveillance, lighting, boilers, and steam distribution.
The budget for this effort is $56.3 million through FY2033 and will be funded out of the California State Chancellor’s Office Capital Outlay Program with contributing General Obligation bond funds. |
| CCSF – 750 Eddy Street Seismic and Code Upgrades |
This project will add structural integrity to the building by bringing it into conformance with current building code. Concurrently, upgrades will be made to mechanical, plumbing, electrical, communication, building envelope, interior walls, floors, and ceilings as required by code and to facilitate seismic enhancements.
The budget for this project is $14.5 million through FY2033 and will be funded out of the California State Chancellor’s Office Capital Outlay Program with contributing General Obligation bond funds. |
| CCSF – Evans Center Renovation |
This project will provide structural and seismic and earthquake safety upgrades, including roof and window repairs to address water leaks, and reconfiguring and upgrading skill-building spaces.
The budget for this project is $22.6 million through FY2033. |
| CCSF – Diego Rivera Theater with Mura |
This project would construct a new performing arts theater. The black box theater will make possible credentialed programs not currently available. The theater will be the future home of the Diego Rivera Pan American Unity mural.
The budget for this project is $96.7 million through FY2033. |
| CCSF – STEAM Center |
This project will build a multi-story facility to anchor programs for the Science Technology Engineering Arts and Math (STEAM) disciplines demanded by students. Also, new class spaces and offerings will help students gain hands-on learning experiences needed to secure employment.
The budget for this project is $127.9 million though FY2033 |
| CCSF – Student Success Center |
This project will consolidate over 30 student development programs such as academic counseling, tutoring, career center, and transfer center. Improved access to services is key to increasing and maintaining future enrollment. The entire student body will be better served, especially historically marginalized student populations.
The budget for this project is $112.2 million through FY2033. |
| CCSF – Science, Arts and Media Building Renovations |
This project will address high priority structural upgrades and facility renovations at the Science Hall Academic building, and the Creative Arts and Multi Media building.
The budget for these projects is $130.3 million though FY2033. |
| CCSF – New Child Care Center |
This project will replace the current onsite childcare center, currently located in a temporary portable structure, with a facility that better serves faculty, staff and student families.
The budget for this project is $11.5 million through FY2033. |
| CCSF – Cloud Hall Academic Building Renovation |
This project will upgrade the building and address seismic safety needs. Elevators will be added to improve accessibility, and both indoor and outdoor student gathering/study spaces will be added at ground level.
The budget for this project is $123.5 million through FY2033 and will be funded out of the California State Chancellor’s Office Capital Outlay Program with contributing General Obligation bond funds. |
| CCSF – Ocean General Campus Wide Improvements |
Project scope includes campus wide renovations and systems upgrades identified in City College of San Francisco’s Facilities Master Plan.
The budget for this effort is $7.2 million through FY2033. |
| CCSF – District Centers Renovations |
Project scope includes renovations at the District’s Centers identified in City College of San Francisco’s Facilities Master Plan.
The budget for this effort is $12.8 million through FY2033. |
| CCSF – District-wide IT Infrastructure Improvements | This project will address district-wide technology data center improvements, area network connections and hardware, audio-visual modernization, smart classrooms, computer replacements, security upgrades and improvements, telecommunications upgrades, and network infrastructure modernization.
The budget for this effort is $8.6 million through FY2033. |
| SFUSD – Various Modernization, Expansion, and Seismic Improvement Projects | SFUSD continues to pursue an ambitious capital program of seismic improvements, school facility upgrades, new school construction, and addressing deferred maintenance – funded primarily by General Obligation bonds (2006, 2011, and 2016). SFUSD’s 2016 G.O. Bond focused on school modernization projects, including seismic upgrades, improving classrooms and building new schools, investing in technology, improving food service and kitchen facilities, and expanding the green schoolyards program. While several projects funded by the 2016 G.O. Bond are complete, upcoming work includes modernizations at A.P. Giannini Middle School and Thurgood Marshall High School, a new classroom building at Hillcrest Elementary School, a new school at Mission Bay, several transformational upgrades at Buena Vista Horace Mann K-8, as well as facilities planning in the Southeast, security improvements, several schoolyard improvements, and technology upgrades. SFUSD is currently in the process of planning for a new G.O. Bond in November 2024, with projects based on an updated Facility Master Plan and recently completed facility condition assessment work. SFUSD anticipates a slight enrollment decline over the next five years, though this trend is expected to reverse as the city’s population grows.
This wide range of projects is funded primarily by the $744 million 2016 SFUSD General Obligation Bond. In addition, a $1 billion General Obligation Bond is currently anticipated to be on the ballot in November 2024. Other funding sources may include state grants, impact fees, and other local sources. |