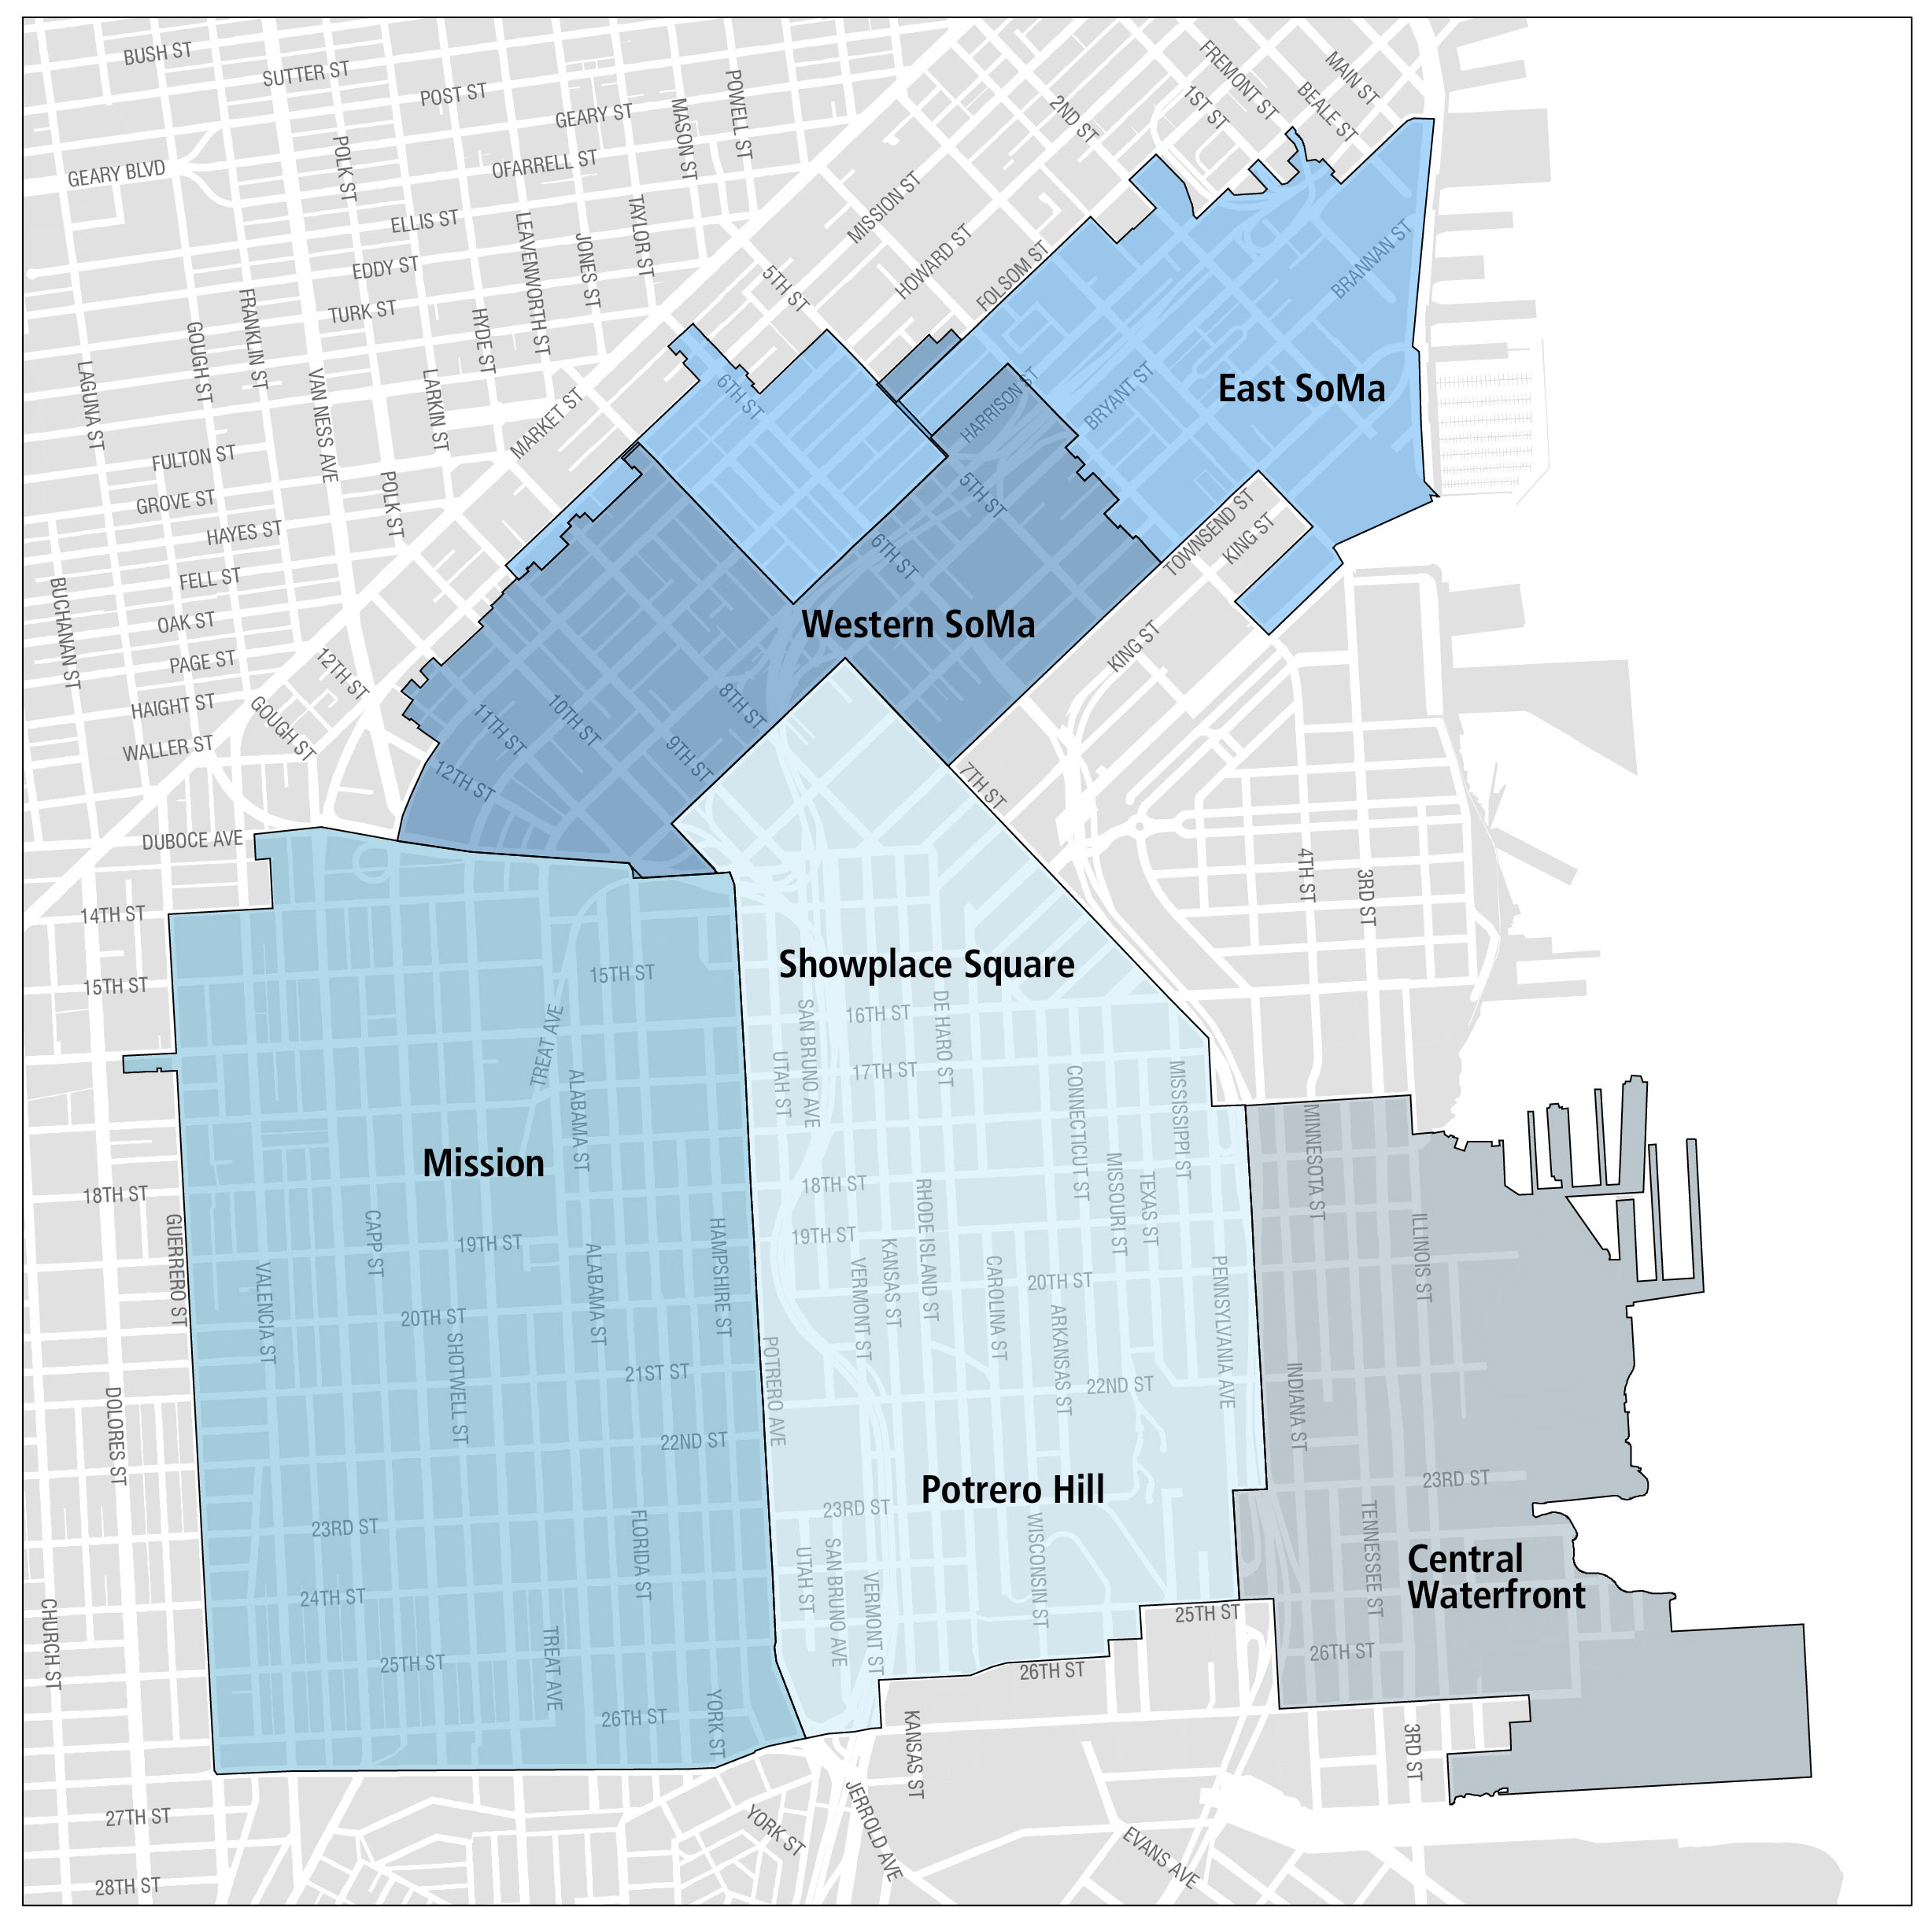
The Eastern Neighborhoods Area Plan consists of several smaller neighborhoods, including South of Market, the Mission, Showplace Square, Central Waterfront, and Potrero Hill. Much of the land use in the Eastern Neighborhoods was historically dedicated to industrial uses, and production, distribution, and repair. Over time, residential and commercial uses began to compete for space with the previous industrial uses.
In 2010, population in the Eastern Neighborhoods Plan Area was 83,930. The Planning Department projects the population to reach 149,570 by 2040, an increase of 78%. The demand for infrastructure related to complete streets, transportation, and open space increased as the population in the neighborhood began to grow. Since the Eastern Neighborhoods Area Plan was initiated in 2008, the City has worked with the community to identify priority projects for implementation. These priorities include a number of projects from the 2008 Area Plan as well as new projects identified through planning efforts that occurred since the Plan was adopted.
The revenues estimated for projects in Eastern Neighborhoods is approximately $431 million, including prior years. The tables on the following page show the Eastern Neighborhoods spending plan, sources of funds, and funding gap.
Return to Impact Fee Areas
| Key Proposed Eastern Neighborhoods Projects through 2029 |
|---|
| COMPLETE STREETS |
|
2nd Street Streetscape |
| Folsom/Howard Streetscape |
| Mariposa Bike Connection |
| 5th Street Bike Strategy |
| 6th Street Improvements |
| TRANSIT |
|
16th Street Improvement Project |
| 27-Bryant Tenderloin Project |
| 14-Mission: Spear to 11th |
| 14-Mission: Outer Mission Mission Bay Loop |
| RECREATION AND OPEN SPACE |
|
Gene Friend Recreation Center |
| Crane Cove Park |
| Potrero Hill Recreation Center |
| New 11th & Natoma Park |
| Garfield Aquatic Center |
|
Warm Water Cove |
| SPENDING PLAN (Dollars in Thousands) |
Prior Years | FY 2020 |
FY 2021 |
FY 2022 |
FY 2023 |
FY 2024 |
FY 2025 - 2029 | Plan Total |
|---|---|---|---|---|---|---|---|---|
|
Complete Streets |
61,572 |
9,095 |
48,604 |
5,520 |
- |
- |
- |
63,219 |
| Transit | 56,357 | 38,624 | 18,377 | 6,895 | 2,360 | 3,040 | - | 69,296 |
| Open Space | 74,327 | 3,000 | 4,100 | - | - | 500 | - | 7,600 |
| Childcare | 5,534 | 510 | 371 | 685 | 526 | 444 | 2,200 | 4,736 |
| Program Administration | 5,152 | 856 | 555 | 528 | 405 | 996 | 2,025 | 5,365 |
| TOTAL | 202,941 | 52,085 | 72,007 | 13,628 | 3,291 | 4,980 | 4,225 | 150,216 |
| REVENUES | ||||||||
|
Impact Fees |
97,879 |
9,828 |
15,083 |
9,138 |
5,618 |
4,386 |
40,670 |
84,723 |
| General Fund - Other | 13,815 | 13,316 | 6,604 | - | - | - | - | 19,920 |
| Bonds | 75,410 | 19,247 | 18,929 | - | - | - | - | 38,176 |
| Other Local | 7,440 | 8,005 | 32,640 | 3,130 | - | - | - | 43,775 |
| External Grants | 25,944 | 6,000 | 5,093 | 6,895 | 2,360 | 3,540 | - | 23,888 |
| TOTAL | 220,488 | 56,397 | 78,349 | 19,163 | 7,978 | 7,926 | 40,670 | 210,483 |
| Cumulative | ||||||||
| Annual Surplus (Deficit) | 17,547 | 4,312 | 6,342 | 5,535 | 4,687 | 2,946 | 36,445 | 77,814 |
