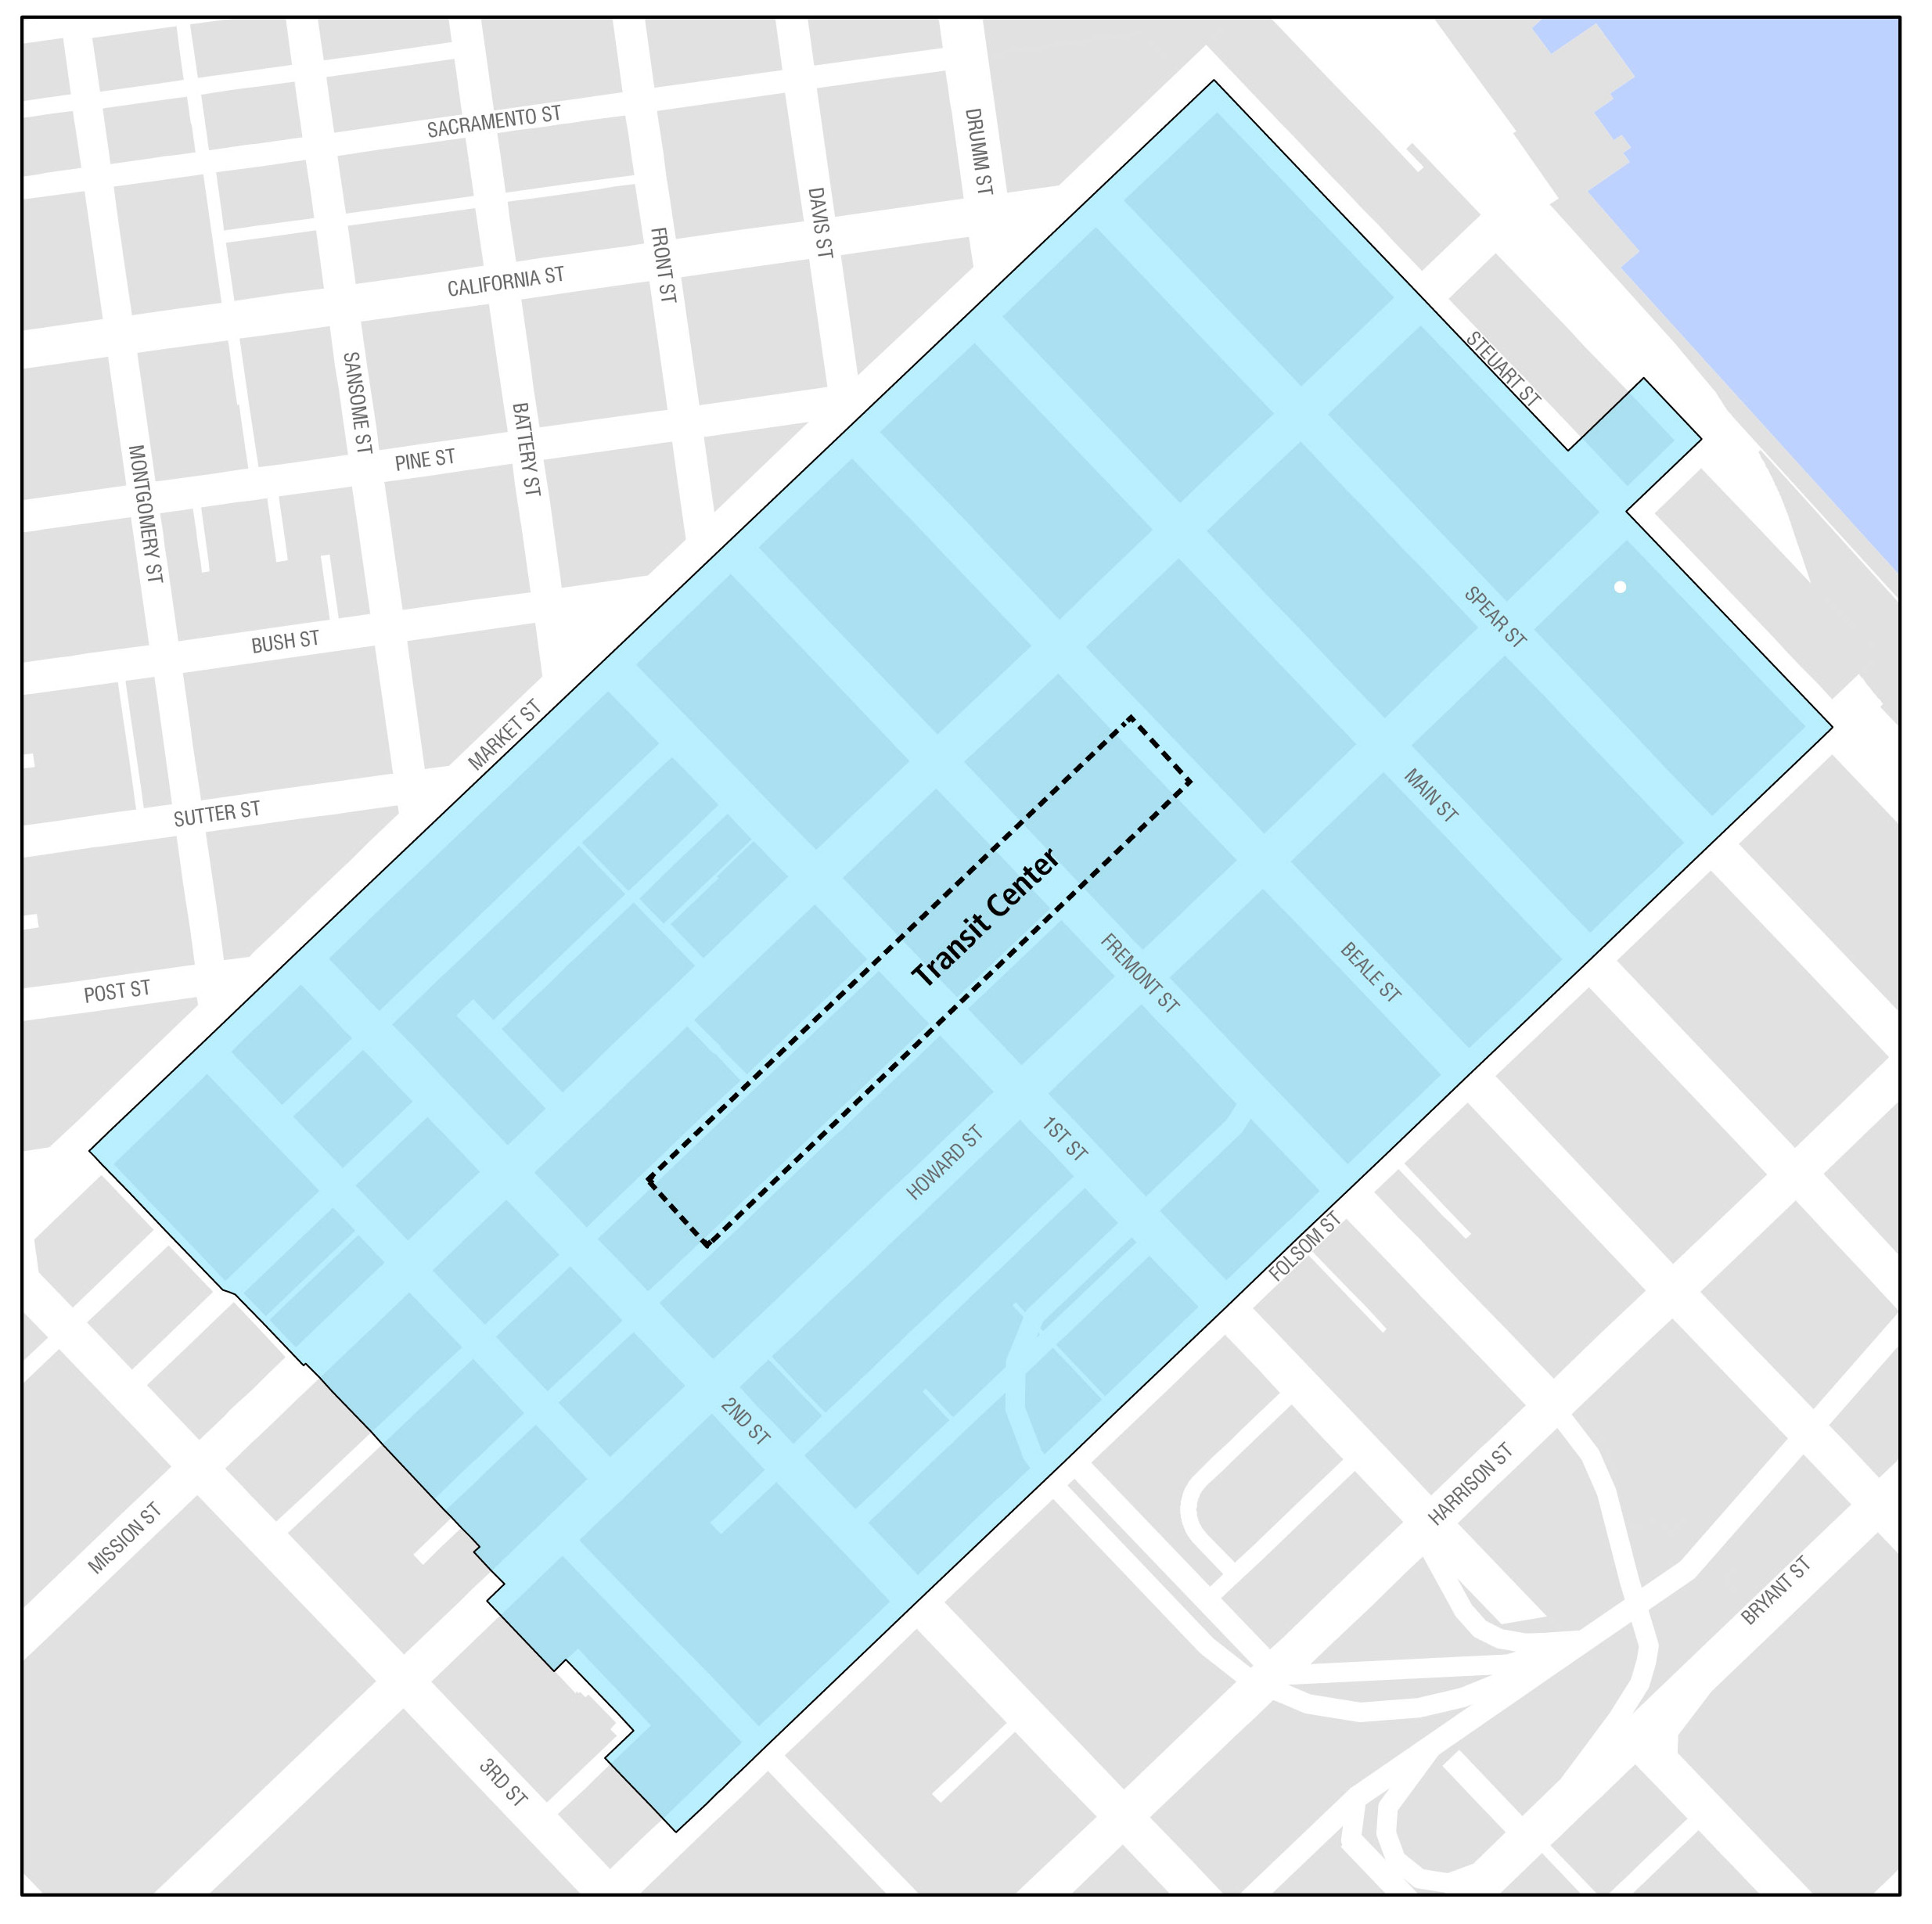
The Transit Center District Plan was adopted in 2012 to provide infrastructure improvements in conjunction with the opening of the Salesforce Transit Center. The Salesforce Transit Center is a $2.6 billion transportation hub to replace the old Transbay Terminal and will connect 11 regional transportation providers to downtown San Francisco. In addition to passengers arriving at the Transit Center, the Plan also includes several commercial developments.
The complete streets, transportation, and open space projects are designed to accommodate all of the new people that will arrive in the area each day. The Plan includes those projects to be implemented by City agencies, with additional projects to be completed by external agencies such as the Caltrain Downtown Extension (known as DTX), BART underground pedestrian connector, open space projects to be performed by the Office of Community Investment and Infrastructure, and sustainable resource district projects.
In addition to Impact Fees as a primary source of funding infrastructure projects, the Transit Center District Plan has also implemented a Community Facilities District (CFD) special use tax that will provide funding for projects in the neighborhood. The total revenues estimated for the proposed projects in the Transit Center District is $373 million, including prior years. The tables on the following page show the Transit Center District spending plan, sources of funds, and funding gap.
Return to Impact Fee Areas
| Key Proposed Eastern Neighborhoods Projects through 2029 |
|---|
| COMPLETE STREETS |
|
District-wide Streetscape and Pedestrian Improvements |
| Mid-block Crossings Signalization Changes |
| Casual Carpool Waiting Area |
| TRANSIT |
|
Caltrain Downtown Extension (DTX) |
| BART Station Capacity Improvements |
| Congestion Charging Pilot Transit Delay Mitigation |
| RECREATION AND OPEN SPACE |
|
Portsmouth Square Improvements |
| 2nd & Howard Park |
| Hub Open Space Improvements |
| SPENDING PLAN (Dollars in Thousands) |
Prior Years | FY 2020 |
FY 2021 |
FY 2022 |
FY 2023 |
FY 2024 |
FY 2025 - 2029 | Plan Total |
|---|---|---|---|---|---|---|---|---|
|
Complete Streets |
68,378 |
10,817 |
1,000 |
750 |
|
|
|
12,567 |
| Open Space | 53,038 | - | - | - | - | - | - | - |
| TOTAL | 121,416 | 10,817 | 1,000 | 750 | - | - | - | 12,567 |
| REVENUES | ||||||||
|
Impact Fees |
96,503 |
11,068 |
1,728 |
834 |
- |
- |
49,278 |
62,907 |
| Bonds | 19,789 | 3,767 | - | - | - | - | - | 3,767 |
| Other Local | 18,456 | - | - | - | - | 172,000 | - | 172,000 |
| TOTAL | 134,748 | 14,834 | 1,728 | 834 | - | 172,000 | 49,278 | 238,674 |
| Cumulative | ||||||||
| Annual Surplus (Deficit) |
13,332 |
4,018 | 728 | 84 | - | 172,000 | 49,278 | 239,439 |

