Introduction: Introduction
Introduction
This Capital Plan identifies planned funding of $38 billion over 10 years. Despite this investment, the Plan defers over $7 billion in identified needs for General Fund departments.
San Francisco’s Capital Plan reflects confidence in the City’s capacity to administer our capital program in a responsible and transparent manner that employs best practices in financial management. This includes establishing financial constraints around each funding program to promote its long-term viability, listing unfunded and deferred projects, and establishing funding principles.
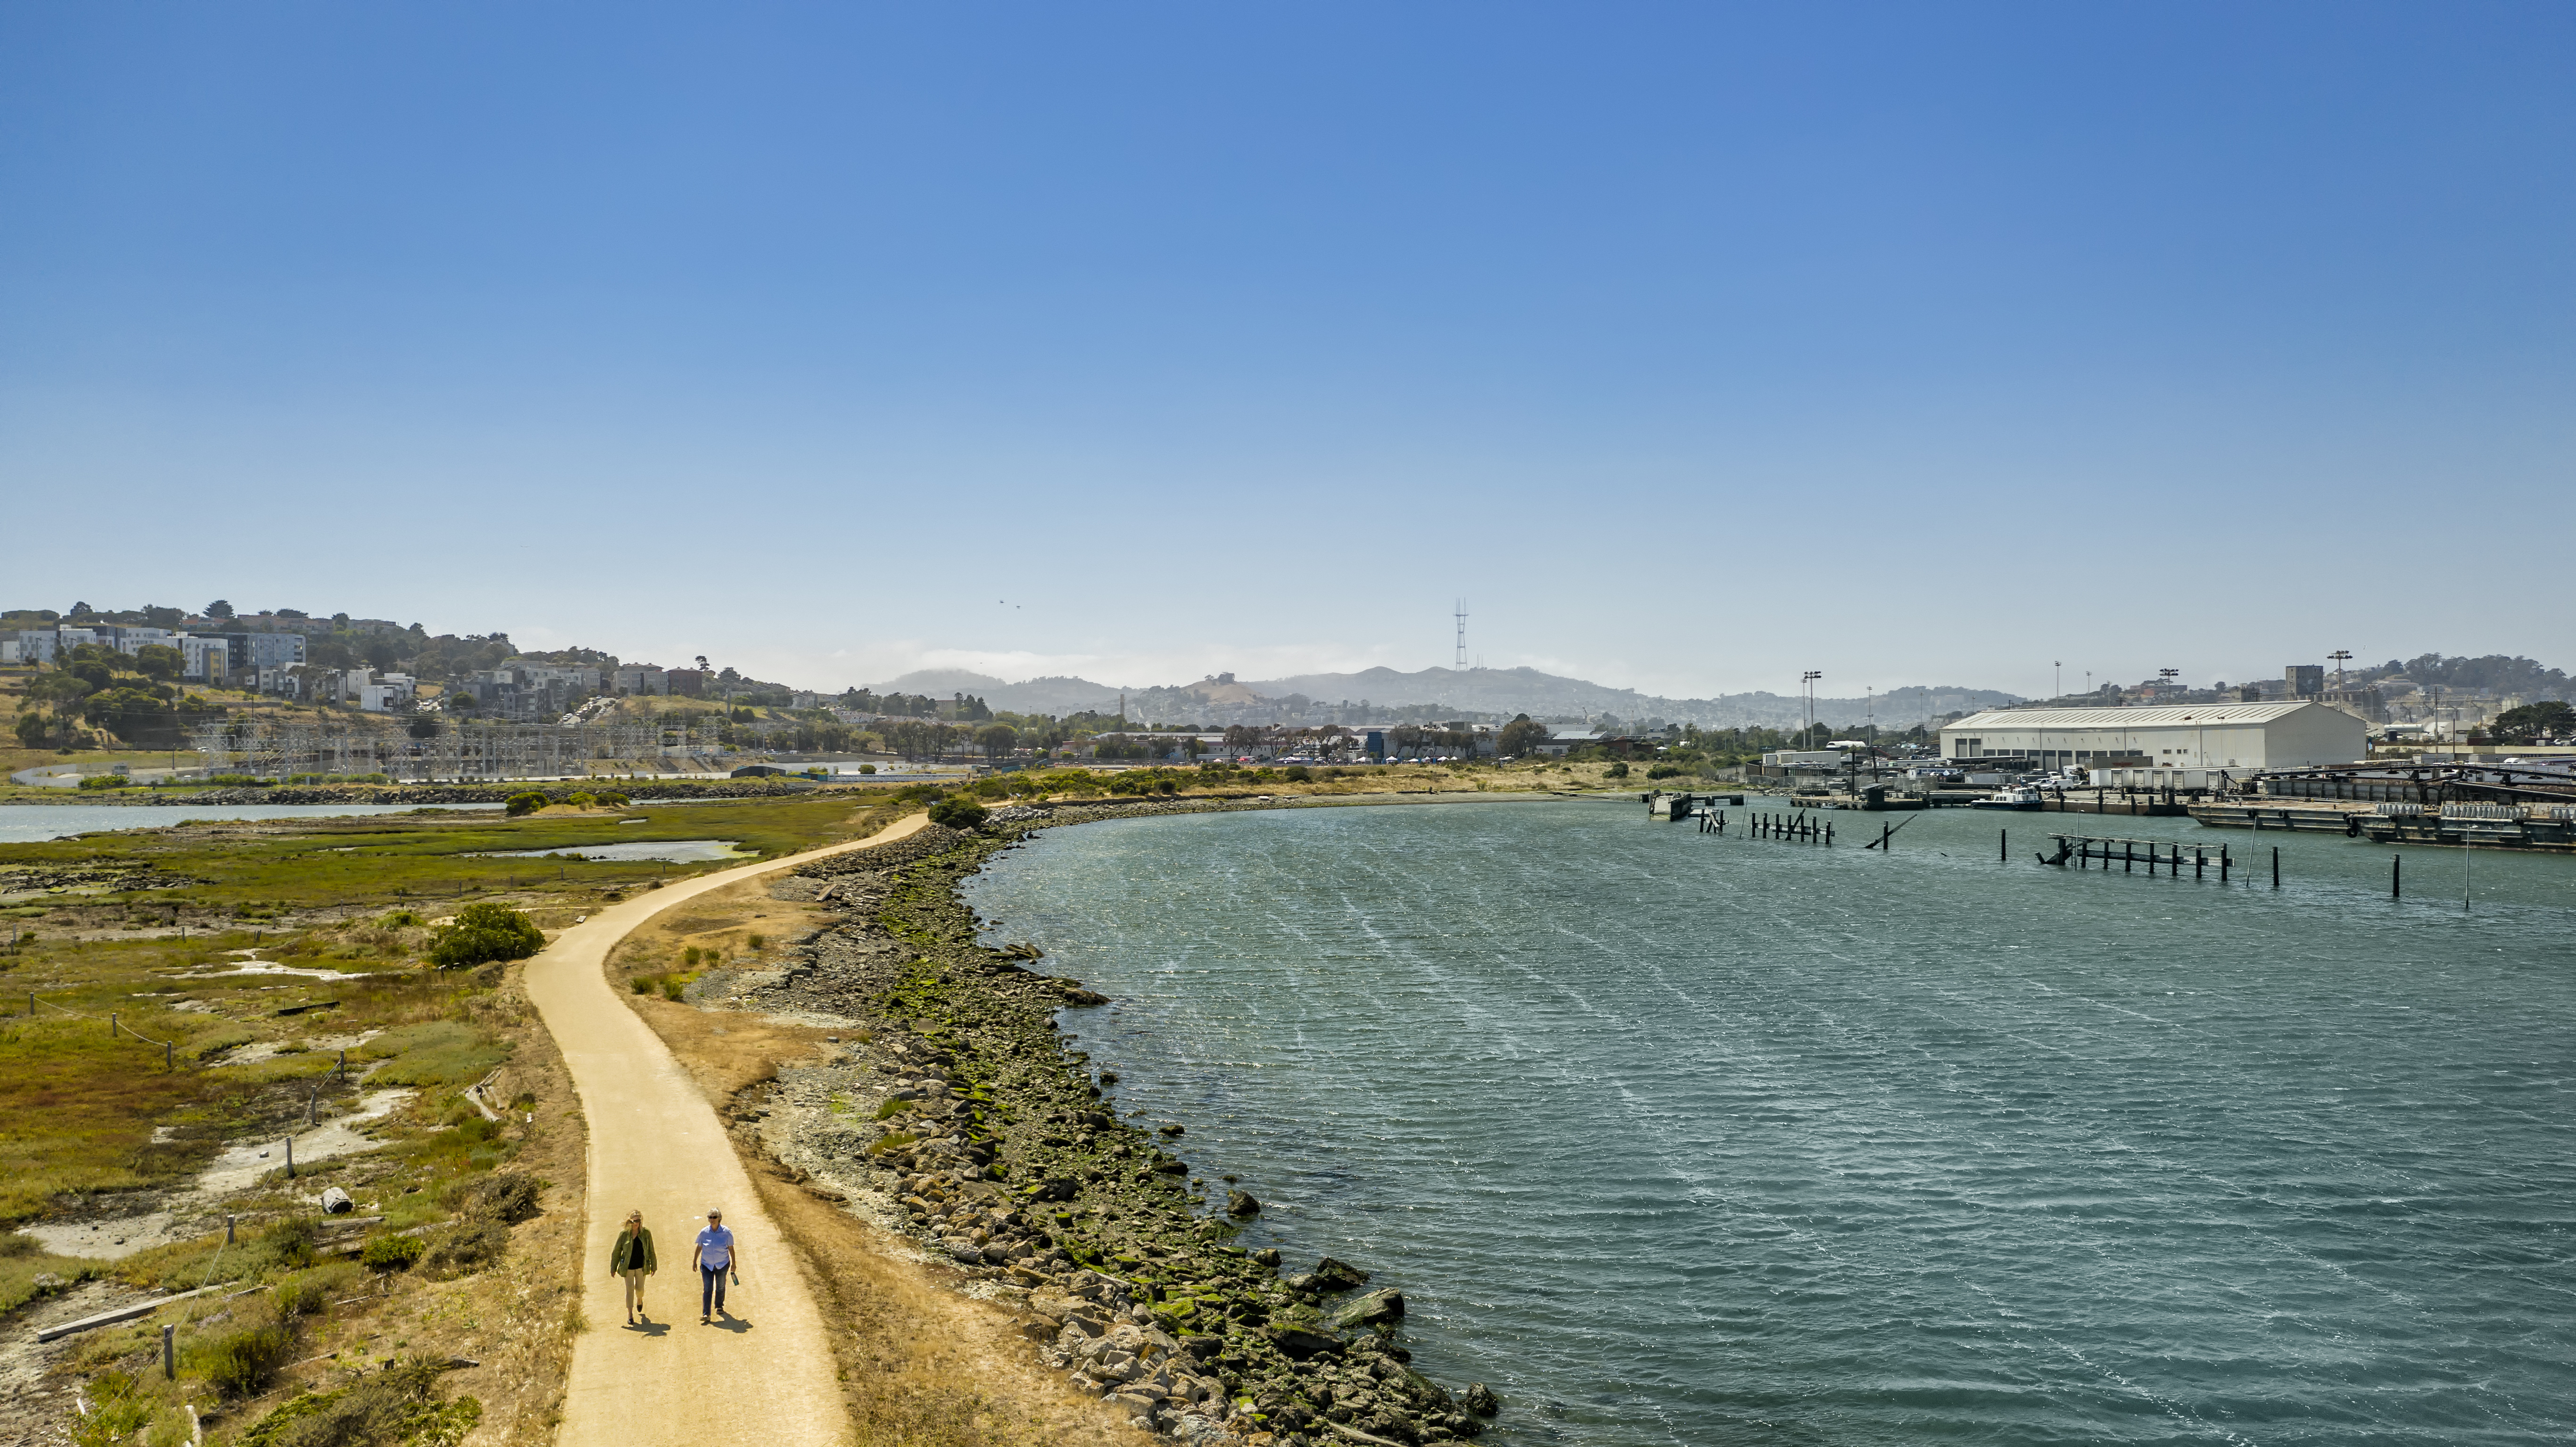
Taking care of our capital infrastructure is an important part of building a resilient city. Resilience includes eliminating racial and social disparities so that all San Franciscans may recover and thrive no matter the shocks and stresses they face.
This Capital Plan recommends historic levels of funding at $39 billion over 10 years, compared to $35 billion in the last Plan two years ago. Despite this, the Plan defers nearly $5 billion in identified needs for General Fund departments.
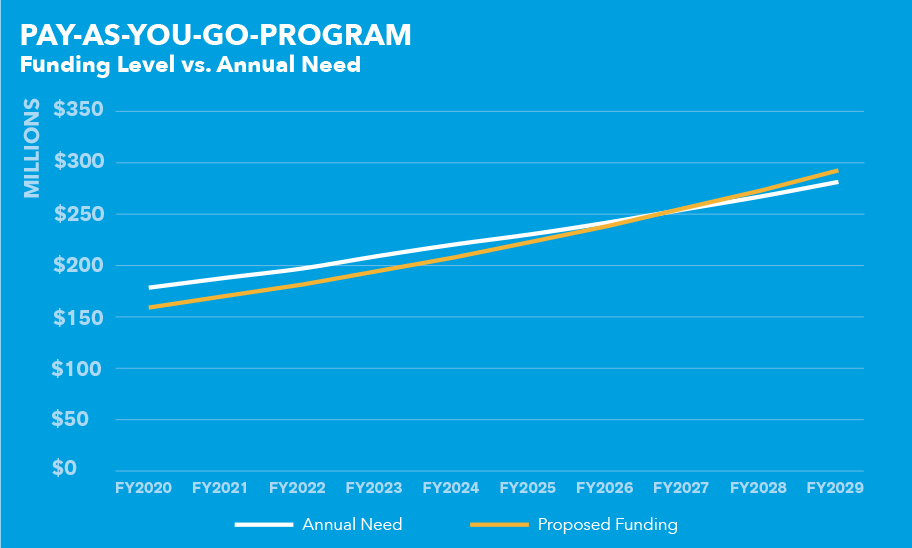
Chart 1.3 shows that San Francisco will begin to fully address its annual renewal needs starting in FY2027 if the Pay-Go Program is funded at Plan-recommended levels. This is the first time in recent years that the backlog is expected to decrease in the Plan’s timeframe. It is important that the City take advantage of current economic conditions to achieve or exceed the recommendations of this Plan to continue to make progress against the backlog.
San Francisco’s growing Capital Plan reflects confidence in the City’s capacity to administer our capital program in a responsible and transparent manner that employs best practices in financial management. This includes establishing financial constraints around each funding program to promote its long-term viability, listing unfunded and deferred projects, and establishing funding principles.
Taking care of our capital infrastructure is an important part of building a resilient city. Throughout this Plan, San Francisco has prioritized projects and initiatives that build the capacity of individuals, communities, institutions, businesses, and systems to survive, adapt, and grow, no matter what kind of chronic stresses and acute shocks they may experience.
This Capital Plan recommends historic levels of funding at $35 billion over 10 years, compared to $32 billion in the last Plan two years ago. Despite this, the Plan defers $4.6 billion in identified needs for General Fund departments.
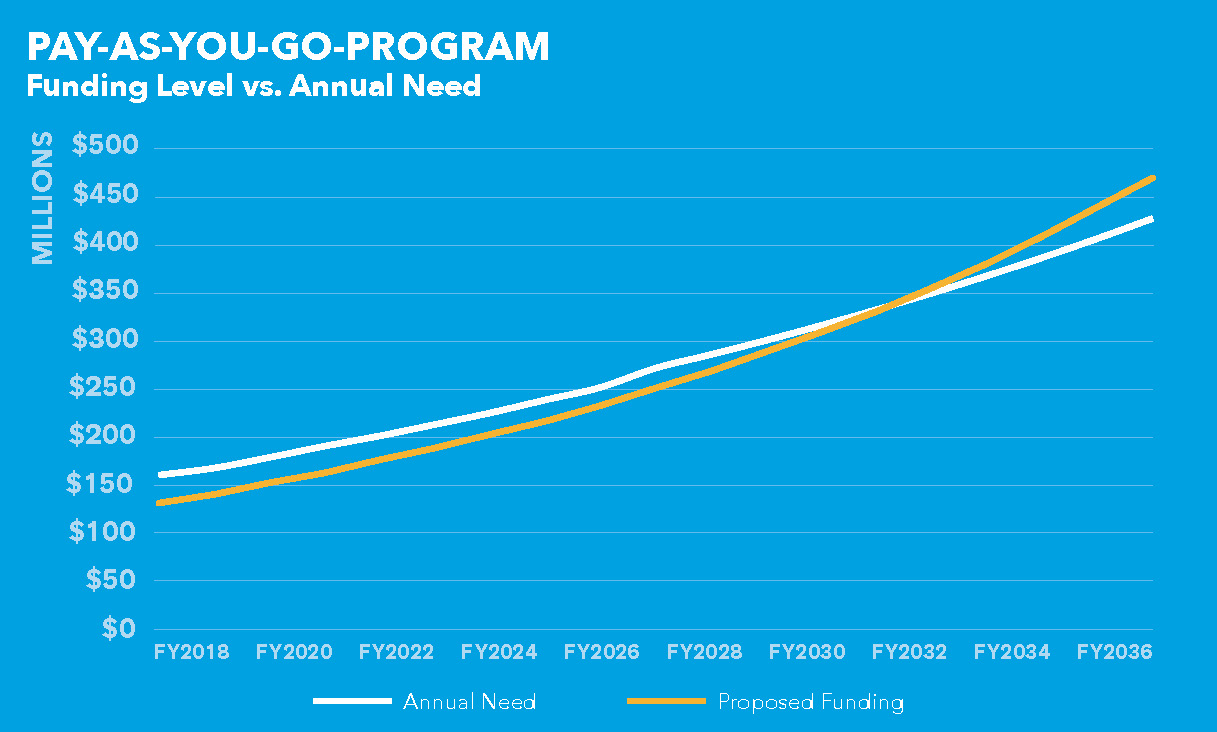
Chart 1.3 shows that San Francisco will begin to fully address its annual renewal needs starting in FY2032 if it funds the Pay-Go Program at Plan-recommended levels. However, due to the accumulation of deferred maintenance and cost escalation, the backlog is not expected to decrease. It is important that the City take advantage of current economic conditions to achieve or exceed the recommendations of this Plan.
San Francisco’s growing Capital Plan reflects confidence in the City’s capacity to administer our capital program in a responsible and transparent manner that employs best practices in financial management. This includes establishing financial constraints around each funding program to promote its long-term viability, listing unfunded and deferred projects, and establishing funding principles.
Taking care of our capital infrastructure is an important part of building a resilient city. Throughout this Plan, San Francisco has prioritized projects and initiatives that build the capacity of individuals, communities, institutions, businesses, and systems to survive, adapt, and grow, no matter what kind of chronic stresses and acute shocks they may experience.
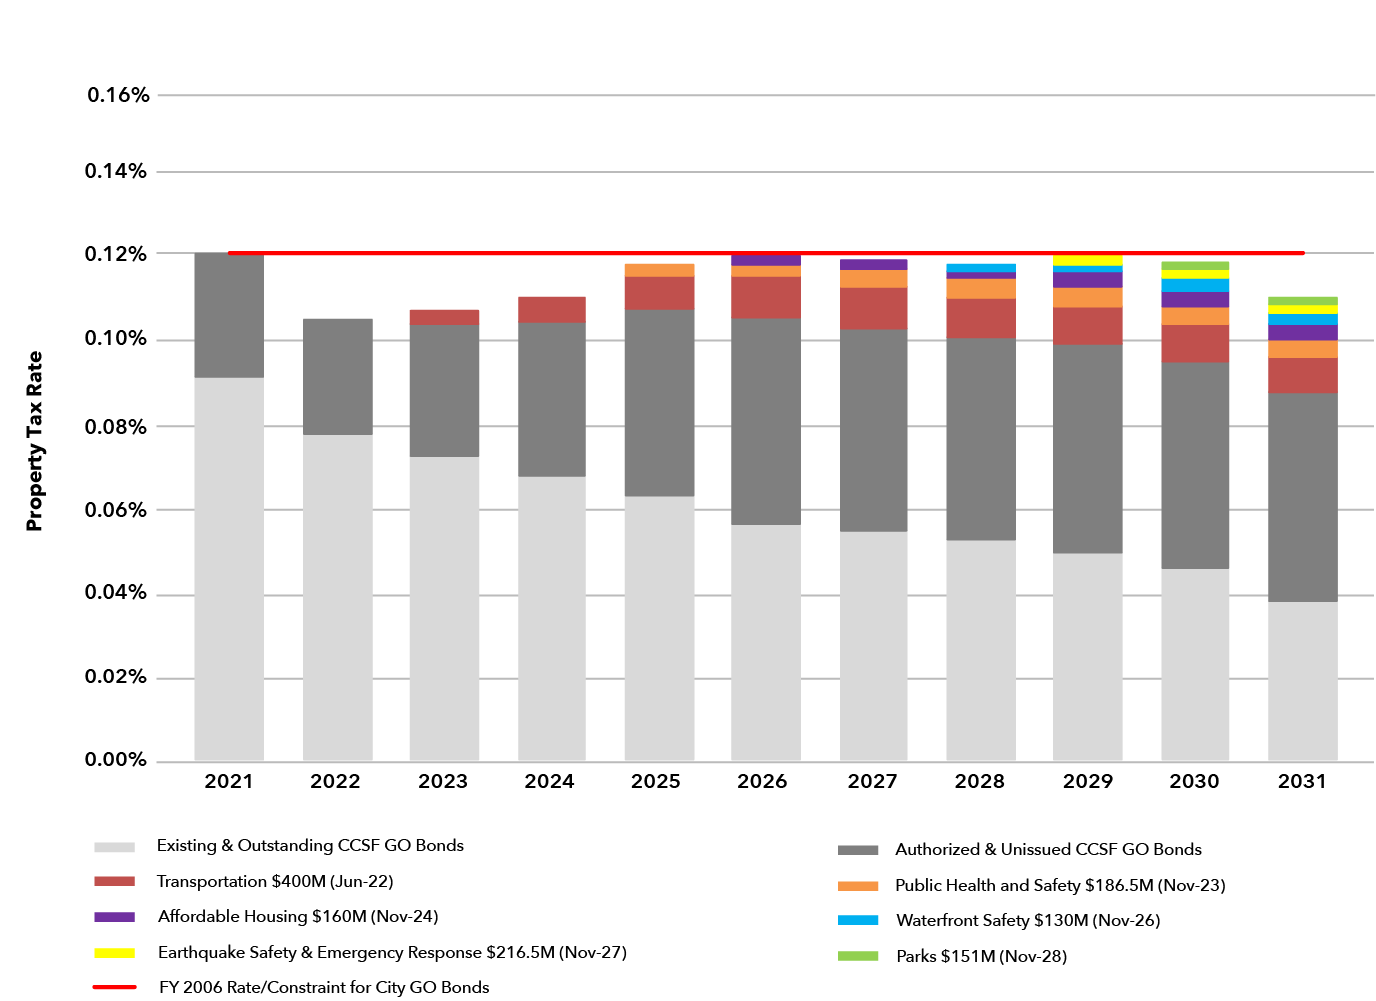
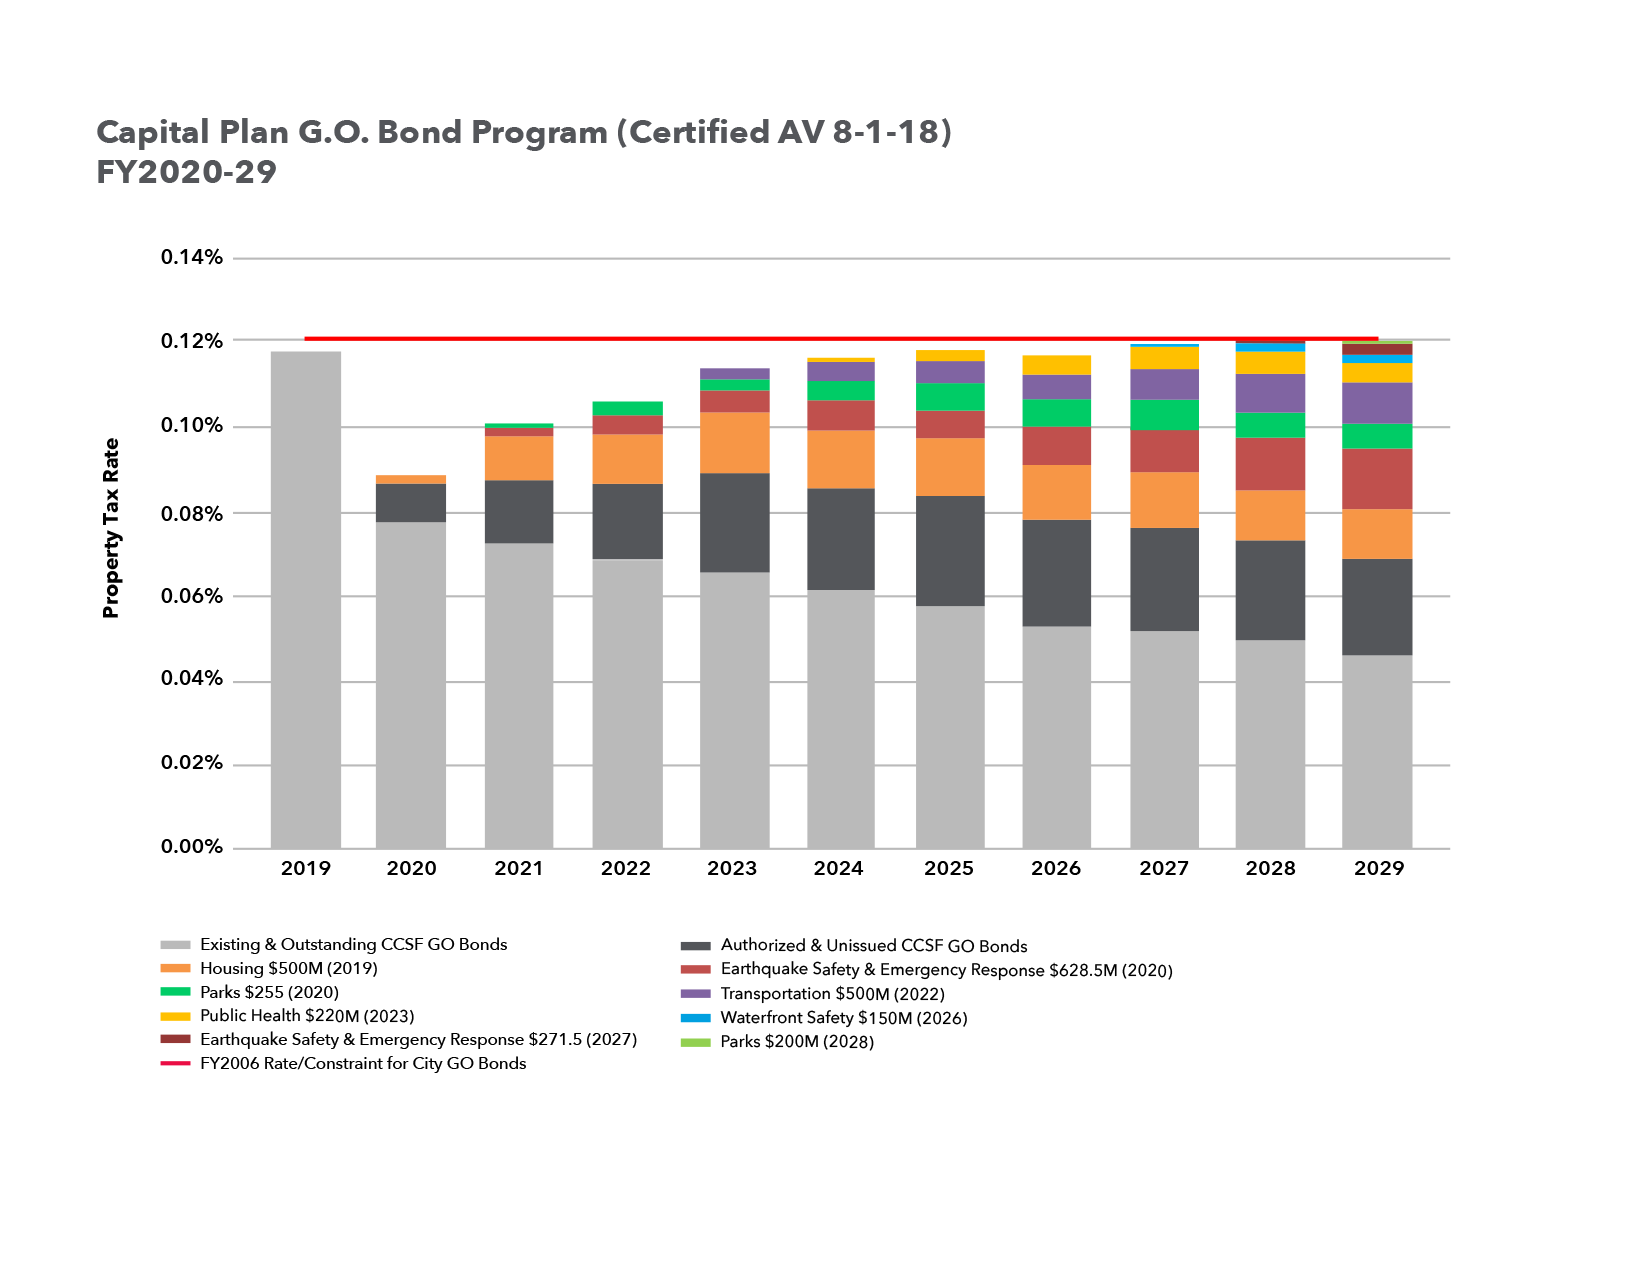
The Plan anticipates $1.2 billion in General Obligation (G.O.) Bonds over the next 10 years. G.O. Bonds are backed by the City’s property tax revenue and are repaid directly out of property taxes through a fund held by the Treasurer’s Office. As a result of the successful passage of several bonds in the past few years, the capacity of the G.O. Bond Program is $1.5 billion (or 54 percent) lower than the previous 10-Year Capital Plan. This means the Plan is recommending fewer and smaller bonds than in previous years.
Table 1.5 shows the Capital Plan’s G.O. Bond Program for the next 10 years.
Chart 1.1 illustrates the relationship between the G.O. Bond Program and the local property tax rate, including existing and outstanding issuance and voter-approved Bonds. This view shows the City’s policy constraint that G.O. Bonds will not increase the property tax rate above 2006 levels.
All future debt program amounts are estimates and may be adjusted.
Table 1.5
| G.O. Bond Program | ||
| (Dollars in Millions) | ||
| Election Date | Bond Program | Amount |
| Jun-22 | Transportation | 400 |
| Nov-23 | Public Health | 188 |
| Nov-24 | Affordable Housing | 160 |
| Nov-26 | Waterfront Safety | 130 |
| Nov-27 | Earthquake Safety & Emergency Response | 217 |
| Nov-28 | Parks and Open Space | 151 |
| Nov-31 | Public Health | TBD |
| Total | 1,245 | |
Chart 1.1
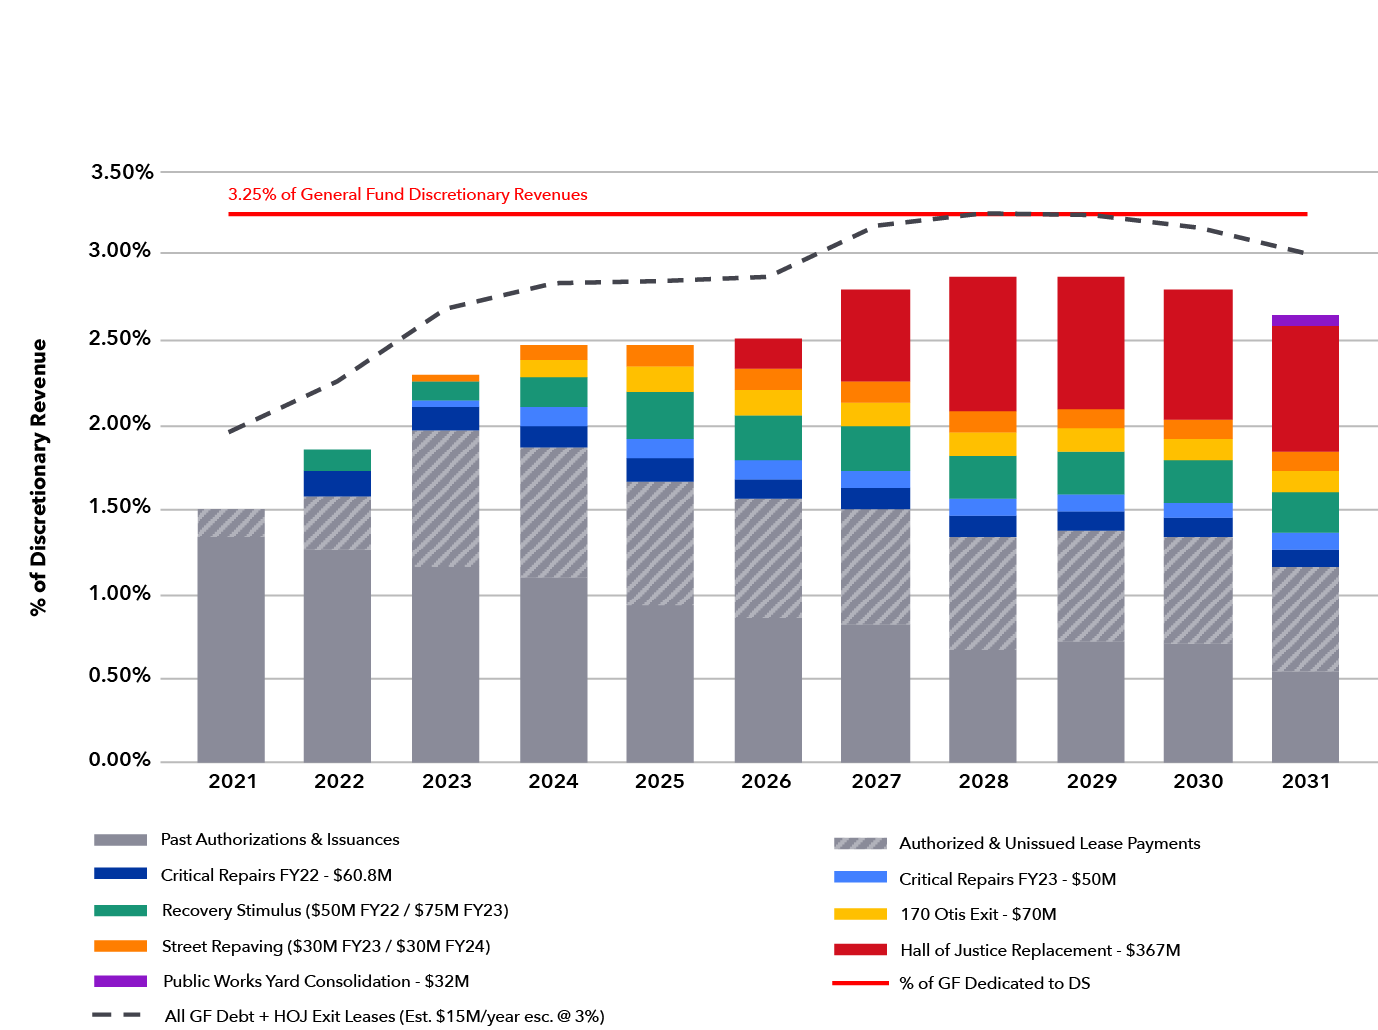
The Plan anticipates $765 million in Certificates of Participation (COPs), also known as General Fund debt, over the next 10 years. COPs are backed by a physical asset in the City’s capital portfolio and repayments are appropriated each year out of the General Fund. While the overall COP program is $200 million lower than the previous Plan, it makes significant commitments in the early years to address reductions in the Pay-Go program and support projects to promote economic stimulus and racial equity.
Table 1.6 shows the Capital Plan’s COP Program for the next 10 years.
Chart 1.2 illustrates the COP program against the City’s policy constraint for General Fund debt not to exceed 3.25% of General Fund Discretionary Revenue.
All amounts attributed to future debt programs are estimates and may need to be adjusted.
Table 1.6
| COP Program | ||
| (Dollars in Millions) | ||
| Fiscal Year of Issuance | Project | Amount |
| FY2022 | Critical Repairs | 61 |
| FY2022 | Recovery Stimulus | 50 |
| FY2023 | Relocation of HSA Headquarters | 70 |
| FY2023 | Critical Repairs | 50 |
| FY2023 | Recovery Stimulus | 75 |
| FY2023 | Street Resurfacing | 30 |
| FY2024 | Street Resurfacing | 30 |
| FY2025 | HOJ Consolidation Project | 367 |
| FY2031 | Public Works Yard Consolidation | 32 |
| Total | 765 | |
Chart 1.2
The Plan anticipates $2.7 billion in General Obligation (G.O.) Bonds over the next 10 years. G.O. Bonds are backed by the City’s property tax revenue and are repaid directly out of property taxes through a fund held by the Treasurer’s Office.
Table 1.5 shows the Capital Plan’s G.O. Bond Program for the next 10 years.
Chart 1.1 illustrates the relationship between the G.O. Bond Program and the local property tax rate, including existing and outstanding issuance and voter-approved Bonds. This view shows the City’s policy constraint that G.O. Bonds will not increase the property tax rate above 2006 levels.
All amounts attributed to future debt programs are estimates and may need to be adjusted.
| G.O. Bond Program (Dollars in Millions) |
||
|---|---|---|
| Election Date | Bond Program | Amount |
| November 2019 | Affordable Housing | 500 |
| March 2020 | Earthquake Safety & Emergency Response | 628.5 |
| November 2020 | Parks & Open Space | 255 |
| June 2022 | Transportation | 500 |
| November 2023 | Public Health | 220 |
| November 2026 | Waterfront Safety | 150 |
| November 2027 | Earthquake Safety & Emergency Response | 271.5 |
| November 2028 | Parks & Open Space | 200 |
| Total | 2,725 | |
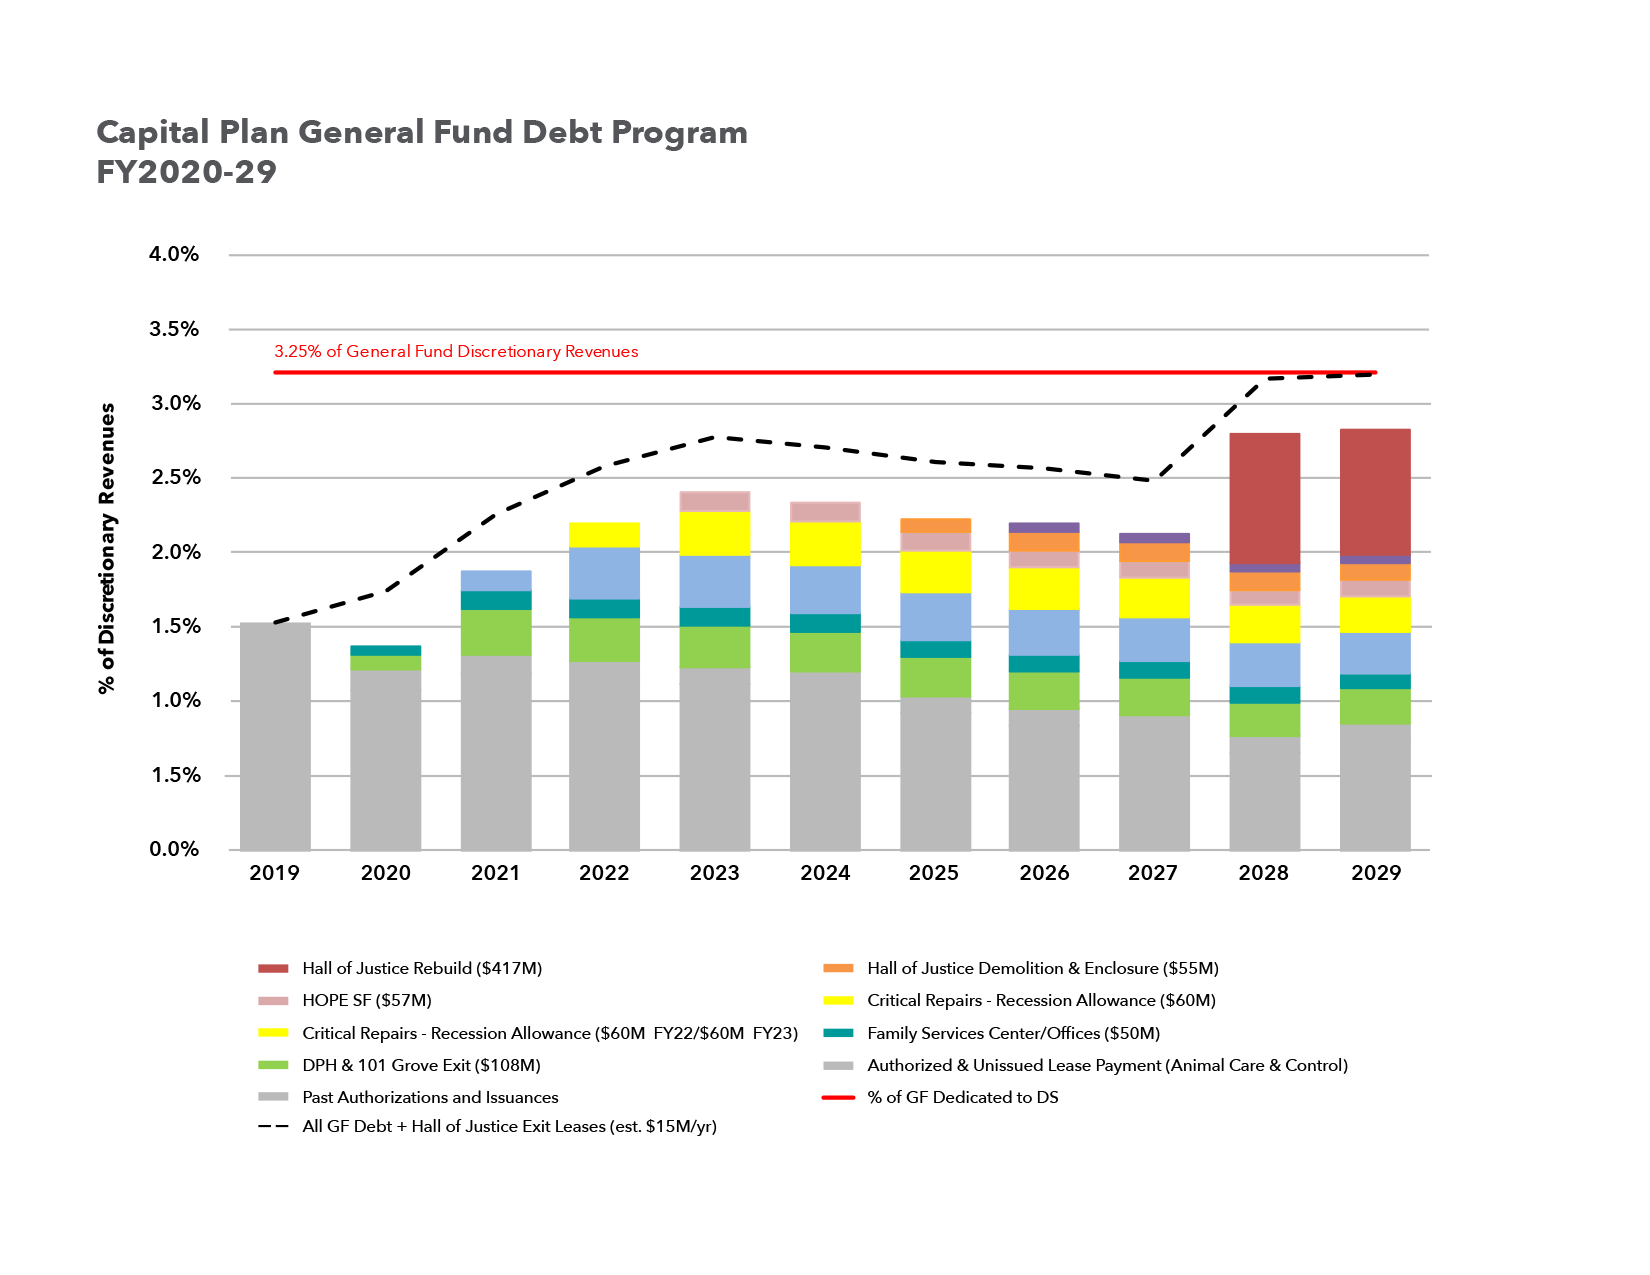
The Plan anticipates $963 million in Certificates of Participation (COPs), also known as General Fund debt, over the next 10 years. COPs are backed by a physical asset in the City’s capital portfolio, and repayments are appropriated each year out of the General Fund.
Table 1.6 shows the Capital Plan’s COP Program for the next 10 years.
Chart 1.2 illustrates the COP program against the City’s policy constraint for General Fund debt not to exceed 3.25% of General Fund Discretionary Revenue.
All amounts attributed to future debt programs are estimates and may need to be adjusted.
| COPs FY2018-2027 (Dollars in Millions) |
||
|---|---|---|
| Year of Issuance | Project | Amount |
| FY2019 | Public Health 101 Grove Exit | 108 |
| FY2019 | HOPE SF Horizontal Infrastructure | 57 |
| FY2020 | Family Services Center/City Offices | 50 |
| FY2020 | Hall of Justice Relocation Projects | 131 |
| FY2022 | Critical Repairs Recession Allowance | 60 |
| FY2023 | Critical Repairs Recession Allowance | 60 |
| FY2025 | Hall of Justice Demolition & Enclosure | 55 |
| FY2026 | Public Works Yards Consolidation | 25 |
| FY2028 | Hall of Justice Consolidation Plan | 417 |
| Total | 963 | |
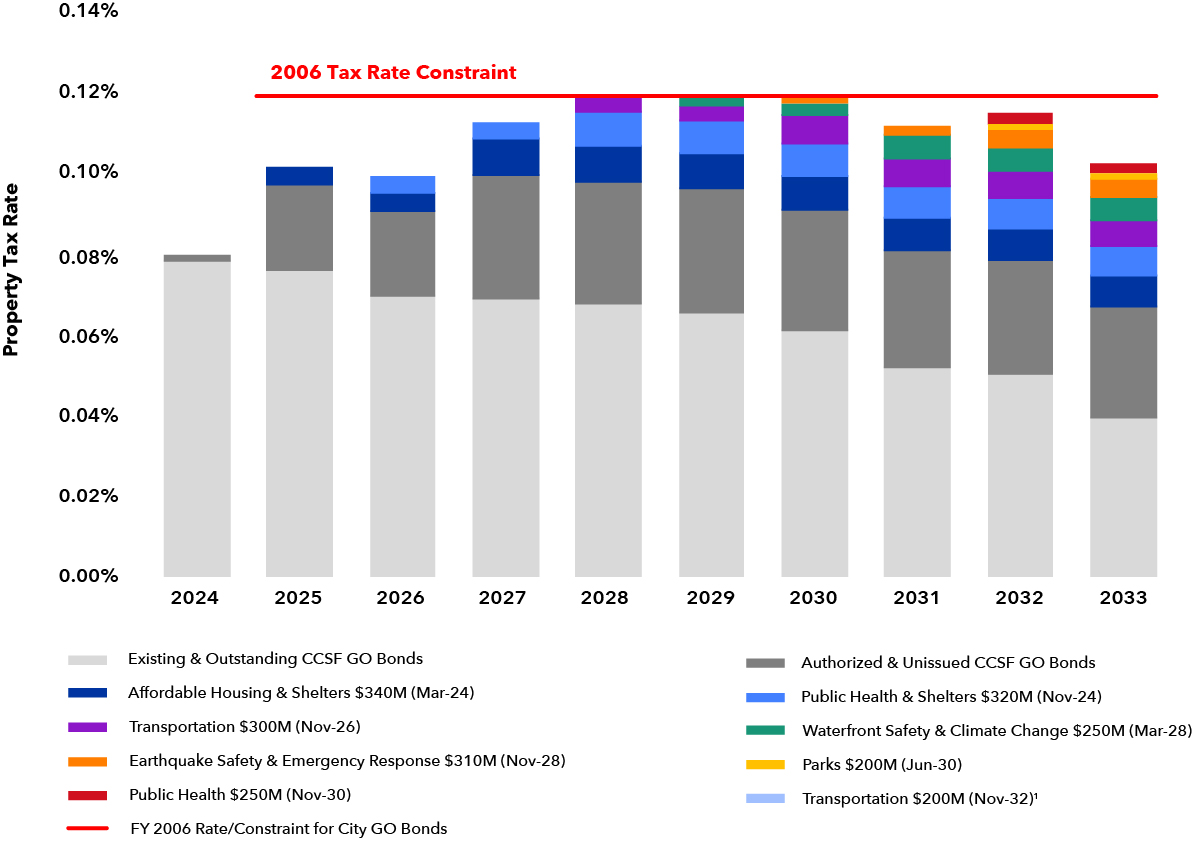
The Plan anticipates $2 billion in General Obligation (G.O.) Bonds over the next 10 years. G.O. Bonds are backed by the City’s property tax revenue and are repaid directly out of property taxes through a fund held by the Treasurer’s Office. As a result of the successful passage of several large bonds in the past few years, the capacity of the G.O. Bond Program is fairly limited in the near-term.
Table 1.5 shows the Capital Plan’s G.O. Bond Program for the next 10 years.
Chart 1.1 illustrates the relationship between the G.O. Bond Program and the local property tax rate, including existing and outstanding issuance and voter-approved Bonds. This view shows the City’s policy constraint that G.O. Bonds will not increase the property tax rate above 2006 levels.
All amounts attributed to future debt programs are estimates and may need to be adjusted.
Table 1.5
|
G.O. Bond Debt Program (Dollars in Millions) |
|||||||||
|---|---|---|---|---|---|---|---|---|---|
|
Election Date |
Bond Program |
Amount |
|||||||
|
Mar 2024 |
Affordable Housing & Shelters |
340 |
|||||||
|
Nov 2024 |
Public Health & Shelters |
320 |
|||||||
|
Nov 2026 |
Transportation |
300 |
|||||||
|
Mar 2028 |
Waterfront and Climate Safety |
250 |
|||||||
|
Nov 2028 |
Earthquake Safety & Emergency Response |
310 |
|||||||
|
Jun 2030 |
Parks and Open Space |
200 |
|||||||
|
Nov 2030 |
Public Health |
250 |
|||||||
|
Nov 2032 |
Transportation |
200 |
|||||||
|
Total |
|
2,170 |
|||||||
Chart 1.1
This Plan compiles information provided by the City’s Enterprise departments— the Port of San Francisco, the San Francisco Municipal Transportation Agency (SFMTA), San Francisco International Airport (SFO), and the San Francisco Public Utilities Commission (SFPUC). Those departments have their own timelines and Commissions that govern their capital processes. The information in this Plan represents the best available at the time of publication.
The Plan captures nearly $18 billion in Enterprise department capital investments during the next 10 years.
Major projects identified in the last Plan such as the Seawall, Central Subway, the Transbay Transit Center, Pier 70, and SFO terminal improvements, are proceeding. Additional Enterprise department needs have arisen, notably the need to build adequate facilities to support our growing transit fleet.
Enterprise departments appear in the Plan’s G.O. Bond Program. The SFMTA passed a $500 million Transportation G.O. Bond in 2014, and the Seawall won approval for a $425 million G.O. Bond in 2018. The next Transportation G.O. Bond is planned for 2022.
The Enterprise departments also issue revenue bonds against the revenues generated from user fees, taxes, and surcharges. Table 1.4 shows the current amount of revenue bonds to be issued for each department over the 10-year term of this Plan. As with the G.O. Bond and COP Programs, all revenue bond issuances are subject to change based on market conditions and cash flow needs of the associated projects.
For external agencies—City College of San Francisco, San Francisco Unified School District, the San Francisco Housing Authority, Treasure Island Development Agency, and the Office of Community Investment & Infrastructure (the successor agency to the Redevelopment Authority)—the Plan shows over $15 billion in capital investments over the next 10 years. As affordable housing funding supports the development of units that will ultimately be held and managed by third parties, planned investments in that area are represented as external, including those funds administered by the Mayor’s Office of Housing and Community Development.
Table 1.4
| Planned Revenue Bond Issuances FY2022-31 (Dollars in Millions) |
|||
| Agency | FY22-26 | FY27-31 | Total |
| SFPUC | 4,549 | 2,236 | 6,785 |
| Airport | 1,189 | 0 | 1,189 |
| Total | 5,738 | 2,236 | 7,974 |
This Plan compiles information provided by the City’s Enterprise departments— the Port of San Francisco, the San Francisco Metropolitan Transportation Agency, San Francisco International Airport, and the San Francisco Public Utilities Commission. Those departments have their own timelines and Commissions that govern their capital processes. The information in this Plan represents the best available at the time of publication.
The Plan captures over $20 billion in Enterprise department capital investments during the next 10 years.
Major projects identified in the last Plan such as the Seawall, Central Subway, the Transbay Transit Center, Pier 70, and SFO terminal improvements, are proceeding. Additional Enterprise department needs have arisen, notably the need to build adequate facilities to support our growing transit fleet.
Enterprise departments appear in this Plan’s G.O. Bond Program. The SFMTA passed a $500 million Transportation G.O. Bond in 2014, and the Seawall won approval for a $425 million G.O. Bond in 2018. The next Transportation G.O. Bond is here planned for 2022.
The Enterprise departments also issue revenue bonds against the revenues generated from user fees, taxes, and surcharges. Table 1.4 shows the current amount of revenue bonds to be issued for each department over the 10-year term of this Plan.
As with the G.O. Bond and COP Programs, all revenue bond issuances are subject to change based on market conditions and cash flow needs of the associated projects.
For external agencies—City College of San Francisco, San Francisco Unified School District, the San Francisco Housing Authority, Treasure Island Development Agency, and the Office of Community Investment & Infrastructure (the successor agency to the Redevelopment Authority)—the Plan shows $14 billion in capital investments over the next 10 years. As affordable housing funding supports the development of units that will ultimately be held and managed by third parties, planned investments in that area are represented as external.
| Amount of Revenue Bond Issuances FY2020-29 (Dollars in Millions) |
|||
|---|---|---|---|
| Agency | FY20-24 | FY25-29 | Total |
| SFPUC | 4,556 | 1,233 | 5,789 |
| Airport | 4,363 | - | 4,363 |
| SFMTA | 0.2 | - | 0.2 |
| Total | 8,919 | 1,233 | 10,152 |
This Plan compiles information provided by the City’s Enterprise departments— the Port of San Francisco, the San Francisco Metropolitan Transportation Agency, San Francisco International Airport, and the San Francisco Public Utilities Commission. Those departments have their own timelines and Commissions that govern their capital processes. The information in this Plan represents the best available at the time of publication.
The Plan captures nearly $19 billion in Enterprise department capital investments during the next 10 years, a 3.8% increase from the previous Plan.
Major projects identified in the last Plan such as the Central Subway, the Transbay Transit Center, Pier 70, and SFO terminal improvements, are proceeding. Additional Enterprise department needs have arisen, most notably the need to fortify the Seawall along the northern waterfront to protect the buildings, transportation systems, and horizontal infrastructure in that part of the city, as well as the residents, workers, and visitors who frequent there.
Enterprise departments appear in this Plan’s G.O. Bond Program. The SFMTA passed a $500 million Transportation G.O. Bond in 2014, and there is another one planned for 2024, as well as a $350 million bond to fortify the Seawall in 2018.
The Enterprise departments also issue revenue bonds against the revenues generated from user fees, taxes, and surcharges. Table 1.4 shows the current amount of revenue bonds to be issued for each department over the 10-year term of this Plan.
As with the G.O. Bond and COP Programs, all revenue bond issuances are subject to change based on market conditions and cash flow needs of the associated projects.
For external agencies City College of San Francisco, San Francisco Unified School District, the San Francisco Housing Authority, Treasure Island Development Agency, and the Office of Community Investment & Infrastructure (the successor agency to the Redevelopment Authority), the Plan captures $11 billion in capital investments over the next 10 years, a 29% increase from the last Capital Plan.
| Amount of Revenue Bond Issuances FY2018-2027 (Dollars in Millions) |
|||
|---|---|---|---|
| Agency | FY18-22 Amount |
FY23-27 Amount |
Total |
| SFPUC | 5,458 | 1,375 | 6,834 |
| Airport | 5,217 | 5,217 | |
| SFMTA | 150 | 100 | 250 |
| Total | 10,825 | 1,475 | 12,301 |
