2024 - Accomplishments: Health + Human Services Accomplishments
Accomplishments
Department of Public Health
- Commenced investments for Mental Health San Francisco, including construction, acquisition, development, improvement, expansion, rehabilitation, and preservation of priority properties.
- Acquired properties for Crisis Stabilization Unit and Overdose Prevention Program at 822 Geary St./629 Hyde St.
- Completed renovations for Overdose Prevention Program at 444-6th St.
- Completed Drug Sobering Center site lease and renovation.
- Completed programming and schematic planning for Chinatown Public Health Center seismic retrofit with 100% construction documents targeted for completion by Summer 2023.
- Completed construction documents and permitting for renovation of M&O Wings of Laguna Honda Hospital. Project will relocate approximately 400 DPH staff from 101 Grove St. and employees from leased buildings and other seismically poor buildings in the Civic Center area.
- Completed construction documents to relocate Adult Immunization Travel Clinic from 101 Grove to 27 Van Ness Ave.
- Construction progressed at new Public Health Lab at Zuckerberg San Francisco General with completion targeted for early 2024.
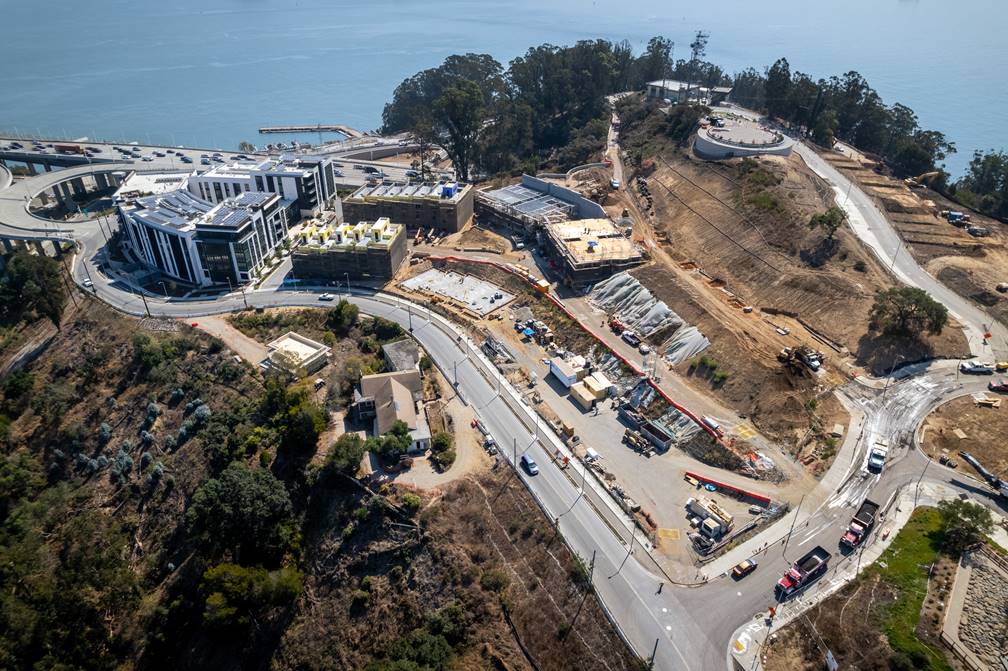
- Completed construction of Maria X Martinez Health Resource Center with successful clinic relocation from 101 Grove in September 2022.
- Completed Southeast Health Center Phase 2 construction of new 20,000 square feet with clinic opened July 2022.
- Completed Maxine Hall Health Center seismic retrofit and modernization with clinic re-opened in October 2021.
- Completed Castro Mission Health Center seismic retrofit and modernization with clinic re-opened August 2022.
- Commenced seismic upgrade to Building 3 at Zuckerberg San Francisco General (ZSFG) with ADA improvements and new finishes for administrative functions.
- Continued ZSFG Building 5 improvements including electrical work, demolition, Phase I seismic retrofit, and space expansions.
- Continued ZSFG Psychiatric Emergency Services expansion and renovation with early demolition and hazardous material abatement underway.
- Achieved 85% construction on UCSF Research Building at ZSFG with relocation of UCSF staff into the new Research Facility phased from Summer 2023 to Fall 2023.
- Completed feasibility study for Laguna Honda Simon Theatre Cooling Center to provide a safe meeting space for residents on extremely hot days.
- Completed installation of dry fire suppression system in the Laguna Honda Hospital server rooms.
- Completed Nurse Office Emergency Power Project at Laguna Honda Hospital to provide partial emergency power with full emergency power project planned.
- Removed fuel tank that fed former gas boiler that was replaced with an electric unit at Laguna Honda Hospital.
Human Services and Homelessness and Supportive Housing
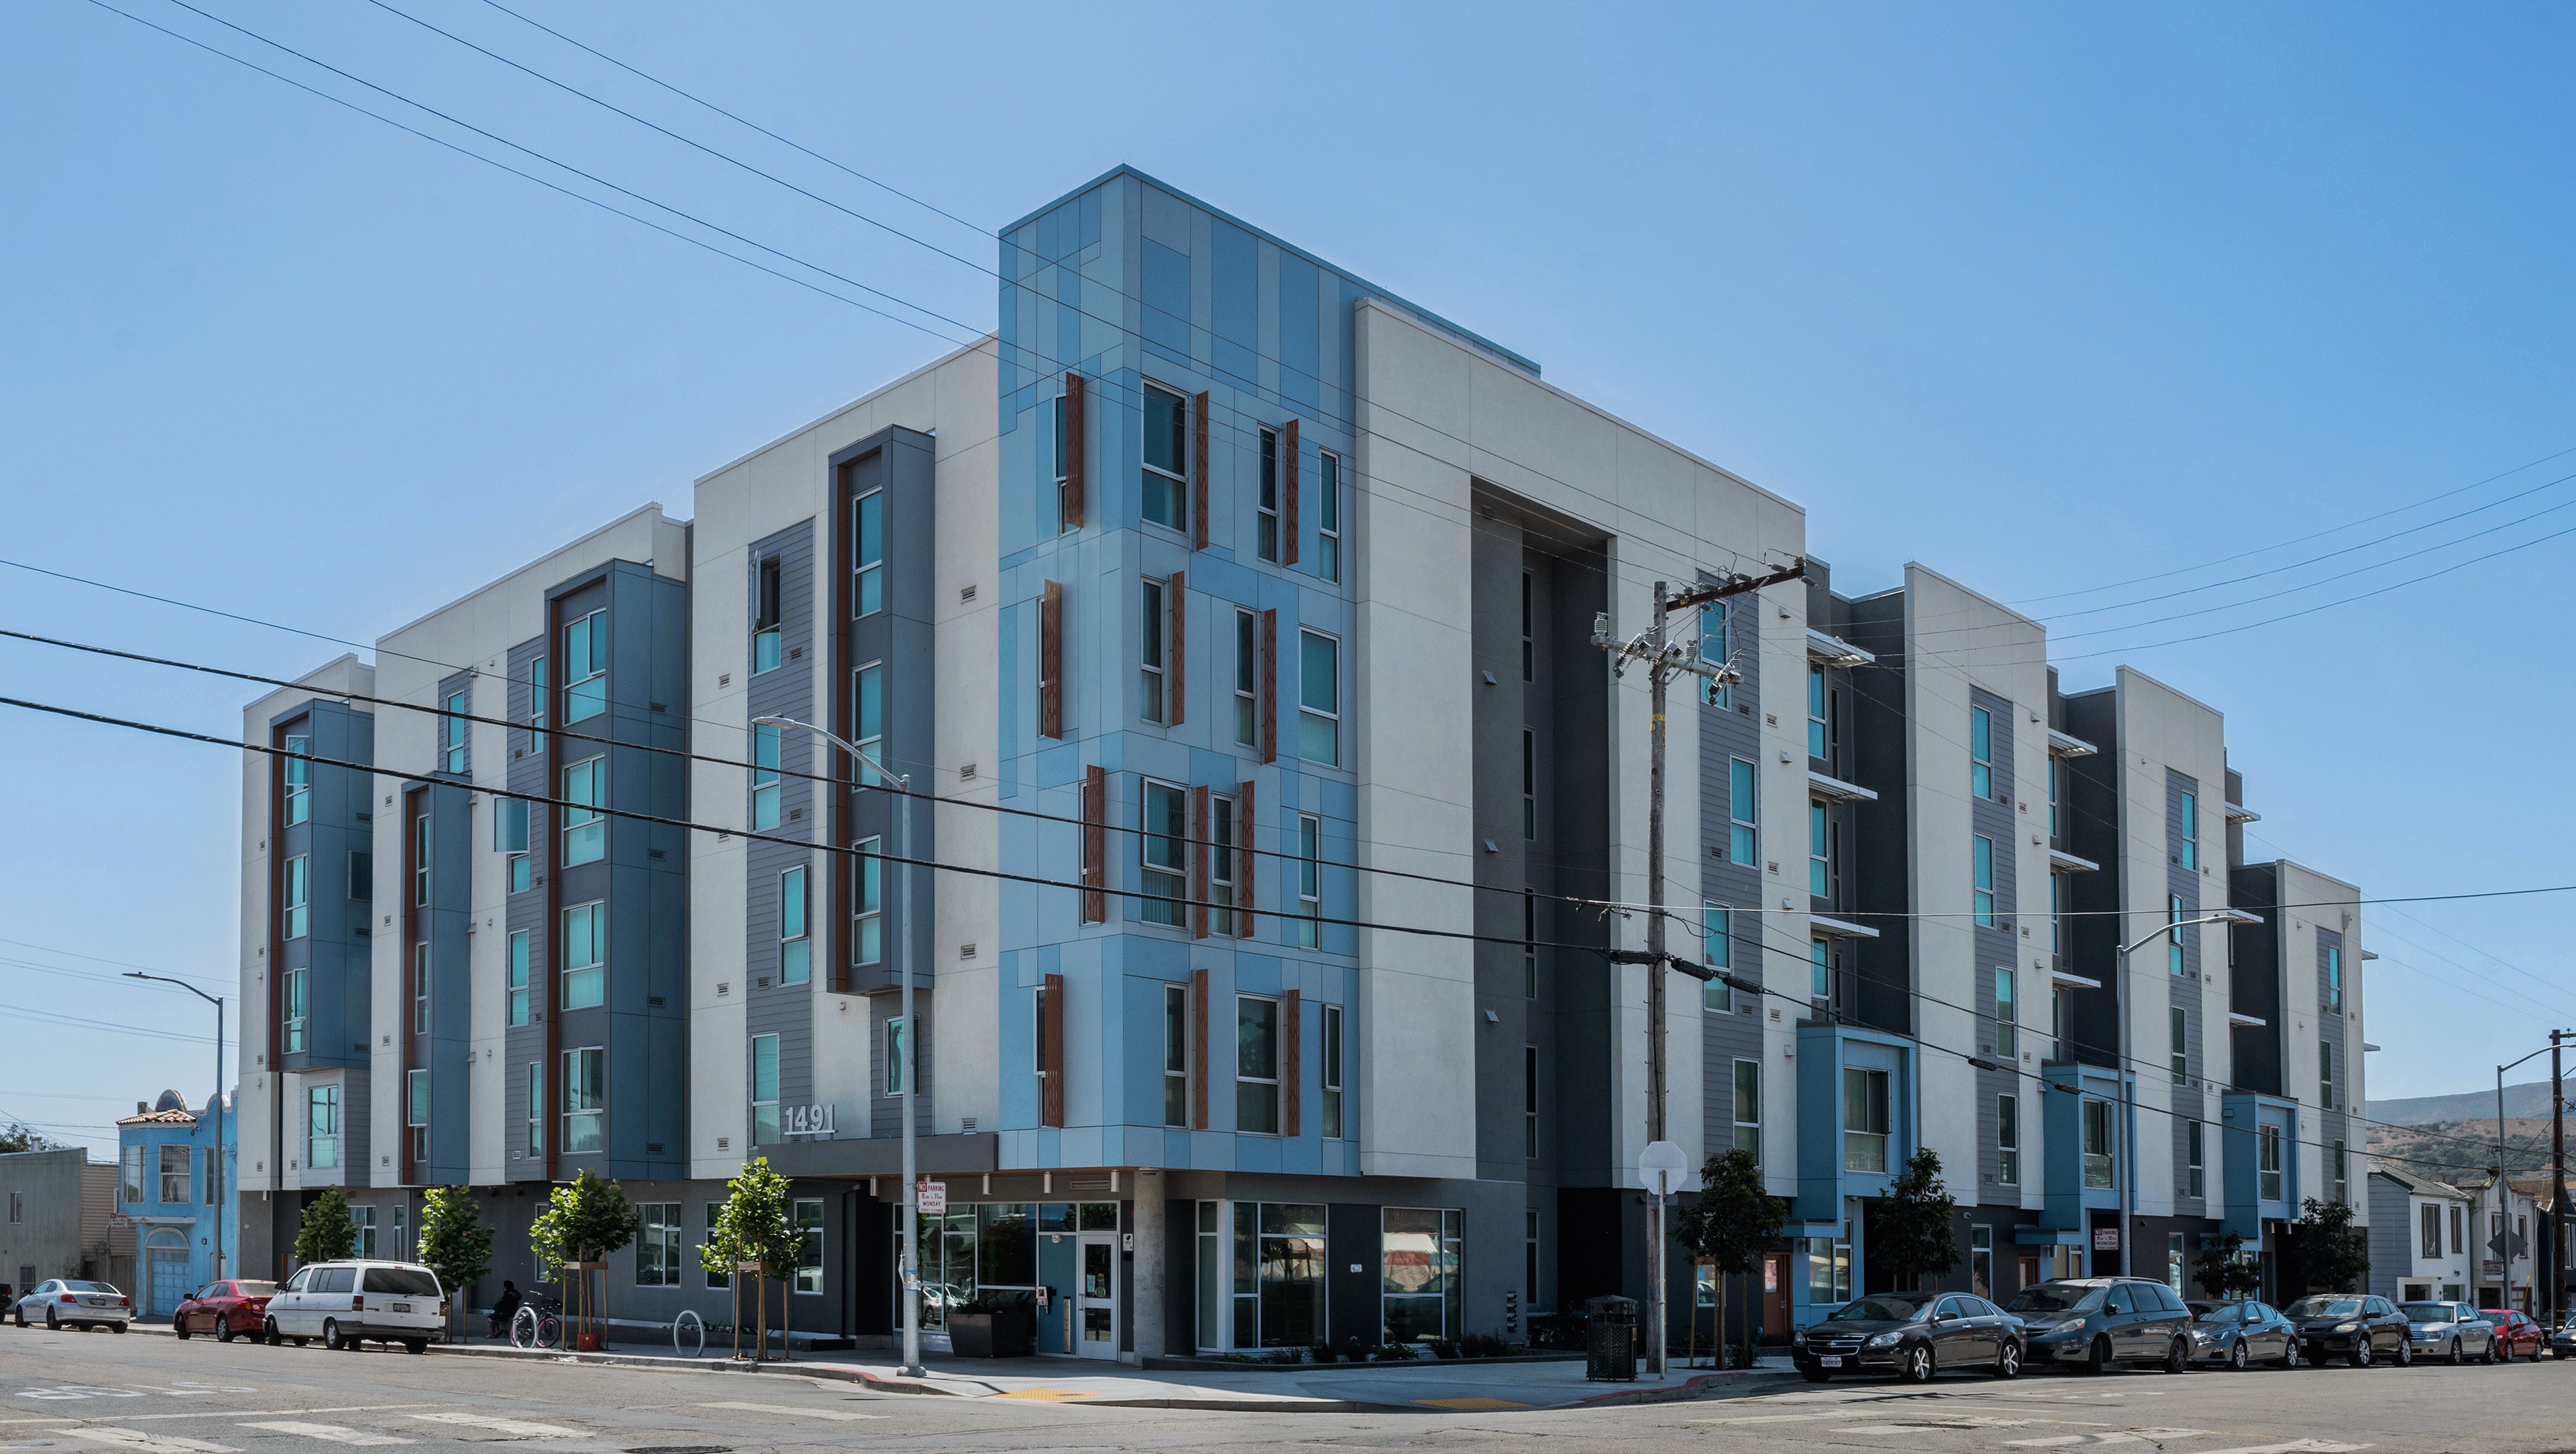
- Completed construction of two Navigation Centers: Lower Polk Transition Age Youth Navigation Center and the Bayview SAFE Navigation Center.
- Acquired 888 Post, the site of the Lower Polk Transition Age Youth Navigation Center using 2020 Health and Recovery G.O Bond proceeds.
- Completed rehabilitation work at the Hamilton Family Shelter at 260 Golden Gate.
- Began scoping rehabilitation work at two other City-owned emergency shelters to commence in summer 2023.
- Completed accessibility assessments of the three City-owned emergency shelters sites, funded in partnership with the Mayor’s Office of Disability.
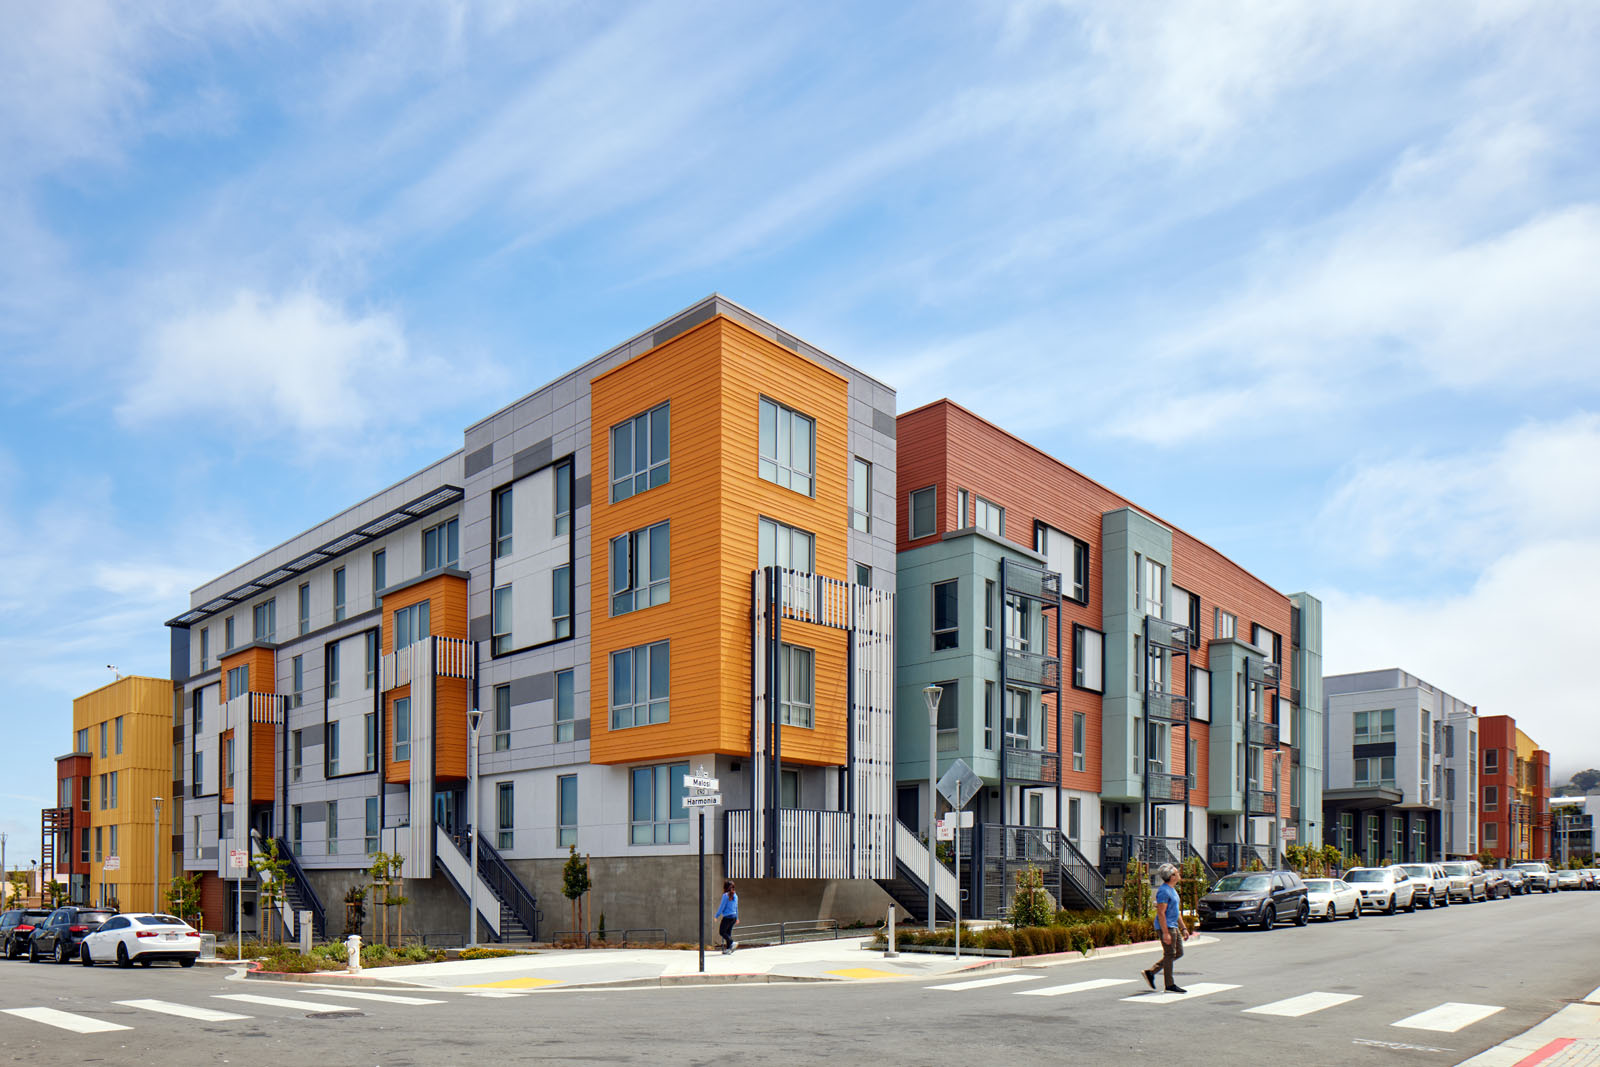
- Acquired six buildings with 625 units of permanent supportive housing for people experiencing homelessness.