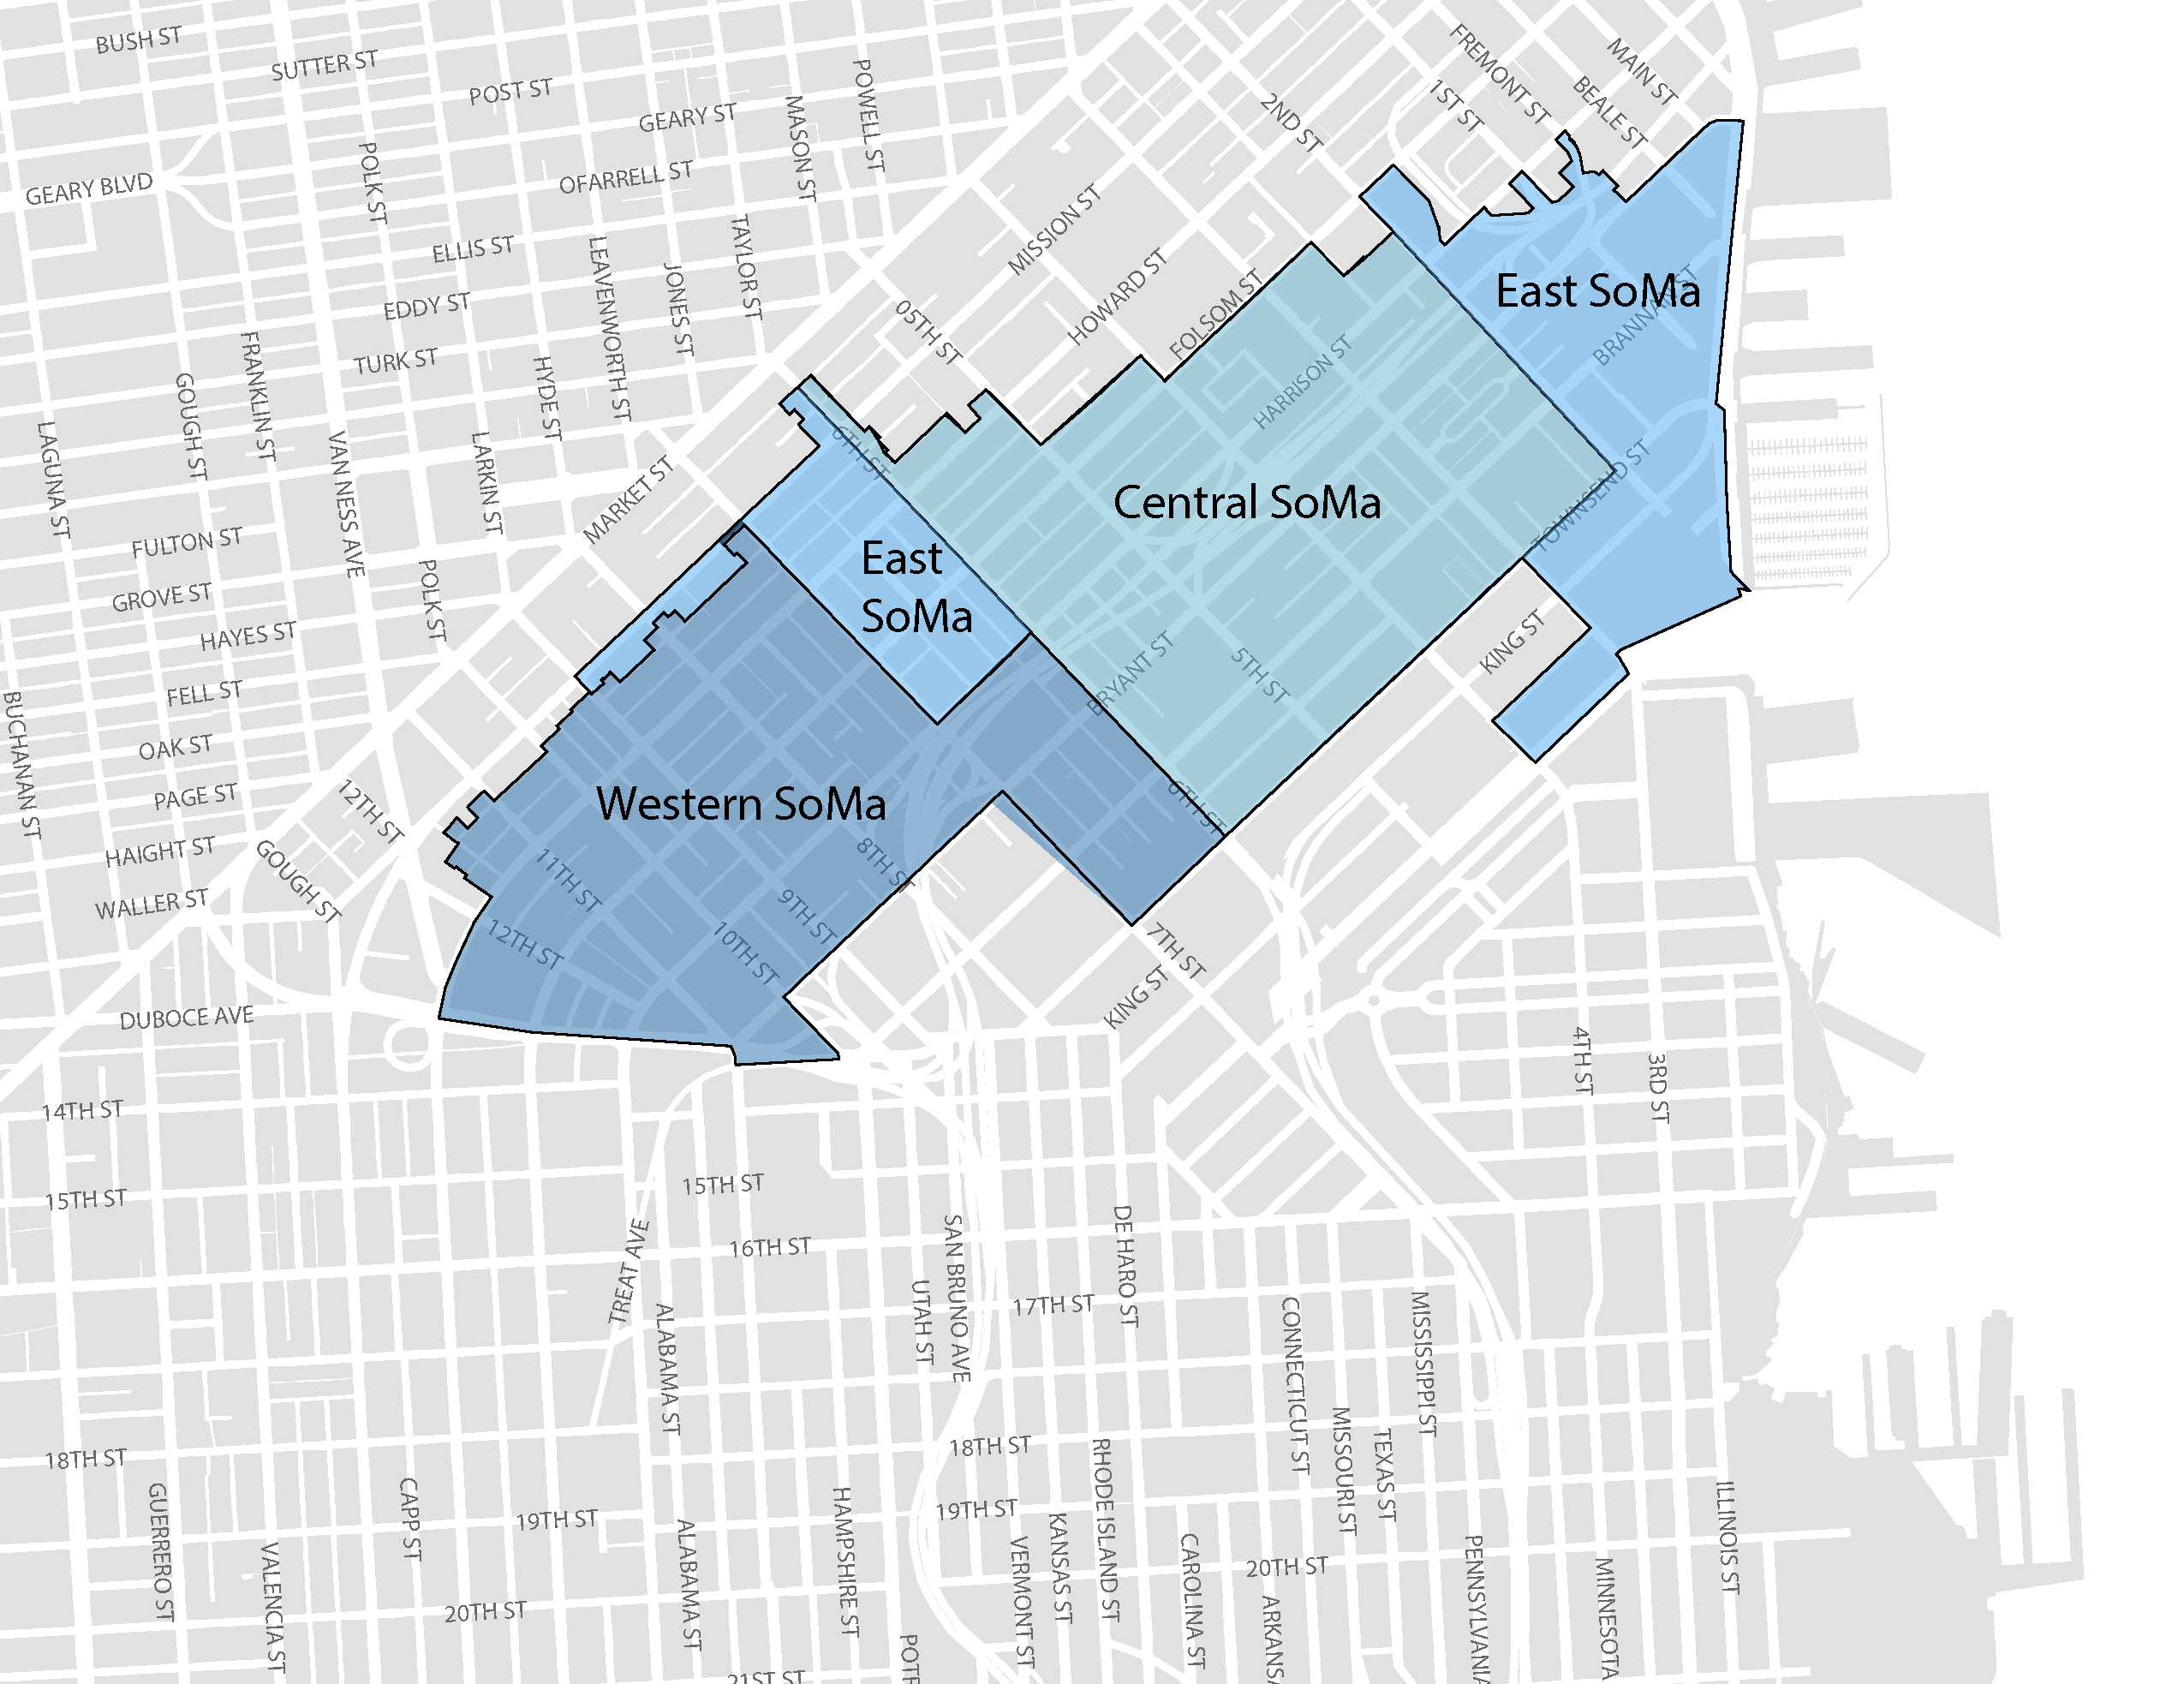
The Central SoMa Plan Area runs from 2nd Street to 6th Street, Market Street to Townsend Street, exclusive of those areas that are part of the Downtown Plan. It is an “Eastern Neighborhoods Plan” comprised entirely of areas formerly part of the East SoMa Plan Area and Western SoMa Plan Area. It is a neighborhood with an incredible history and a rich, ongoing, cultural heritage. As it grows and evolves over the next 25 years, Central SoMa has the opportunity to become a complete, sustainable, and vital neighborhood without losing what makes it special and unique today.
The vision of the Central SoMa Plan is to create a social, economic, and environmentally sustainable neighborhood by 2040, with space for approximately 32,000 new jobs and 8,600 new housing units. The Plan is expected to result in up to $2.2 billion in public benefits to serve critical needs of the neighborhood, including affordable housing, transportation, streets improvements, parks and recreation, schools, environmental sustainability, and community services. Funding for these projects will be derived from a combination of new and existing impact fees, Community Facilities District special tax revenues, direct provision by developers, and various other sources of funding. These funds will be received as development occurs in the Plan Area over the next 25 years.
The revenues estimated for projects in SoMa is approximately $261 million, including prior years. The tables on the following page show the SoMa spending plan, and sources of funds.
Return to Impact Fee Areas
| Key Proposed Central SOMA Projects through 2031 |
| Complete Streets |
| Folsom/Howard Streetscape |
| 2nd Street Improvements |
| 5th Street Bike Strategy |
| 6th Street Improvements |
| Transit |
| 27-Bryant Tenderloin Project |
| 14-Mission: Spear to 11th |
| Recreation and Open Space |
| Gene Friend Recreation Center Rebuild |
| New 11th & Natoma Park |
| Gene Friend Pool Annex / 88 Bluxome |
| Bluxome Street Linear Park |
| Under Freeway Parcel Open Space(s) |
| Spending Plan | Prior Years | FY 2022 | FY 2023 | FY 2024 | FY 2025 | FY 2026 | FY 2027 - 2031 | Plan Total | |
| (Dollars in Thousands) | |||||||||
| DEFERRED | |||||||||
| Complete Streets | 23,667 | 32,495 | 4,000 | 14,310 | 15,000 | 4,527 | 8,560 | 78,892 | |
| Open Space | 36,810 | 100 | 3,249 | 100 | 100 | 100 | 4,325 | 7,974 | |
| Transit | 35,858 | 6,278 | 18,057 | 17,946 | 4,816 | 12,070 | 59,167 | ||
| Childcare | 1,145 | 415 | 1,037 | 3,833 | 524 | 4,028 | 740 | 10,577 | |
| Program Administration | 3,695 | 500 | 500 | 300 | 400 | 500 | 810 | 3,010 | |
| TOTAL | 101,175 | 39,788 | 26,843 | 36,488 | 20,840 | 9,155 | 26,505 | 159,619 | |
| REVENUES | |||||||||
| External Grants | 6,000 | 6,716 | 4,000 | - | 1,769 | - | - | 12,485 | |
| General Fund - Other | - | - | 9,549 | 500 | 1,040 | - | - | 11,089 | |
| Impact Fees | 86,621 | 31,714 | 7,704 | 19,649 | 17,984 | 6,932 | 26,505 | 110,488 | |
| In-Kind | - | - | - | 12,000 | - | - | - | 12,000 | |
| Other Local | 8,554 | 1,358 | 5,590 | 4,339 | 47 | 2,223 | - | 13,557 | |
| TOTAL | 101,175 | 39,788 | 26,843 | 36,488 | 20,840 | 9,155 | 26,505 | 159,619 |
