2026 - Accomplishments: Health + Human Services Accomplishments

Health + Human Services

Department of Public Health

  • Fully funded the Treasure Island Residential Step-Down Facility with construction expected to begin in mid-2026.

  • Fully funded the Crisis Stabilization Unit at 822 Geary St with construction underway and final completion expected in early 2025.

  • Started renovation of 333 7th Street, which will add bed capacity to the behavioral health continuum of care.

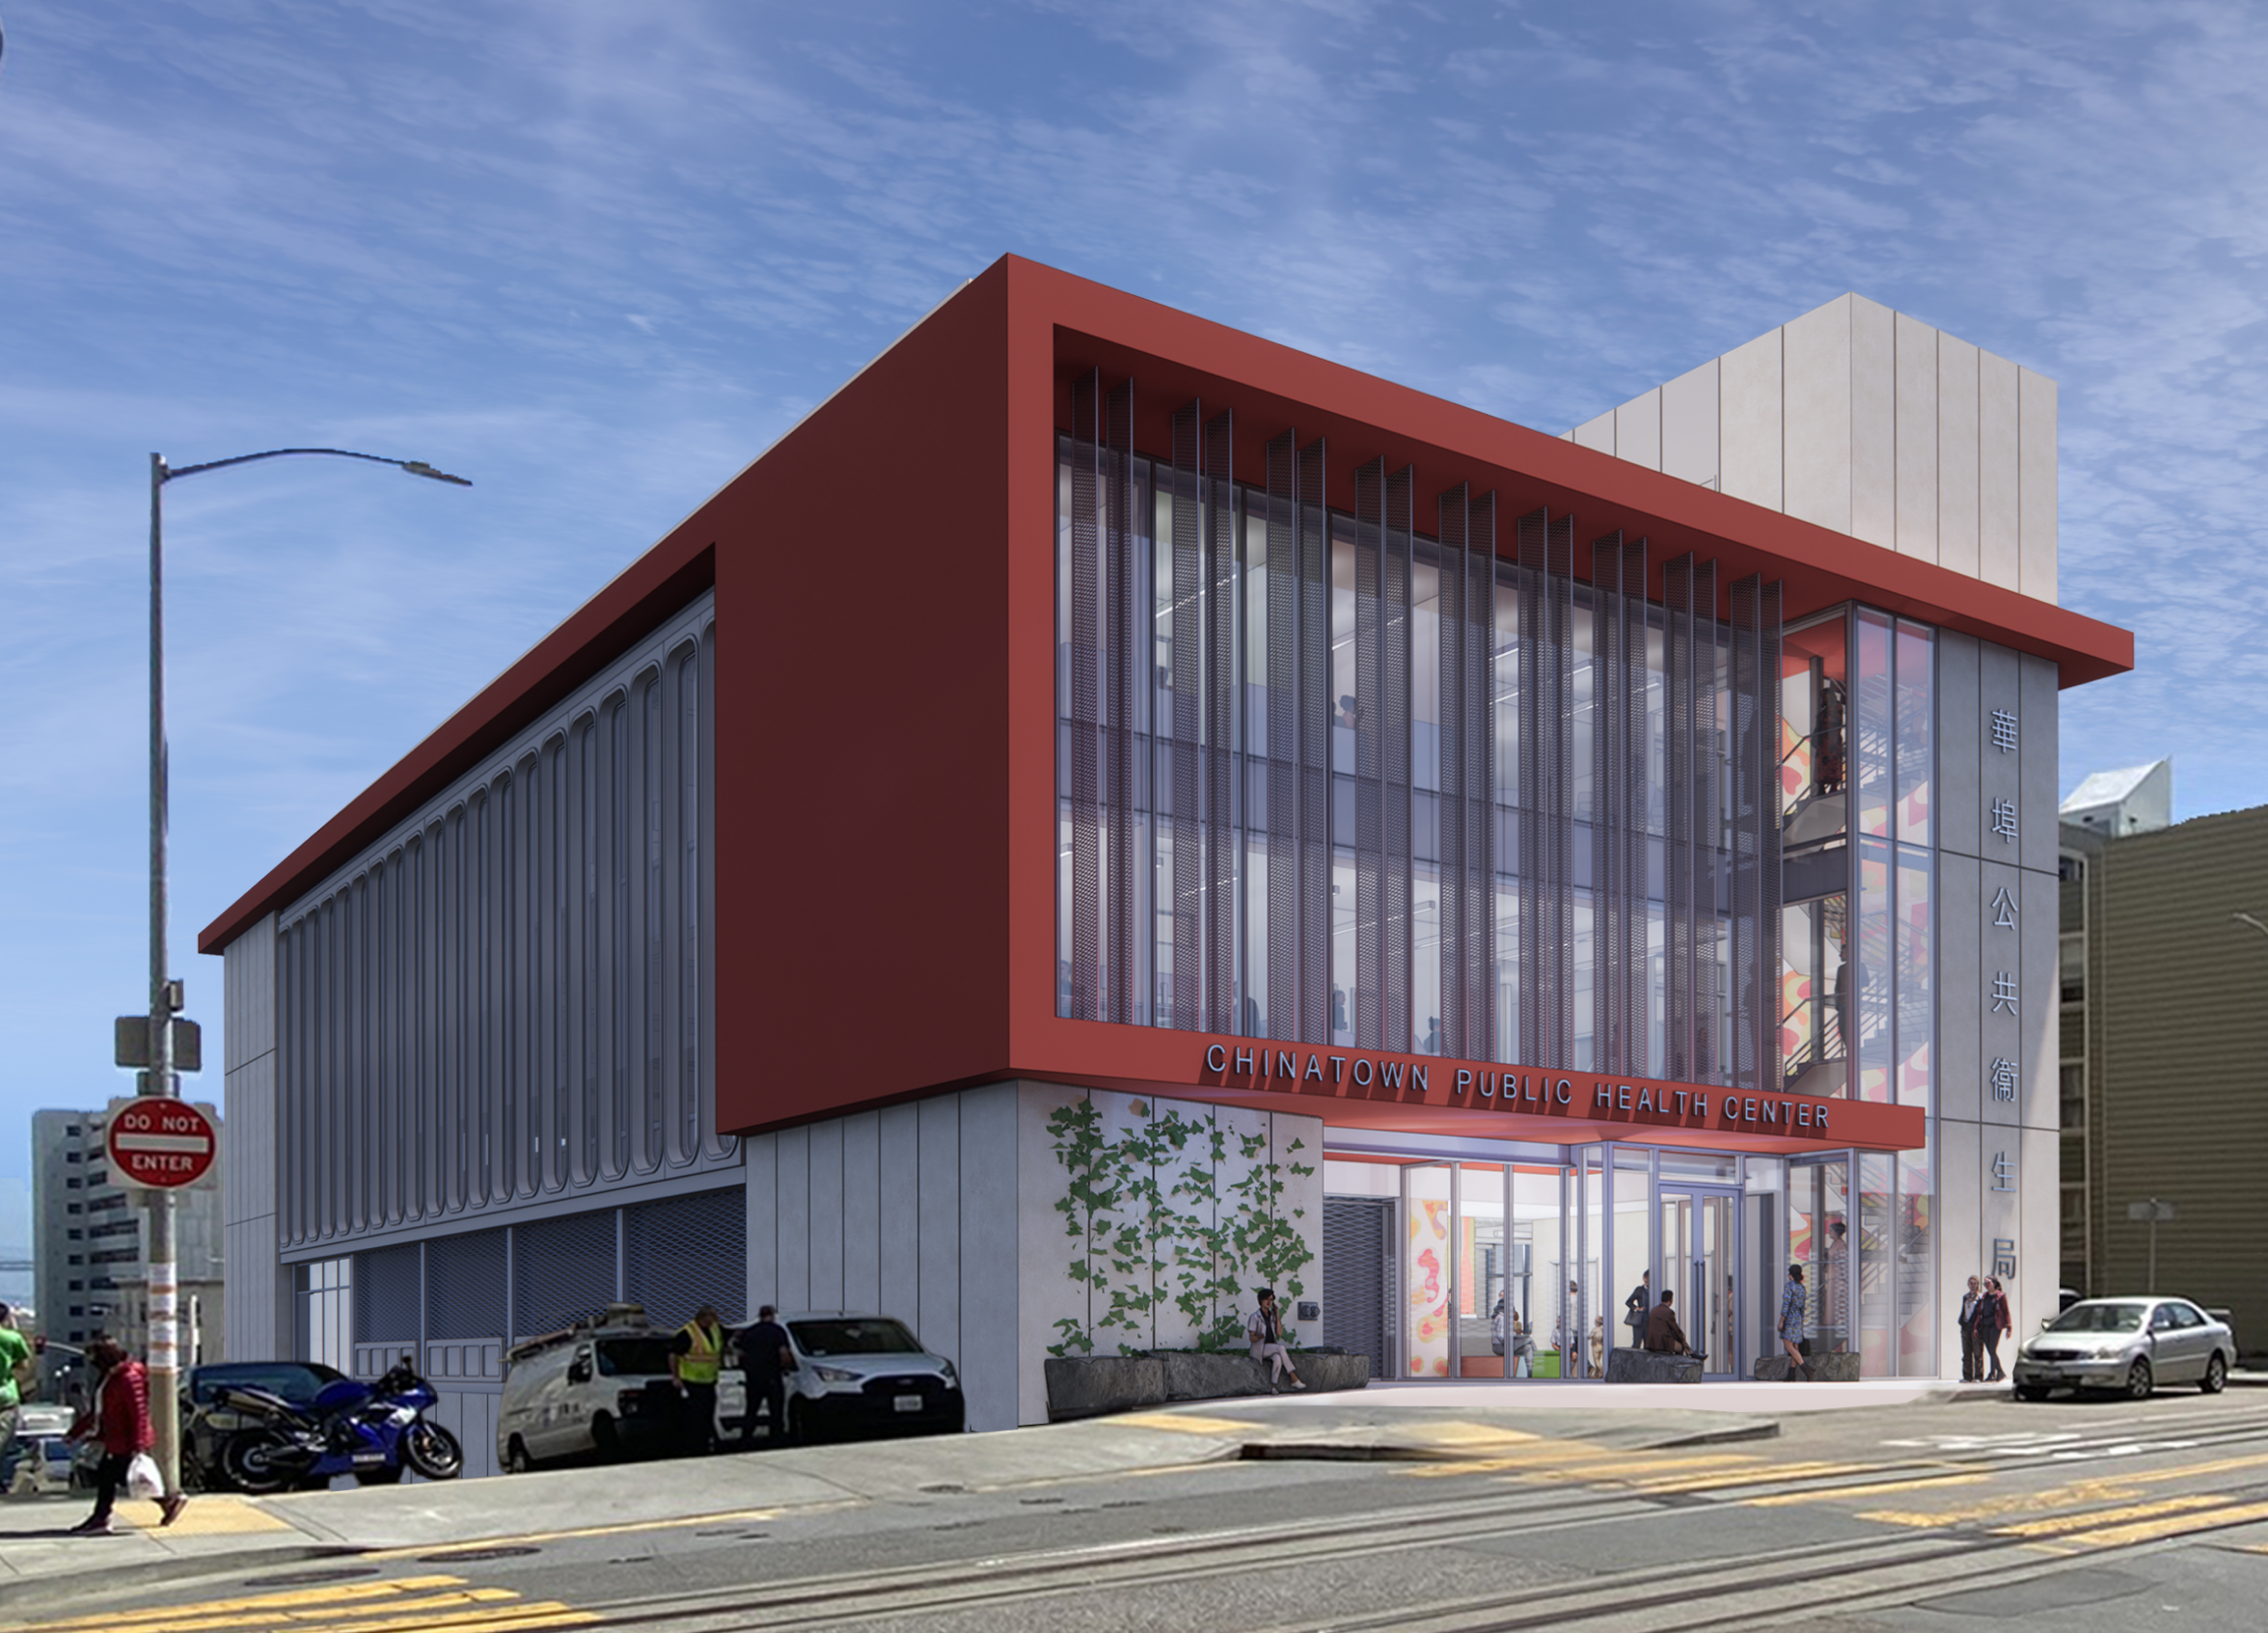
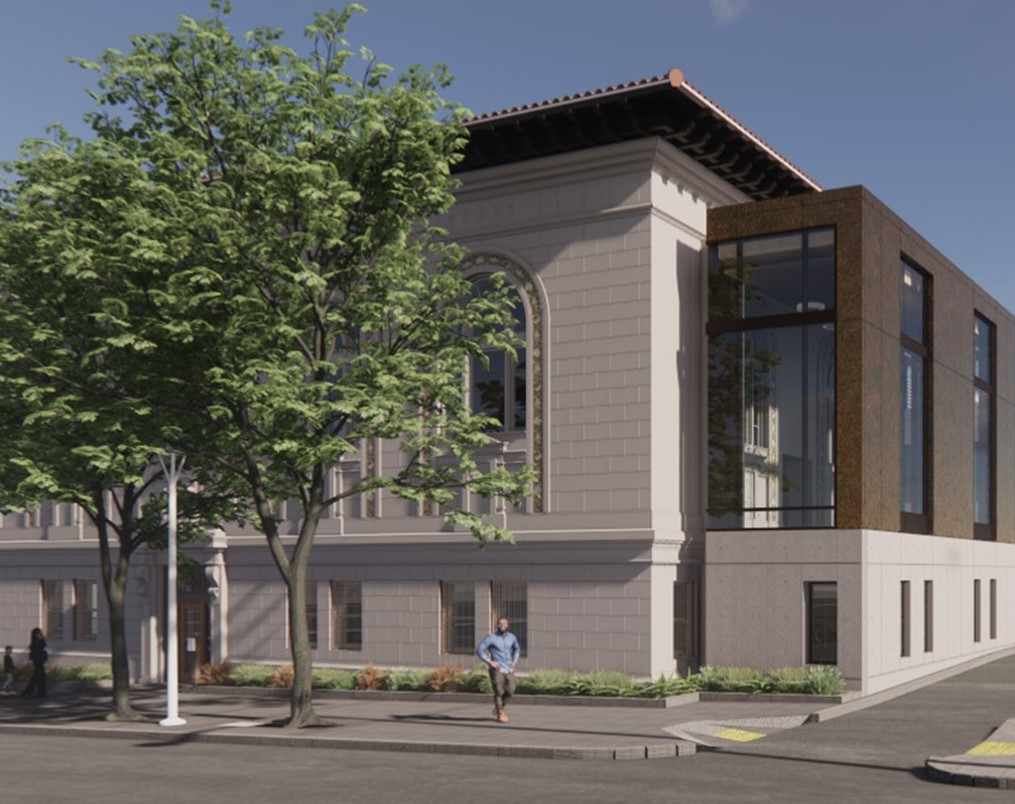
  • Completed construction documents and fully funded the seismic retrofit and renovation of the Chinatown Public Health Center

  • Started construction on the Adult Immunization Travel Clinic that is moving from 101 Grove to 27 Van Ness with completion expected in Spring 2025.

  • Initiated renovations to Buildings M & O at Laguna Honda Hospital (LHH) with substantial completion scheduled for Fall 2025. This relocates 400 employees to a seismically-safe building.

  • Continued critical renewal projects at LHH including fuel line and water tank replacements, and the addition of emergency power, fire alarms and fire suppression systems.

  • Construction progressed at new Public Health Lab at Zuckerberg San Francisco General (ZSFG) with completion targeted for Fall 2025.

  • Continued ZSFG Building 5 improvements including completion of a new Physical Therapy and Rehabilitation Clinic, Urgent Care Clinic, Poison Control Center, a clinical administration suite, accessible restroom upgrades, electrical infrastructure upgrades, and seismic improvements. Progress is underway on the new dialysis clinic, urology clinic, Public Health Lab, Clinical Lab and additional seismic upgrades. 

  • Construction underway for the ZSFG Psychiatric Emergency Services expansion and renovation

  • Completed and occupied the new UCSF Research Building at ZSFG funded by the university of California San Francsico. 

Human Services and Homelessness and Supportive Housing

  • Completed construction of the Mission Cabins Project at 1979 Mission Street to provide emergency nightly shelter to 68 adults.

  • Commenced construction of temporary shelter at Jerrold Commons at 2177 Jerrold Avenue in the Bayview neighborhood.

  • Commenced critical rehabilitation work at Next Door Adult Shelter at 1001 Polk Street and MSC South Adult Shelter at 525 5th Street.

  • Acquired eight buildings with 691 units, completed rehabilitation of 362 units, and commenced construction of 145 new units of permanent supportive housing.


Castro Mission Health Clinic

Maxine Hall Health Clinic


Chinatown Health Clinic Rendering

2026 - Accomplishments: General Government

General Government

Office of the City Administrator 

  • Completed several large renewal projects including heat pump replacements at City Hall and 555 7th St, elevators at City Hall, and restroom reconstruction and cooling tower replacement at 1 South Van Ness. 

  • Reconfigured the Hall of Justice waste collection system to enhance waste diversion and save cost.

Department of Technology

  • Connected over 17,097 units in 143 affordable housing sites with free broadband internet access over the last 6 years through the Fiber to Housing Project.

  • Installed over 23 miles of fiber backbone cable and preparing an additional 19 miles for installation before the end of FY 2026.


City Hall Elevator Modernization

50 Raymond Street Siding Repairs


Fiber Installation
Fiber Installation

2026 - Accomplishments: Economic + Neighborhood Development

Economic + Neighborhood Development

Mission Creek Park
Mission Creek Park

China Basin Park
China Basin Park

Office of Community Investment & Infrastructure 

  • Mission Bay: Constructed 19 open space parcels totaling over 29 acres, over 39,000 linear feet of streets and underground utilities, 4 storm water pump stations and one sanitary sewer pump station. 

  • Transbay: Completed the redesign and construction of 5 blocks of Folsom Street between Spear and Essex Streets totaling approximately 2,100 linear feet of improvements, as well as 16,550 square feet of sidewalk widening fronting 6 development blocks.    

  • Shipyard Candlestick: Constructed 14 open space parcels and approximately 9,000 linear feet of streets and underground utilities.

Port

  • Completed China Basin Park, a new five-acre bayfront park with a great lawn, dog zone, bay trail connection, and a shoreline sand area.

  • Completed improvements to Pier 9 Apron and Pier 29 Shed in record time in order to facilitate their use for the Asia-Pacific Economic Cooperation summit in the fall of 2023.

Planning Department

  • Approved the Stonestown Development Project in August 2024. The project will transform the surface parking adjacent to the Stonestown Galleria shopping mall into a master-planned, multi-phased, mixed-use community adding 3,491 housing units on the westside of San Francisco. 

  • Secured state funding for the Yosemite Slough Neighborhood Adaptation Plan to address disparities in sea level rise planning in Bayview Hunters Point. 

  • Adopted legislation in July 2023 to create the Commercial-to-Residential Adaptive Reuse Program which streamlines permitting for downtown conversion projects and allows for greater flexibility of uses to support new uses and to attract and retain a range of industries and employers downtown. 

Treasure Island Development Authority 

  • Completed all of the street improvements and public infrastructure planned on the first stage of development on Yerba Buena Island and Treasure Island. Including approximately $300 million in improvements for new utilities, parks, roadways, bicycle lanes, and a ferry facility. 


Transbay Zone 1
Transbay Zone 1

2026 - Accomplishments: Affordable Housing - Cloned

Affordable Housing

Star View Court
Star View Court

China Basin
China Basin

Mayor’s Office of Housing and Community Development 

  • Started construction on 1,042 units of affordable housing, with an investment of $378 million in local funds leveraging more than $700 million in other funds.

  • Closed $21.1 million in predevelopment loans for the production of 784 affordable units.

  • Provided $115 million in preservation loans, which will stabilize 227 households in their current homes.

  • Provided $31.2 million in gap funding for 636 units in troubled projects.

  • Invested $10.9 million in HOPE SF projects.

Office of Community Investment & Infrastructure

  • Began construction on 662 units of affordable housing, with 148 units of affordable for-sale housing completed in 2024.

  • Approved $324.4 million in predevelopment and construction loans toward the development of 1,058 affordable units in Mission Bay South, Transbay, and Hunters Point Shipyard Phase 1.

  • Began predevelopment on 396 affordable units in Mission Bay, including 233 units that will represent OCII’s first units funded under SB 593 Replacement Housing legislation.

Treasure Island Development Authority

  • Completed 105-unit Maceo May Apartment project in early 2023 and achieved full occupancy. Maceo May provides supportive housing for formerly homeless and low-income veterans. 

  • Constructed 138-unit Star View Court project for occupancy in May 2024, the second 100% affordable housing site on Treasure Island.

  • Received Vertical Development Approval for the DPH Behavioral Health Building, which includes a minimum of 240 residential step-down beds. 

  • Started predevelopment work and design for two new 100% affordable building projects including a 120-unit Senior Housing building and 150-units on parcel IC4.3. 


2550 Irving Site Construction


2026 - Introduction: Capital Outlook

Capital Outlook

The Plan recommends a level of funding of over $52 billion over 10 years. Despite this, the Plan defers nearly $7.5 billion in identified needs for General Fund departments, assuming recommended Pay-As-You-Go program funding levels as shown in Chart 2.1.

Years of historic underinvestment in the City’s capital program, exacerbated by recent economic difficulties, has resulted in a current facilities backlog of over $1 billion for General Fund facilities. The backlog is defined as the difference between the total current renewal need and the portion of this need that is funded in the first year of the Plan. The total current renewal need includes both items identified by departments as deferred maintenance, as well as first-year renewal needs. This backlog does not include buildings and sites for Recreation and Parks. While the Recreation and Parks department has identified a 10-year renewal need of $1.8 billion, funding towards those needs will come from the Recreation and Parks set-aside within the Pay-Go Program, as well as the planned 2030 Neighborhood Parks and Open Space G.O. Bond, pending voter approval.

If the City meets this Plan’s funding recommendations, the existing backlog is projected to start trending downward. As compared to the current level, the backlog is projected to decrease 65% to $351 million, as shown in Chart 2.2. To address the remaining gap, the City continues to investigate various approaches, including revising funding benchmarks, leveraging the value of City-owned assets for debt financing, preparing projects for voter consideration at the ballot, forming public-private partnerships, and exploring new revenue sources.

While the City has made significant progress in improving the quality of its streets in recent years, currently at a Pavement Condition Index (PCI) of 75, a backlog of $466 million remains if the City is to reach a PCI of 83, at which point the year-on-year cost of maintaining the streets declines significantly. The street resurfacing program will be supported by the General Fund to maintain a PCI of 75 over the 10-year period of this Plan, though the existing backlog is projected to increase to over $1 billion by FY2035, as shown in Chart 2.3.


Chart 2.1

Proposed funding level by expenditure type


Chart 2.2

Impact of facility renewal funding level on facilities backlog


Chart 2.3

Impact of streets funding level on streets backlog


Despite the challenges associated with the capital program, there is also reason to be optimistic. The total amount of capital investments exceeds $50 billion for the first time and is a marked improvement over the previous Capital Plan. Building on lessons learned during the pandemic, San Francisco is committed to building a stronger, more equitable, and resilient future. This includes commitments to increase housing, plans to address increasing hazards like heat, poor air quality, flooding, and sea level rise through planning documents like the Hazards and Climate Resilience Plan, the Climate Action Plan, and new General Plan Elements such as Safety and Resilience, Housing, Transportation, and Environmental Justice. While the investments needed are substantial, the commitment to an open and transparent capital planning process has proven that large challenges can be overcome by working together.

This Capital Plan puts forth a robust plan that balances maintaining current assets in a state of good repair with investments in major projects. Though there are risks associated with construction costs, a substantial capital backlog, and the scale of need, the City’s capital program is well positioned to respond and deliver a strong program of investment for San Francisco.


Mission Library Exterior Rendering

Golden Gate Park Golf Clubhouse


SOMArts Exterior ADA Barrier Removal and Retaining Wall

2026 - Introduction: Funding Principles

Funding Principles

The funding principles for the Capital Plan are used to make trade-offs between competing needs. They help San Francisco to keep our long-term perspective when it comes time to make choices about major projects and offer a consistent and logical framework for some of the City’s most difficult conversations.

San Francisco strives for racial and social equity across our programs and investments. For capital, this means allocating resources towards expanding equitable access to quality housing, open space, transportation, health, and other public services for Black, Brown, Indigenous, and people of color while improving outcomes for all groups experiencing marginalization, including based on gender, sexual orientation, ability, age, and more. The 10-Year Capital Plan strives to fund projects that address racial and social disparities and promote equity in the services delivered by the City’s facilities and infrastructure.


FUNDING PRINCIPLE 1: Addresses Legal or Regulatory Mandate

Improvement is necessary to comply with a federal, state, or local legal or regulatory mandate.

The City faces a wide range of directives and requirements for our facilities, some with significant consequences for failure to perform. Action in these cases is required by law, legal judgment, or court order, or it can proactively reduce the City’s exposure to legal liability. The legal, financial, operating, and accreditation consequences for failure to perform are all weighed when considering these types of projects.


FUNDING PRINCIPLE 2: Protects Life Safety and Enhances Resilience, Including Racial Equity 

Improvement provides for the imminent life, health, safety, and/or security of occupants and/or the public or prevents the loss of use of an asset.

Life safety projects minimize physical danger to those who use and work in City facilities, including protection during seismic events and from hazardous materials. Considerations for these projects include the seismic rating of a facility, the potential for increased resilience in the face of disaster, and the mitigation of material and environmental hazards for those who visit, use, and work in City facilities. Resilience includes eliminating racial and social disparities so that all San Franciscans may recover and thrive no matter the shocks and stresses they face.


FUNDING PRINCIPLE 3: Ensures Asset Preservation and Sustainability

Asset preservation projects ensure timely maintenance and renewal of existing infrastructure.

It is imperative to maintain the City’s infrastructure in a state of good repair so that the City’s operations are not compromised, and resources are not squandered by failing to care for what we own. It is also important to support projects that lessen the City’s impact on the environment. Some assets are more critical than others; for example, some facilities provide services that cannot be easily reproduced at another location or serve as emergency operations centers.

Considerations for these projects include the effect on the asset’s long-term life, importance for government operations, and environmental impact.


FUNDING PRINCIPLE 4: Serves Programmatic or Planned Needs

This set of projects supports formal programs or objectives of an adopted plan or action by the City’s elected officials.

Integrated with departmental and Citywide goals and objectives, this funding principle aims to align capital projects with operational priorities. Considerations for this type of project include confirmation that they will contribute to a formally adopted plan or action from the Board of Supervisors or the Mayor.


FUNDING PRINCIPLE 5: Promotes Economic Development

Economic development projects enhance the City’s economic vitality by stimulating the local economy, increasing revenue, improving government effectiveness, or reducing operating costs.

These projects may have a direct or indirect effect on the City’s revenues or may help to realize cost savings. Considerations for this type of project include the potential for savings, the level of revenue generation (either direct through leases, fees, service charges, or other sources; or indirect, such as increased tax base, business attraction or retention, etc.), and any improvements to government service delivery, such as faster response times, improved customer service, or increased departmental coordination.

2026 - Introduction: Policies, Principles, and Goals

Policies, Principles, and Goals

The FY2026-35 Capital Plan preserves San Francisco’s longstanding funding principles that prioritize how capital dollars are spent. The Plan also places constraints around the use of General Fund dollars, debt, and other revenue sources through clearly described and transparent policies that are adopted by the Capital Planning Committee. The policies govern the level and distribution of funds that feed into the Plan while the funding principles guide how the funds are prioritized.

Pay-Go Program Policies

The Capital Plan recommends a Pay-Go Program funding level based on the goal of restoring and eventually exceeding pre-pandemic levels of investment in capital. This Plan recommends a General Fund investment of $149 million in FY2026 growing by $30 million per year until FY2028, and $25 million per year thereafter. This program is the City’s primary source for basic public facilities and right-of-way repairs, an essential function of government that the City is required to deliver.

The Pay-Go Program policies recommended by the Plan are:

  • The General Fund funding level will be $149 million in FY2026 growing by $30 million per year until FY2028, and $25 million per year thereafter.

  • The Street Resurfacing Program will be funded at the level needed to achieve and maintain a “Good” Pavement Condition Index (PCI) score of 75.

  • ADA barrier access removal projects and the ongoing curb ramps right-of-way program will continue to be a program priority.

  • Funding for critical enhancements will be restored by setting aside $10 million per year.

Several voter-determined outcomes have affected the Pay-Go Program. Approved set-asides for the Recreation and Parks Department and street tree maintenance without associated revenue sources have resulted in restrictions on General Fund spending. Voters also renewed the Library’s set-aside in 2022. These measures limit the flexibility of the Pay-Go Program.

For more information on the Pay-Go Program, please see the Capital Sources Chapter.


Table 2.2

Pay-Go Program Funding
(Dollars in Millions)

FY26-30

FY31-35

Plan Total

Routine Maintenance

109

140

249

ADA: Facilities

9

9

18

ADA: Public Right-of-Way

55

71

125

Street Resurfacing

207

290

497

Enhancements

50

50

100

Recreation and Parks Base Commitment

71

71

142

Capital Contribution to Street Tree Set-aside

37

48

85

ROW Infrastructure Renewal

52 

107

158

Facility Renewal

439

885

1,325

Total Projected Funding

1,030 

1,670 

2,700


Debt Program Policies

The policy constraint for the General Obligation (G.O.) Bond Program is:

G.O. bonds under the control of the City will not increase long-term property tax rates above FY2006 levels. In other words, G.O. bonds under control of the City and County of San Francisco will only be used as existing bonds are retired and/or the city's assessed value grows.

Consistent with the 2026 update of the Five-Year Financial Plan, the G.O. Bond Program assumes growth in Net Assessed Value of 0.52% in FY2027, 2.63% in FY2028, 3.28% in FY30, and 3% annually thereafter.

The policy constraint for the Certificates of Participation (General Fund Debt) Program is:

  • The amount spent on debt service in the General Fund Debt Program will not exceed 3.25% of General Fund discretionary revenues.

Consistent with the Five-Year Financial Plan, the Plan assumes that General Fund discretionary revenues grow 1.84% in FY2026, 5.65% in FY2027, 1.03% in FY2028, 3.91% in FY2029, 2.54% in FY30, and 2.70% annually thereafter.

For more information on City’s Debt Programs, please see the Capital Sources Chapter.

Special Financing District Policies

Following the Capital Planning Committee’s recommendations, the Board of Supervisors first adopted guidelines for the establishment and use of Infrastructure Financing Districts (IFDs) in San Francisco in 2011. As the types of IFDs expanded over the past several years to include infrastructure revitalization and financing districts (IRFDs) and enhanced infrastructure financing districts (EIFDs), the Capital Planning Committee and Board of Supervisors approved updated guidelines that were consistent with the FY2024-33 Capital Plan. These guidelines apply to any IFDs established by the former Redevelopment Agency. The policies regarding the 50/50 share and the 5% General Fund cap do not apply to IFDs at the Port. A copy of the guidelines can be found in Appendix D. The uses of IFDs are also discussed in the Capital Sources Chapter.

General Policies

The Capital Plan uses the Annual Infrastructure Construction Cost Inflation Estimate (AICCIE) developed by the Office of Resilience and Capital Planning and approved by the Capital Planning Committee for the first year of the Capital Plan. For this Plan, that figure is 3.5%. Thereafter, the Plan assumes an annual escalation rate of 5.0% unless otherwise noted.

The City uses a revolving Capital Planning Fund primarily to support pre-development of projects for inclusion in bonds with the expectation that these funds will be reimbursed at bond issuance.

Departments with major building projects within the Plan's time horizon are expected to develop estimates for the impact on the City’s operating budget as part of project development. Those impacts appear in the Plan to the extent they are known at publication and are further discussed as a standard component of requests made to the Capital Planning Committee. Operating impacts are also considered during the City’s annual budget development process. The financial impact of operations is not recorded in the Plan but is addressed for major projects in the City’s Five-Year Financial Plan.


2026 - Introduction: Overview

Capital Planning in San Francisco
Street Tree Nursery
Street Tree Nursery


The Fiscal Year (FY) 2026-35 City and County of San Francisco Capital Plan (the Plan) is a commitment to building a more resilient, equitable, and vibrant future for the residents, workers, and visitors of San Francisco. Updated every odd-numbered year, the Plan is a fiscally constrained expenditure plan that lays out anticipated infrastructure investments over the next decade. This document is the product of input from Citywide stakeholders, who have put forth their best ideas and most realistic estimates of San Francisco’s future capital needs.

Through the application of consistent funding principles and fiscal policies, the Plan prioritizes departmental capital needs within defined fiscal constraints. The result is a road map for investments in San Francisco’s streets, facilities, utilities, parks, waterfront, transportation network, and affordable housing.


San Francisco voters have approved $6.3 billion in G.O. bonds since 2008, more than the previous 50 years of G.O. bonds combined.

The FY2026-35 Capital Plan comes amid ongoing challenges and new opportunities. Increased labor costs, vacant office space and lower property values downtown, and the slow return of public transit ridership and tourism are contributing to an anticipated $800 million budget deficit over the next two years. At the same time, interest rates and inflation appear to be headed downward and the San Francisco voters recently passed two large general obligation (G.O.) bonds and revised the tax code to better support medium-sized businesses. The State of California also passed two significant bonds to address infrastructure needs related to climate change and school facilities. As discussed in the Capital Sources Chapter, San Francsico is deploying considerable amount of new tax increment financing through Enhanced Infrastructure Financing Districts that support multifamily housing along the waterfront, at Treasure Island, and on the west side of the city. 

San Francisco is continuing to move toward a more resilient future. The Building Our Future Chapter has been updated with more details on the various policies, programs, and efforts that span beyond the 10-year time horizon of this Plan. It includes objectives contained in the Climate Action Plan, Hazards and Resilience Plan, ClimateSF Program, and the Earthquake Safety Implementation Program, including seismic hazard ratings of the most vulnerable city-owned buildings.      

The current Plan recommends over $52 billion in critical infrastructure improvements over the next 10 years.

The $52 billion total level of investment recommended here is 27% higher than the previous Capital Plan, which was highly impacted by shortfalls caused by the COVID-19 pandemic, forcing reductions in the General Fund Pay-As-You-Go Program, as well as Enterprise department budgets. This increase represents an effort to restore pre-pandemic levels of capital investment in San Francisco. The recommendations in this Capital Plan reflect confidence in the City’s capacity to navigate near-term budget constraints and administer capital projects and programs in a responsible manner. San Francisco understands that ongoing investment in public assets is an essential function of government and will continue to act as a good steward of the City’s public spaces, facilities, and infrastructure.

This Plan begins to restore the severe COVID-19 induced funding reductions to previous levels by starting at a higher baseline and making large annual increases so that backlogs begin to decline.


In 2024, San Francisco passed a $300 million Affordable Housing G.O. Bond to acquire, build,and rehabilitate affordable housing; as well as a $390 million Healthy, Safe and Vibrant San Francisco G.O. Bond to improve medical, mental health, and shelter services to San Franciscans, deliver street safety and resurfacing projects, and revitalize public spaces.

Table 2.1: G.O. Bonds Passed Since 2008

Year G.O. Bond Program

Amount
(Dollars in Millions)

2008

Neighborhood Parks and Open Space

180

2008

Public Health Seismic Facilities (SFGH rebuild)

887

2010

Earthquake Safety & Emergency Response

412

2011

Road Resurfacing and Street Safety

248

2012

Neighborhood Parks and Open Space

195

2014

Earthquake Safety & Emergency Response

400

2014

Transportation

500

2015

Affordable Housing

310

2016

Public Health and Safety

350

2018

Seawall Resilience

425

2019

Affordable Housing

600

2020

Earthquake Safety & Emergency Response

629

2020

Health and Recovery

488

2024

Affordable Housing

300

2024

Healthy, Safe and Vibrant SF

390

Total


6,313


2026 - Executive Summary: Towards Resilience

Towards Resilience

This Capital Plan identifies planned funding of $52.1 billion over 10 years. Despite this funding, the Plan defers over $7.5 billion in identified needs for General Fund departments.

San Francisco’s Capital Plan reflects confidence in the City’s capacity to administer our capital program in a responsible and transparent manner that employs best practices in financial management. This includes establishing financial constraints around each funding program to promote its long-term viability, listing unfunded and deferred projects, and establishing funding principles.

Taking care of our capital infrastructure is an important part of building a resilient city. Resilience includes eliminating racial and social disparities so that all San Franciscans may recover and thrive no matter the shocks and stresses they face. The Capital Plan strives to fund projects and programs that address racial and social disparities and promote equity in the services delivered by the City’s facilities and infrastructure. Most of the long-term resilience projects come from citywide planning and coordination efforts and include climate and seismic safety.


Glen Park Greenway Planting

2026 - Executive Summary: Certificates of Participation

Certificates of Participation

The Plan anticipates $487 million in Certificates of Participation (COPs), also known as General Fund debt, over the next 10 years. COPs are backed by a physical asset in the City’s capital portfolio, and repayments are appropriated each year out of the General Fund.

Table 1.6 shows the Capital Plan’s COP Program for the next 10 years.

Chart 1.2 illustrates the COP program against the City’s policy constraint for General Fund debt not to exceed 3.25% of General Fund Discretionary Revenue.

All amounts attributed to future debt programs are estimates and may need to be adjusted.


Table 1.6

COP Program
(Dollars in Millions)

Fiscal Year of Issuance

Project

Amount

FY2026

Relocation of HSA Headquarters

55

FY2026

Treasure Island Infrastructure

50

FY2027

Treasure Island Infrastructure

15

FY2027

HOJ Replacement

157

FY2030

HOJ Replacement

180

FY2032

HOJ Replacement

30

Total


487


Chart 1.2 - Capital Plan General Fund Debt Program FY2026-35

GO Bond Bar Chart 1.2


Subscribe to

back to top