2026 - Executive Summary: General Obligation Bonds

General Obligation Bonds

The Plan anticipates $1.8 billion in general obligation (G.O.) bonds over the next 10 years. G.O. bonds are backed by the City’s property tax revenue and are repaid directly out of property taxes through a fund held by the Treasurer’s Office. As a result of the successful passage of several large bonds in the past few years, the capacity of the G.O. Bond Program is limited in the near term.

Table 1.5 shows the Capital Plan’s G.O. Bond Program for the next 10 years.

Chart 1.1 illustrates the relationship between the G.O. Bond Program and the local property tax rate, including existing and outstanding issuance and voter-approved bonds. This view shows the City’s policy constraint that G.O. bonds will not increase the property tax rate above 2006 levels.

All amounts attributed to future debt programs are estimates and may need to be adjusted.


Table 1.5

G.O. Bond Debt Program  
(Dollars in Millions)

Election Date

Bond Program

Amount

Nov 2026

Transportation

235

Mar 2028

Waterfront Safety & Climate

350

Nov 2028

Earthquake Safety & Emergency Response 

350

June 2030

Parks & Open Space

200

Nov 2030

Public Health

250

Nov 2032

Transportation

200

Nov 2034

Affordable Housing

200

Total


1,785


Chart 1.1 - Capital Plan G.O. Debt Program FY2026-35
GO Bond Bar Chart 1.1


Margaret Hayward Playground


2026 - Executive Summary: Enterprise and External Agencies

Enterprise and External Agencies

This Plan compiles information provided by the City’s Enterprise departments—the Port of San Francisco, the San Francisco Metropolitan Transportation Agency, San Francisco International Airport, and the San Francisco Public Utilities Commission. Those departments have their own timelines and commissions that govern their capital processes. The information in this Plan represents the best available at the time of publication.

The Plan captures nearly $27 billion in Enterprise department capital investments during the next 10 years.

Enterprise departments appear in the Plan’s General Obligation (G.O.) Bond Program. The SFMTA passed a $500 million Transportation G.O. Bond in 2014, and the Port won approval for a $425 million Seawall Safety G.O. Bond in 2018. The next Transportation G.O. Bond is planned for 2026 and a Waterfront Safety & Climate G.O. Bond planned for 2028.


Table 1.4

Planned Revenue Bond Issuances FY2026-35
(Dollars in Millions)

Agency

FY26-30

FY31-35

Total

SFPUC

4,973 

3,376

8,350

Airport

4,549

648

5,197

Total

9,522

4,025

13,547


The Enterprise departments also issue revenue bonds against the revenues generated from user fees, taxes, and surcharges. Table 1.4 shows the current amount of revenue bonds to be issued for each department over the 10-year term of this Plan. As with the G.O. Bond and COP Programs, all revenue bond issuances are subject to change based on market conditions and cash flow needs of the associated projects.

For external agencies—City College of San Francisco, San Francisco Unified School District, the San Francisco Housing Authority, Treasure Island Development Agency, and the Office of Community Investment & Infrastructure (the successor agency to the Redevelopment Authority)—the Plan shows nearly $19 billion in capital investments over the next 10 years. As affordable housing funding supports the development of units that will ultimately be held and managed by third parties, planned investments in that area are represented as external, including those funds administered by the Mayor’s Office of Housing and Community Development.


SFO International Terminal


2026 - Capital Sources: Pay-As-You-Go Program

Pay-As-You-Go Program

The Plan proposes funding the majority of the City’s ongoing annual needs with General Fund dollars through the Pay-As-You-Go (Pay-Go) Program. These are typically smaller investments to maintain facilities and infrastructure in a state of good repair or fund critical infrastructure needs. Within the Pay-Go Program, projects are categorized as Routine Maintenance, ADA Facilities, ADA Public Right-of-Way, Street Resurfacing, Critical Enhancements, Facility Renewal, and Right-of-Way Infrastructure Renewal.

Table 1.3 provides a summary of the Plan’s planned funding for the Pay-Go Program by expenditure category. The planned investment over 10 years is $2.7 billion. 


Table 1.3

Pay-Go Program Funding
(Dollars in Millions)

FY26-30

FY31-35

Plan Total

Routine Maintenance

109

140

249

ADA: Facilities

18 

ADA: Public Right-of-Way

55 

71

125

Street Resurfacing

207

290 

497

Enhancements

50 

50

100 

Recreation and Parks Base Commitment

71 

71 

142 

Capital Contribution to Street Tree Set-Aside

37 

48

85

ROW Infrastructure Renewal

52

107

158 

Facility Renewal

439

885

1,325

Total Projected Funding

1,030

1,670 

2,700


Bayfront Park
Bayfront Park


2026 - Executive Summary: General Fund Departments - Cloned

General Fund Departments

General Fund departments primarily rely on the General Fund to support their infrastructure needs. Table 1.2 outlines a program summary of planned General Fund department investments, as well as projects deferred from the Plan due to funding limitations. These projects and more are discussed in the Plan's Service Area chapters.


Table 1.2

General Fund Department Program Summary
(Dollars in Millions)

Renewal Investments

FUNDED

DEFERRED

Projected for Next Ten Years

Facilities

1,546

1,233

Streets

1,109

1,020

Other Right-of-Way Assets

198

106

Subtotal, Renewals

2,853

2,359

Capital Enhancement Investments

FUNDED

DEFERRED

Earthquake and Safety Improvements

HOJ Consolidation Project

367


New Fire Division of Training Facility

196


Emergency Firefighting Water System

121


District Police Stations and Facilities

98


Chinatown Public Health Center Seismic Retrofit

76


Kezar Pavillion Seismic Upgrade

70

114

Relocation of HSA Headquarters

55


ZSFG - Bldg 3 Retrofit and Renovation

40


1001 Polk Replacement Shelter Project


 187

Taraval Station Structural Improvements / Replacement


168

New Police Shooting Range - Lake Merced


92 

Fire Station 7 Replacement


65

Other Earthquake & Safety Improvements

650

711

Subtotal

1,673

1,337

Disability Access Improvements

Facilities

18


Sidewalk Improvements and Repair Program

70


Curb Ramp Program

106

226

Subtotal

193 

226

Parks, Open Space & Greening Improvements

Neighborhood Park Projects & Open Space Improvements

250


Street Tree Planting and Establishment

30

217

Street Tree Maintenance and Sidewalk Repair

259

82

Other Parks, Open Space & Greening Improvements

762

107

Subtotal

1,301

406

Street Infrastructure Improvements

The New Harvey Milk Plaza

25

21

Other Street Infrastructure Improvements

466

1,574

Subtotal

491

1,595

Other Improvements

Utility Undergrounding


1,630

Other Projects

158


Subtotal

158 

1,630

Subtotal, Enhancements

3,816

5,195

PLAN TOTAL

6,668

7,554

2026 - Executive Summary: Plan By the Numbers

Plan By the Numbers 

Policies governing the Plan are discussed in the Introduction as well as the Capital Sources Chapter. The Plan also continues key objectives from previous years, including robust funding for asset preservation, relocation of critical City services to seismically sound facilities, and construction of several public infrastructure projects to improve services and quality of life.

As shown in Table 1.1, this Plan captures $33.5 billion in recommended direct City investments and $18.6 billion in External Agency investment, which total $52.1 billion in capital improvements citywide. This work is estimated to create over 210,000 local jobs over the next decade.


Table 1.1

Capital Plan Summary in Five-Year Intervals
(Dollars in Millions)

FY26-30

FY31-35

Plan Total

By Service Area

Affordable Housing

1,937

815

2,753

Public Safety

1,253

234

1,486

Health and Human Services

407

435

841

Infrastructure & Streets

7,549

5,777

13,326

Recreation, Culture, and Education

2,461

1,627

4,088

Economic & Neighborhood Development

3,689

3,508

7,197

Transportation

13,669

8,368

22,038

General Government

140

263

403

Total

31,104

21,028

52,132


By Department Type

General Fund Departments

4,186

2,482

6,668

Enterprise Departments

16,421

10,415

26,836

City & County Subtotal

20,608

12,897

33,505

External Agencies

10,496

8,131

18,627

Total

31,104

21,028

52,132


India Basin
India Basin


2026 - Executive Summary: Overview

01. Executive Summary
Mission Branch Library


The Fiscal Year (FY) 2026-35 City and County of San Francisco Capital Plan (the Plan) is the City’s commitment to building a more resilient, equitable, and vibrant future for the residents, workers, and visitors of San Francisco. Updated every odd-numbered year, the Plan is a fiscally constrained expenditure plan that lays out anticipated infrastructure investments over the next decade. This document is the product of input from Citywide stakeholders, who have put forth their best ideas and most realistic estimates of San Francisco’s future needs.

Projects in the Plan are divided into eight Service Areas: Affordable Housing; Economic and Neighborhood Development; General Government; Health and Human Services; Infrastructure and Streets; Public Safety; Recreation, Culture, and Education; and Transportation. Each Service Area chapter describes the associated Renewal Program, Enhancement Projects, Deferred Projects, and Emerging Needs. General Fund, Enterprise, and External Agencies are all represented to give as full a picture of San Francisco’s capital needs as possible.


Planned Project Highlights 

San Francisco has many competing needs, and the capital program is no exception. Major projects with funding identified in this Plan include: 

General Fund Departments

  • Chinatown Public Health Center Seismic Retrofit

  • City Clinic Relocation

  • New Police Evidence & Property Control Division facility at 1828 Egbert Avenue

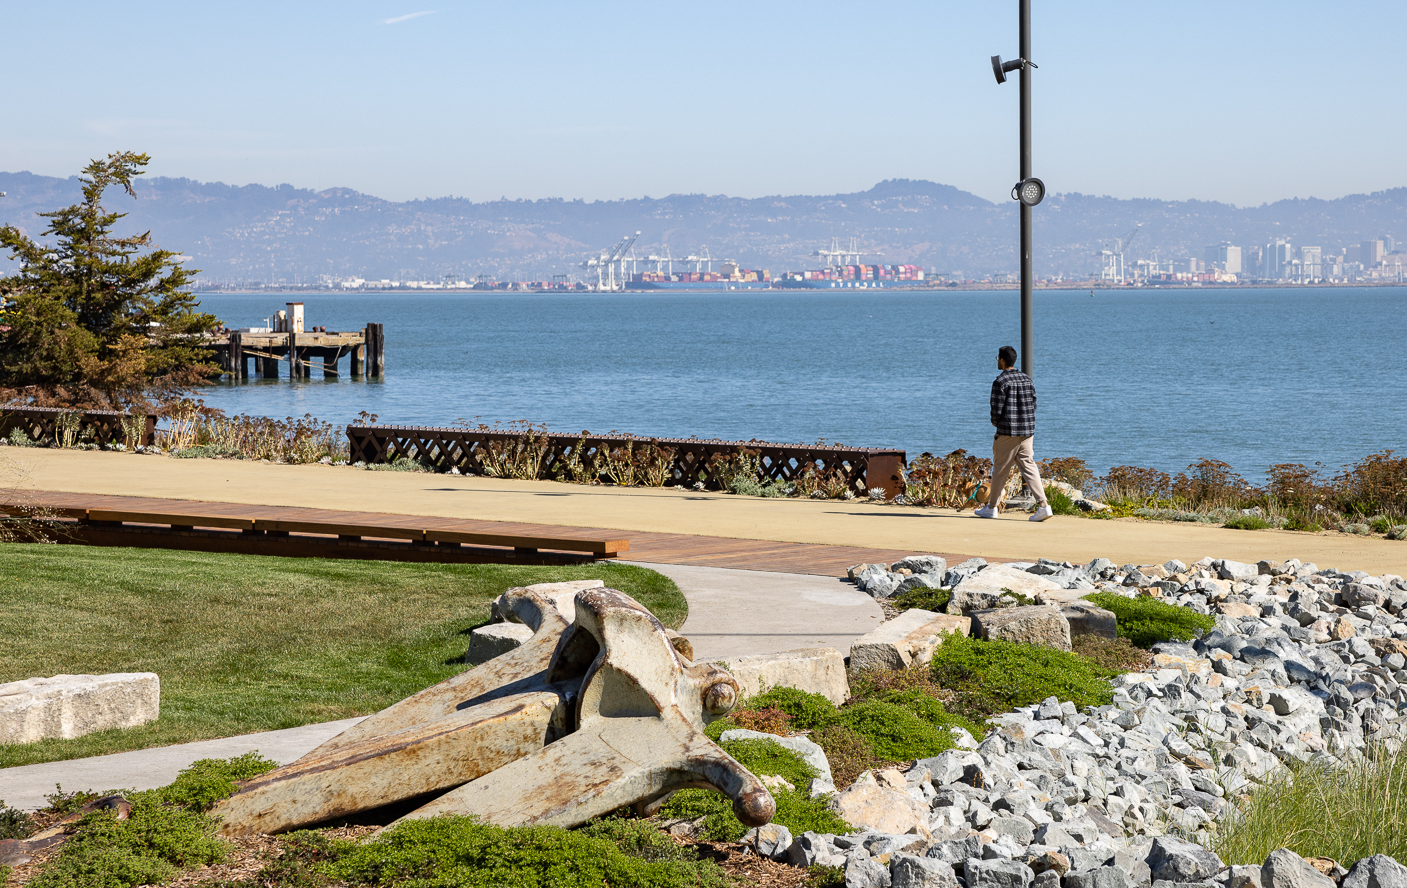
  • Park system renovations, including Portsmouth Square and India Basin 

  • Neighborhood Fire Stations program 

  • District Police Stations program 

  • New Division of Training facility for the Fire Department

  • ADA facilities and right-of-way barrier removal

  • Zuckerberg San Francisco General and Laguna Honda Hospital campus improvements

Enterprise Departments

  • Seawall strengthening

  • SFMTA facilities

  • Muni Forward 

  • Vision Zero Pedestrian Safety Program 

  • Water, Sewer, and Power Enterprise improvements 

  • SFO Terminal 1 and 3 improvements 

External Agencies

  • Affordable housing developments

  • Treasure Island redevelopment

  • City College seismic and code upgrades 

  • Modernization of SFUSD sites


Capital Plan Overview - 2026

Fiscal Years 2026-35 Capital Plan

Welcome to the FY2026-35 Capital Plan. The Plan captures a decade of infrastructure development, construction, and maintenance.

Click the "Chapter 1" button to the right to start exploring the Plan with the first chapter or go straight to any chapter using the left sidebar.

If you prefer a PDF, just click "Download the Plan".


Subscribe to

back to top