Many of San Francisco's capital improvements are funded with voter-approved general obligation bonds (G.O. bonds) and General Fund debt called Certificates of Participation (COPs), or revenue bonds. Issuing debt is a typical method for financing capital enhancements with long useful lives and high upfront costs, which the City would not be able to cover through the Pay-Go Program. The use of debt also spreads the financial burden of paying for facilities between current residents and future generations who will also benefit from the projects.
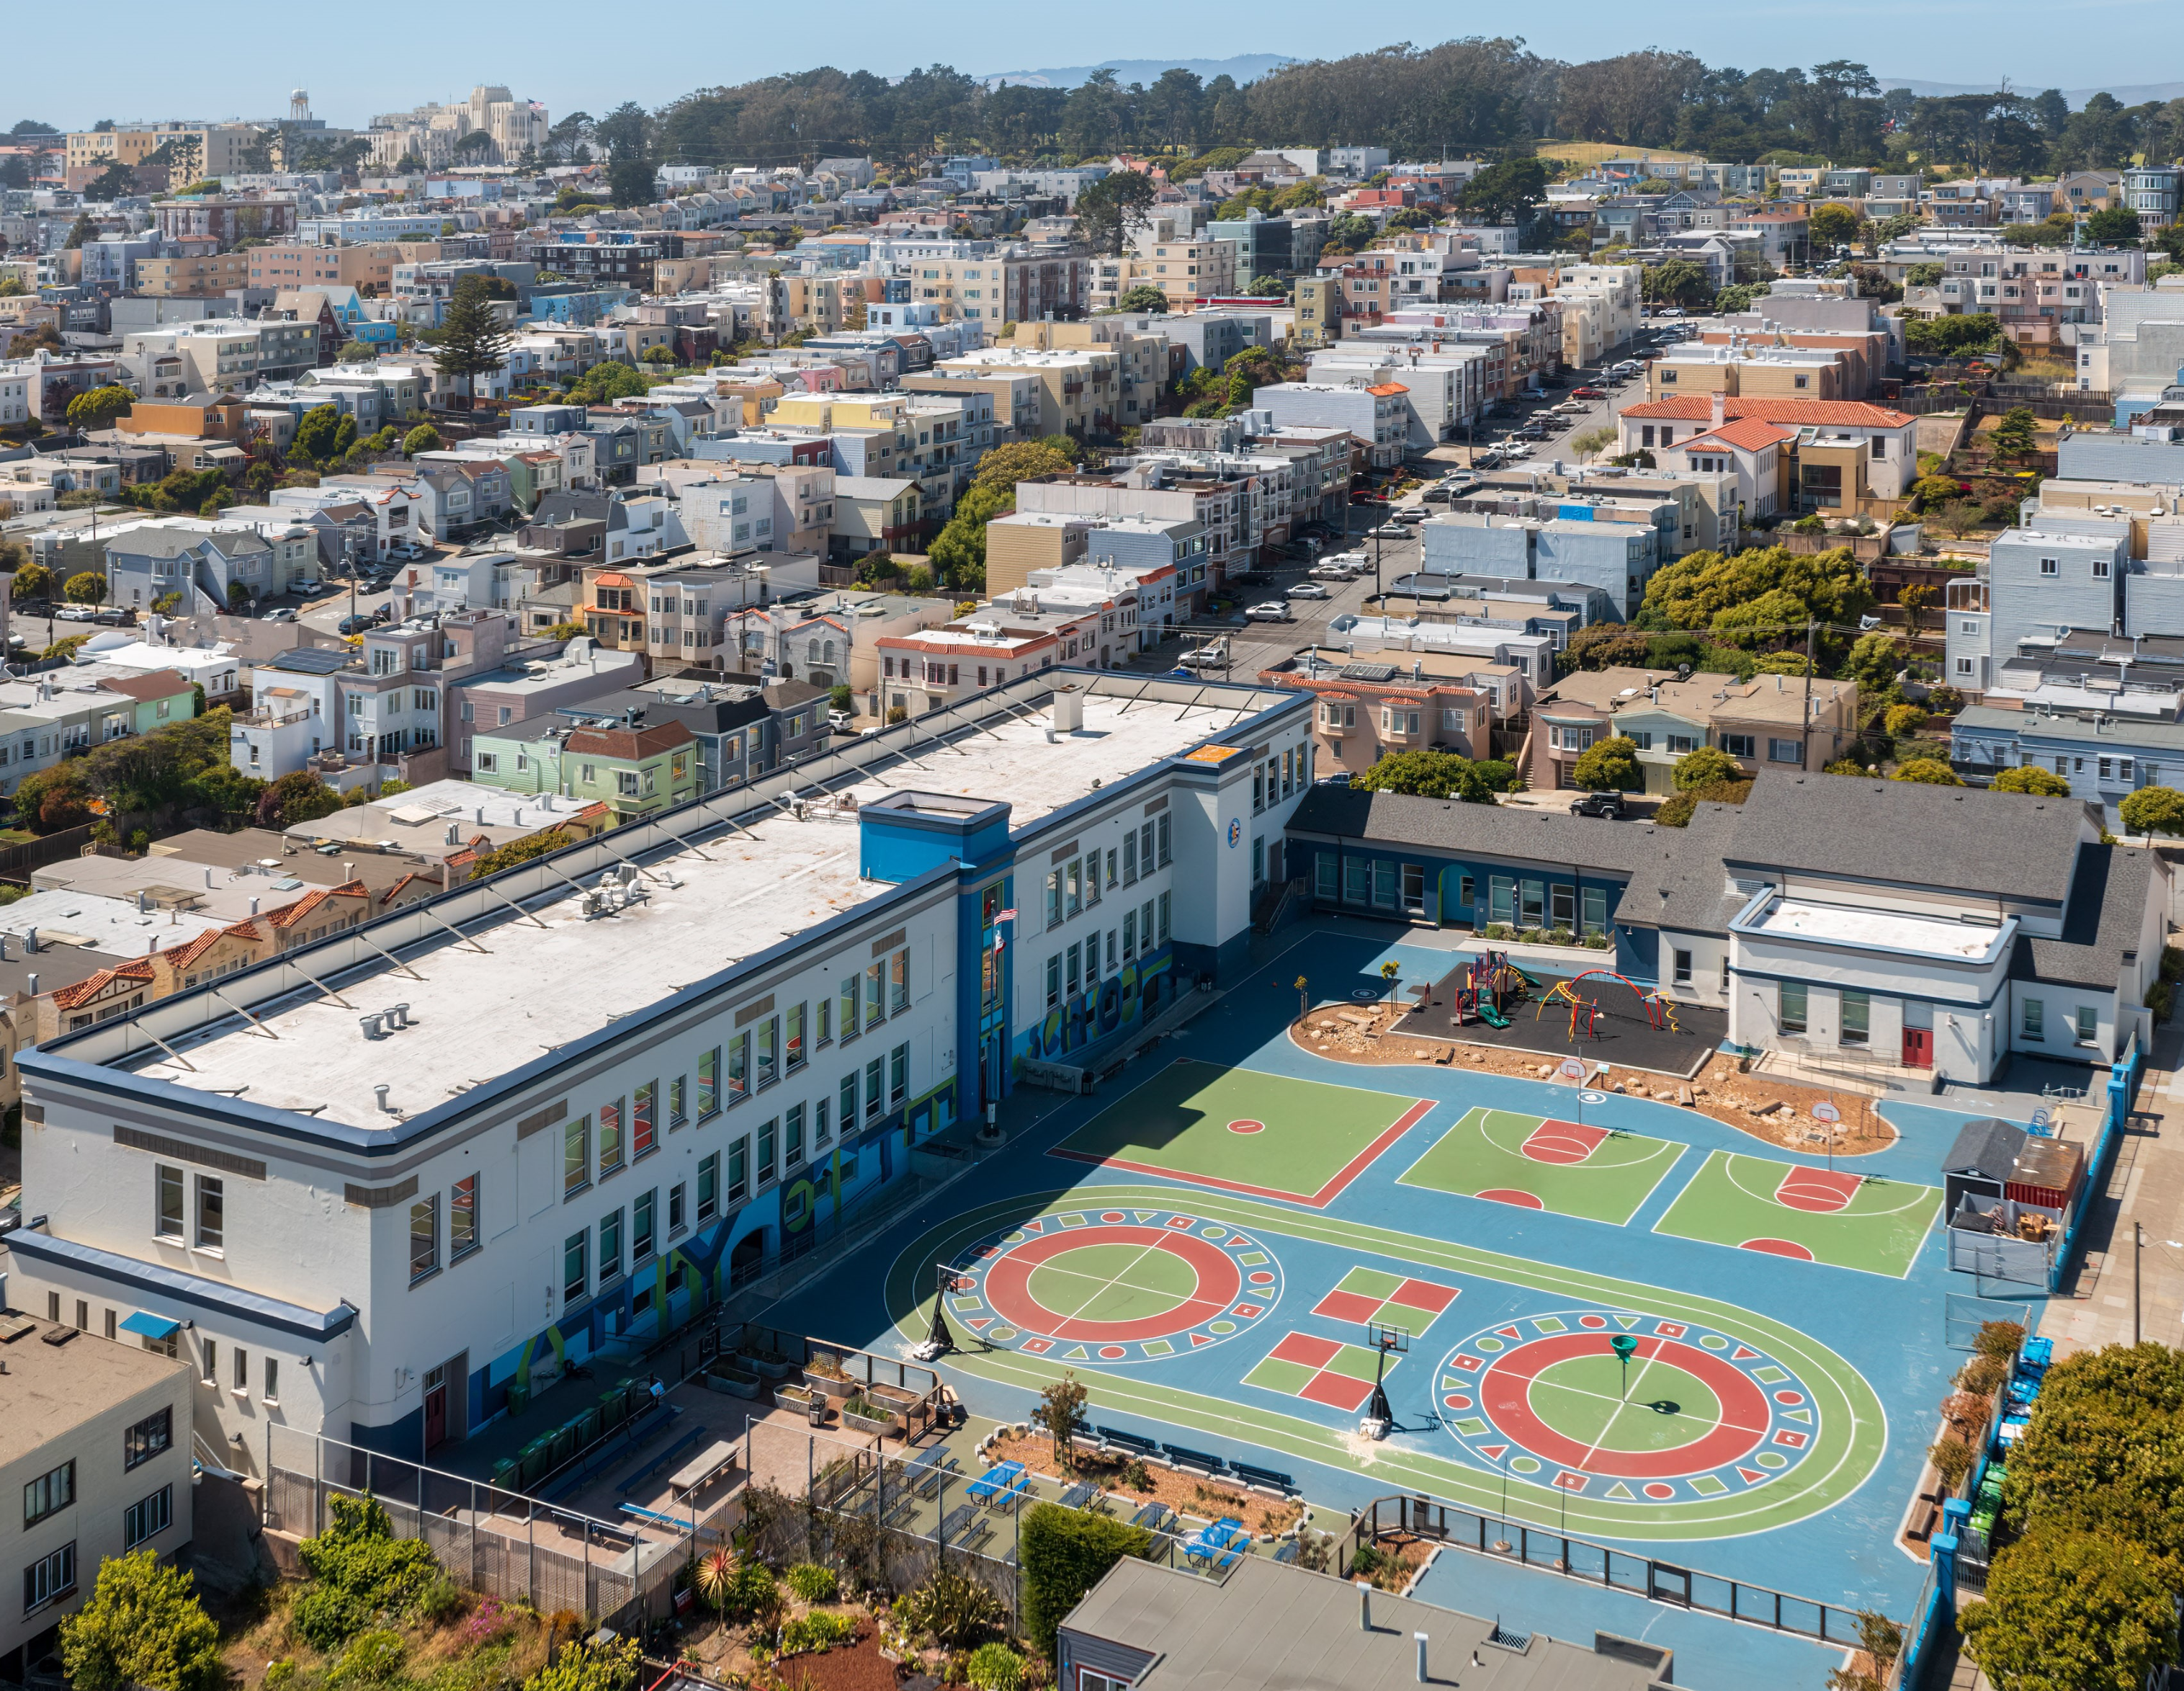
Merced Heights Playground
General Obligation Bonds
G.O. bonds are backed by the City’s property tax revenue and are repaid directly out of property taxes through a fund held by the Treasurer’s Office.
The Plan structures the G.O. bond schedule around the notion of rotating bond programs across areas of capital need, although the City’s debt capacity, election schedules, and capital needs also inform these levels. This approach was established in the original Capital Plan and has been maintained ever since.
Priority areas of capital investment include Earthquake Safety & Emergency Response, Parks & Open Space, Affordable Housing, Transportation, Public Health, and the Waterfront. The Plan occasionally recommends bonds outside these categories if there is a demonstrated capital need that the City would otherwise not be able to afford. Table 5.1 lays out the planned G.O. bond schedule for upcoming elections.
Table 5.1
G.O. Bond Debt Program (Dollars in Millions)
Election Date
Bond Program
Amount
Nov 2026
Transportation
235
Mar 2028
Waterfront Safety and Climate
350
Nov 2028
Earthquake Safety & Emergency Response
350
Jun 2030
Parks and Open Space
200
Nov 2030
Public Health
250
Nov 2032
Transportation
200
Nov 2034
Affordable Housing
200
Total
1,785
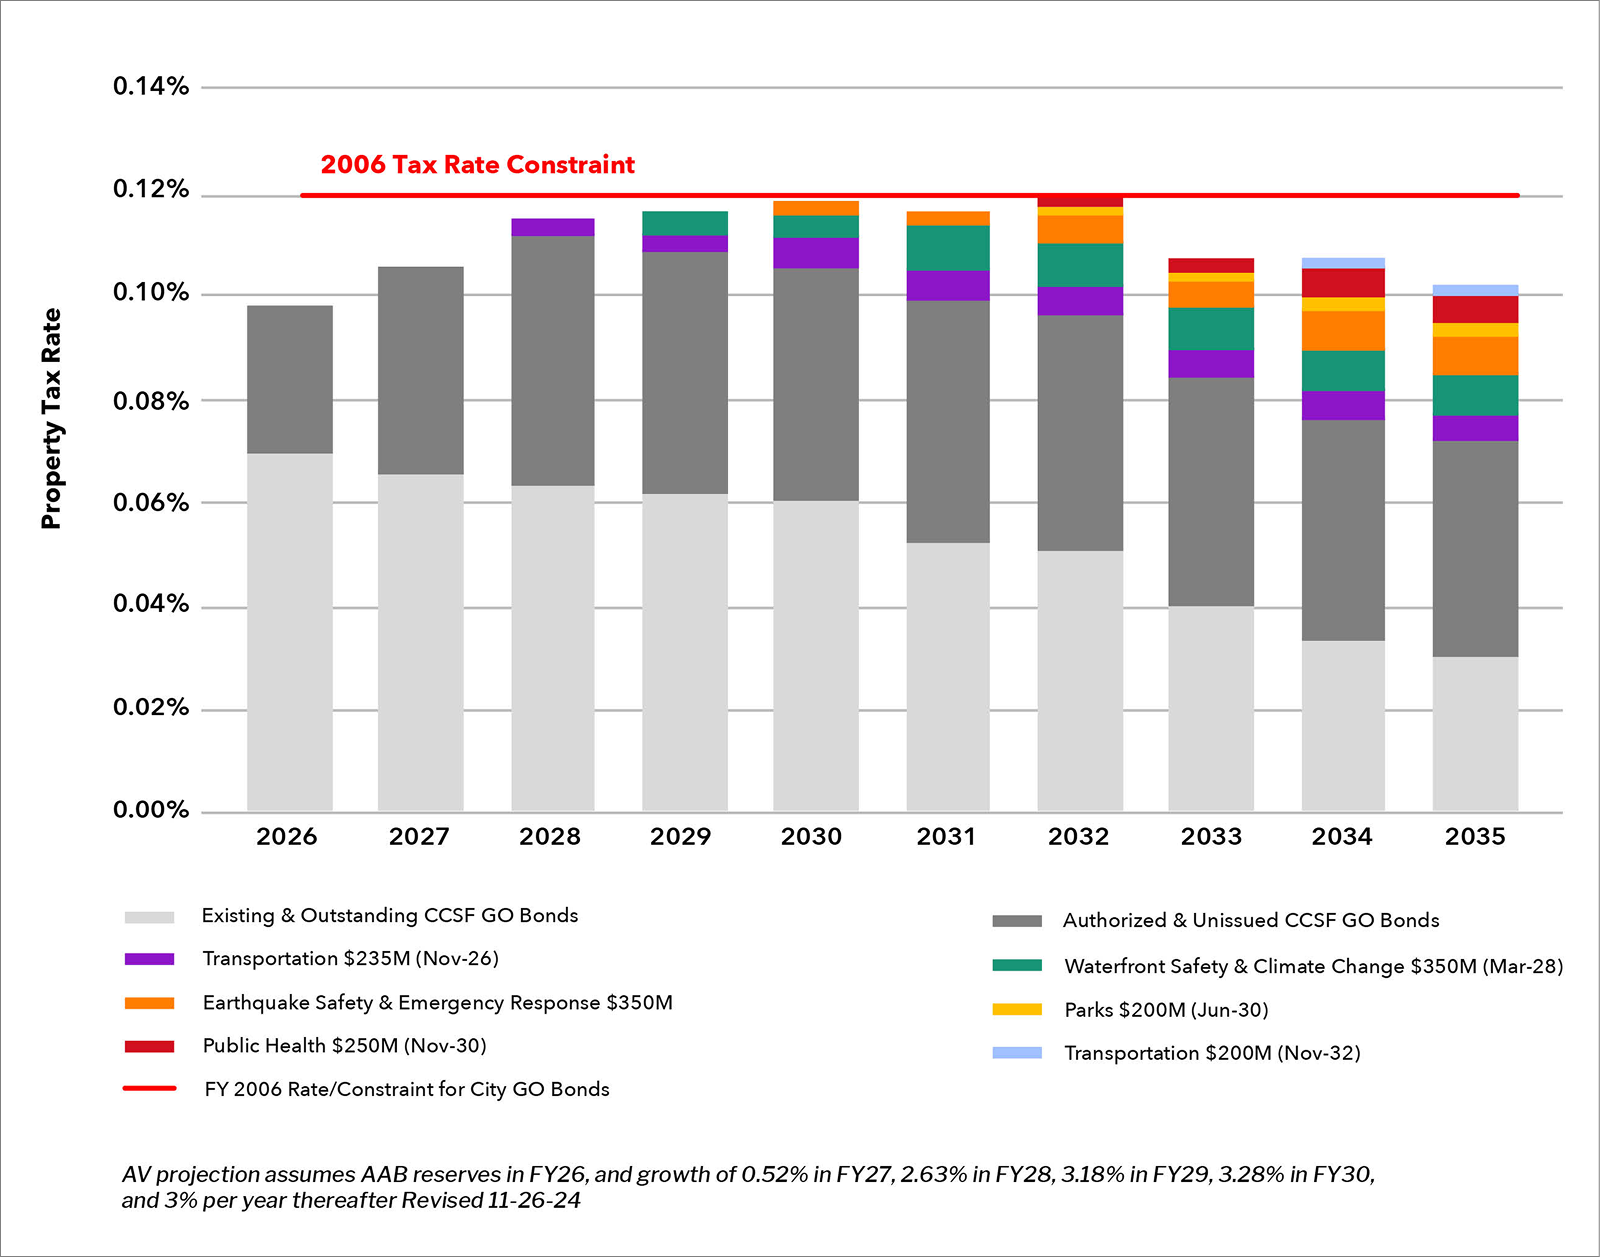
Chart 5.1 illustrates the impact on the local tax rate of issued, expected, and planned G.O. bond debt. The red line represents the property tax limit policy established in 2006 that sets the annual level of bond debt repayment. The space between the red line and the bars on the chart illustrates the projected capacity for bond debt for each year. All amounts attributed to future bonds are estimates and may need to be adjusted to account for new federal and state laws, programmatic changes, site acquisition, alternate delivery methods, changing rates of construction cost escalation, and/or newly emerged City needs.
Chart 5.1 - Capital Plan G.O. Debt Program FY2026-35
The G.O. Bond Program’s capacity is largely driven by changes in assessed value and associated property tax revenues within the city. While the passage of recent bonds is a sign of the effectiveness of the capital planning process, it also impacts the available bond capacity going forward. The passage of six bonds for a total of $2.8 billion since 2018 means there is considerably less capacity for this 10-year capital planning cycle compared to previous ones. For more information on the G.O. bond policies and past bonds, please see the Introduction.
Certificates of Participation
Certificates of Participation (COPs) are secured by a physical asset in the City’s capital portfolio and supported through annual General Fund appropriations or revenue that would otherwise flow to the General Fund. Funding from COPs is planned to support basic City responsibilities such as relocating City staff from seismically deficient buildings.
Table 5.2 shows the Capital Plan’s COP Program for the next ten years.
Table 5.2
COP Program (Dollars in Millions)
Fiscal Year of Issuance
Project
Amount
FY2026
Relocation of HSA Headquarters
55
FY2026
Treasure Island Infrastructure
50
FY2027
Treasure Island Infrastructure
15
FY2027
HOJ Replacement
157
FY2030
HOJ Replacement
180
FY2032
HOJ Replacement
30
Total
487
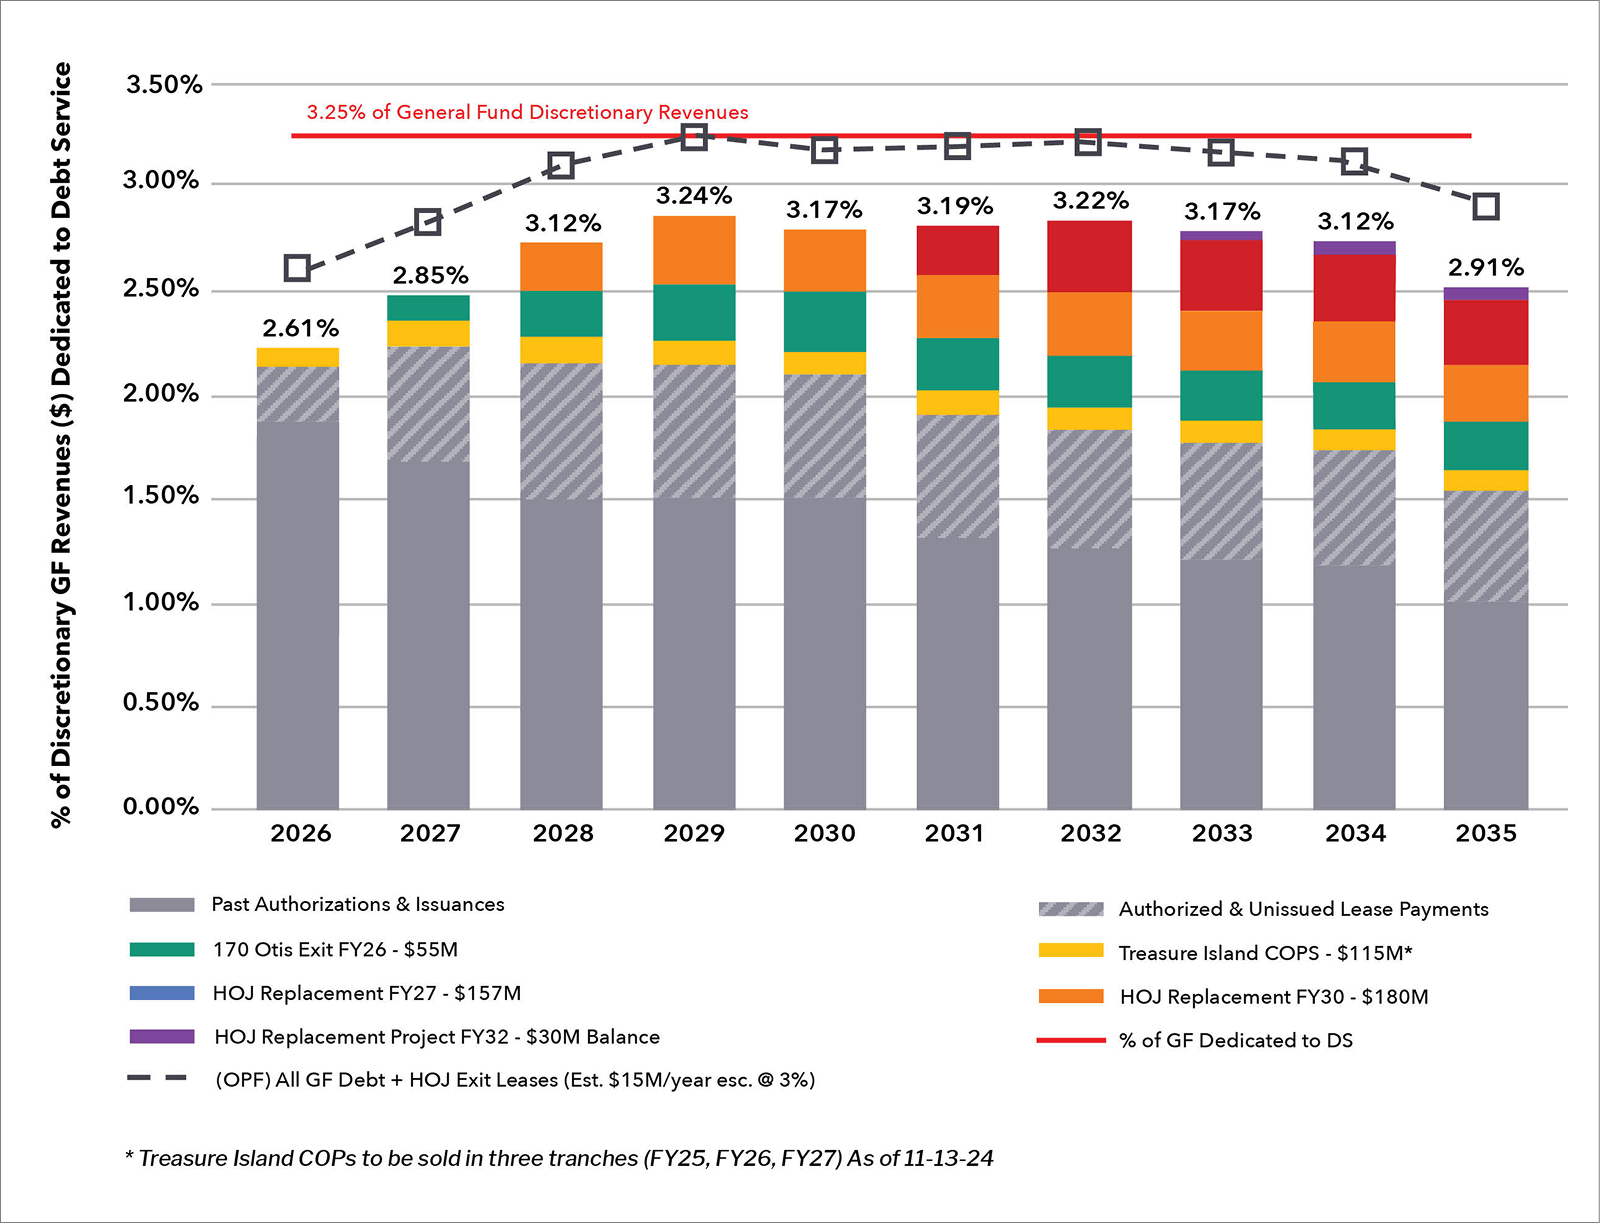
Chart 5.2 shows the planned COP Program against the policy constraint for General Fund debt not to exceed 3.25% of General Fund Discretionary Revenue, represented by the red horizontal line. The black line depicts the annual lease costs related to the Hall of Justice Administrative Exit efforts approved in 2018, which are also counted against this Program’s constraint.
The bottom portions of the columns represent debt service commitments for previously issued COPs as well as authorized but unissued COPs, including the debt issued for the Moscone Center, the War Memorial Veterans Building, and the Animal Care & Control Shelter replacement. New obligations are represented in discrete colors, beginning in FY2026. As with the G.O. Bond Program, all amounts attributed to future COP-funded programs are estimates and may need to be adjusted in future plans to account for new federal and state laws, programmatic changes, site acquisition, alternate delivery methods, changing rates of construction cost escalation, and/or newly emerged City needs.
Chart 5.2 - Capital Plan General Fund Debt Program FY2026-35
Revenue Bonds
Revenue bonds are a type of debt that is repaid from department or other revenue streams. Revenue bonds are typically used by the City’s Enterprise departments (SFMTA, Port, SFPUC, and SFO), which generate their own revenues from fees paid by users of services provided by those agencies. This type of debt is repaid solely by users of those projects and therefore does not require payments from the General Fund. Examples of projects funded by revenue bonds are the SFPUC’s Water Systems Improvement Program and the Airport’s Terminal Renovation Program.
Table 5.3 shows the currently planned amount of revenue bonds to be issued over the 10-year term of this Plan. All revenue bond issuances are subject to change based on market conditions and cash flow needs of the associated projects.
Table 5.3
Planned Revenue Bond Issuances FY2026-35 (Dollars in Millions)
For details about the policies that govern the planning for the Pay-Go Program, the General Obligation Bond Program, the General Fund Debt Program, and Infrastructure Financing Districts, as well as general policies for the Plan overall, please refer to the Introduction.
San Francisco uses a variety of funding sources to implement the broad array of building and infrastructure projects planned each year. These include the San Francisco General Fund, publicly issued debt, federal and state grants, and other local funding sources. These funds have been used for countless facilities, parks, streetscapes, and transportation initiatives.
Pay-As-You-Go Program
Over the 10-year timeframe of this Capital Plan, the primary source of revenue to fund our ongoing annual needs or Pay-As-You-Go Program (“Pay-Go”), is the San Francisco General Fund. The General Fund is comprised of various taxes collected by the City, which include property, sales, business, and hotel taxes. It serves as the primary funding stream for ongoing programs and services for the entire city. As infrastructure underpins these programs and services, it is appropriate for the General Fund set-aside funds to ensure buildings, streets, parks, and related infrastructure are in a state of good repair. All San Francisco residents, businesses, and visitors benefit from investments in local infrastructure.
Improvements paid through the Pay-Go Program tend to be smaller in scale than programs that require debt financing over a multi-year period. By using the Pay-Go Program for maintenance and repair projects, the City is less reliant on debt financing and ultimately spends less to deliver those projects.
Capital Planning Fund
The Capital Planning Fund supports critical project development and pre-bond planning outside the regular General Fund budget. This investment in planning helps increase public confidence and the likelihood that these projects will be delivered on time and on budget. The advance work helps improve cost estimation reliability and refine project delivery methods.
Historically, the General Fund supported pre-bond critical project development on the condition that once bonds for that project were issued, the General Fund would be reimbursed. This Plan assumes that bond reimbursements will flow into the Capital Planning Fund and be used for future project development. The Capital Planning Fund may be used for planning projects that are funded through sources other than bonds, but those funds are not reimbursable. Capital Planning Funds to support the next planned bond programs will be appropriated through the annual budget process.
Because the risk of a major earthquake is ever-present and the potential damage is significant, the City is constantly working to protect its residents, workers, and buildings from seismic risks. These efforts are primarily carried out through San Francisco’s Earthquake Safety Implementation Program (ESIP). ESIP is a comprehensive 30-year plan that grew out of the Community Action Plan for Seismic Safety (CAPSS) to address the City’s most pressing seismic risks. Priority earthquake resilience projects currently underway include the Concrete Building Safety Program and seismic retrofits for municipal and utility owned buildings and infrastructure.
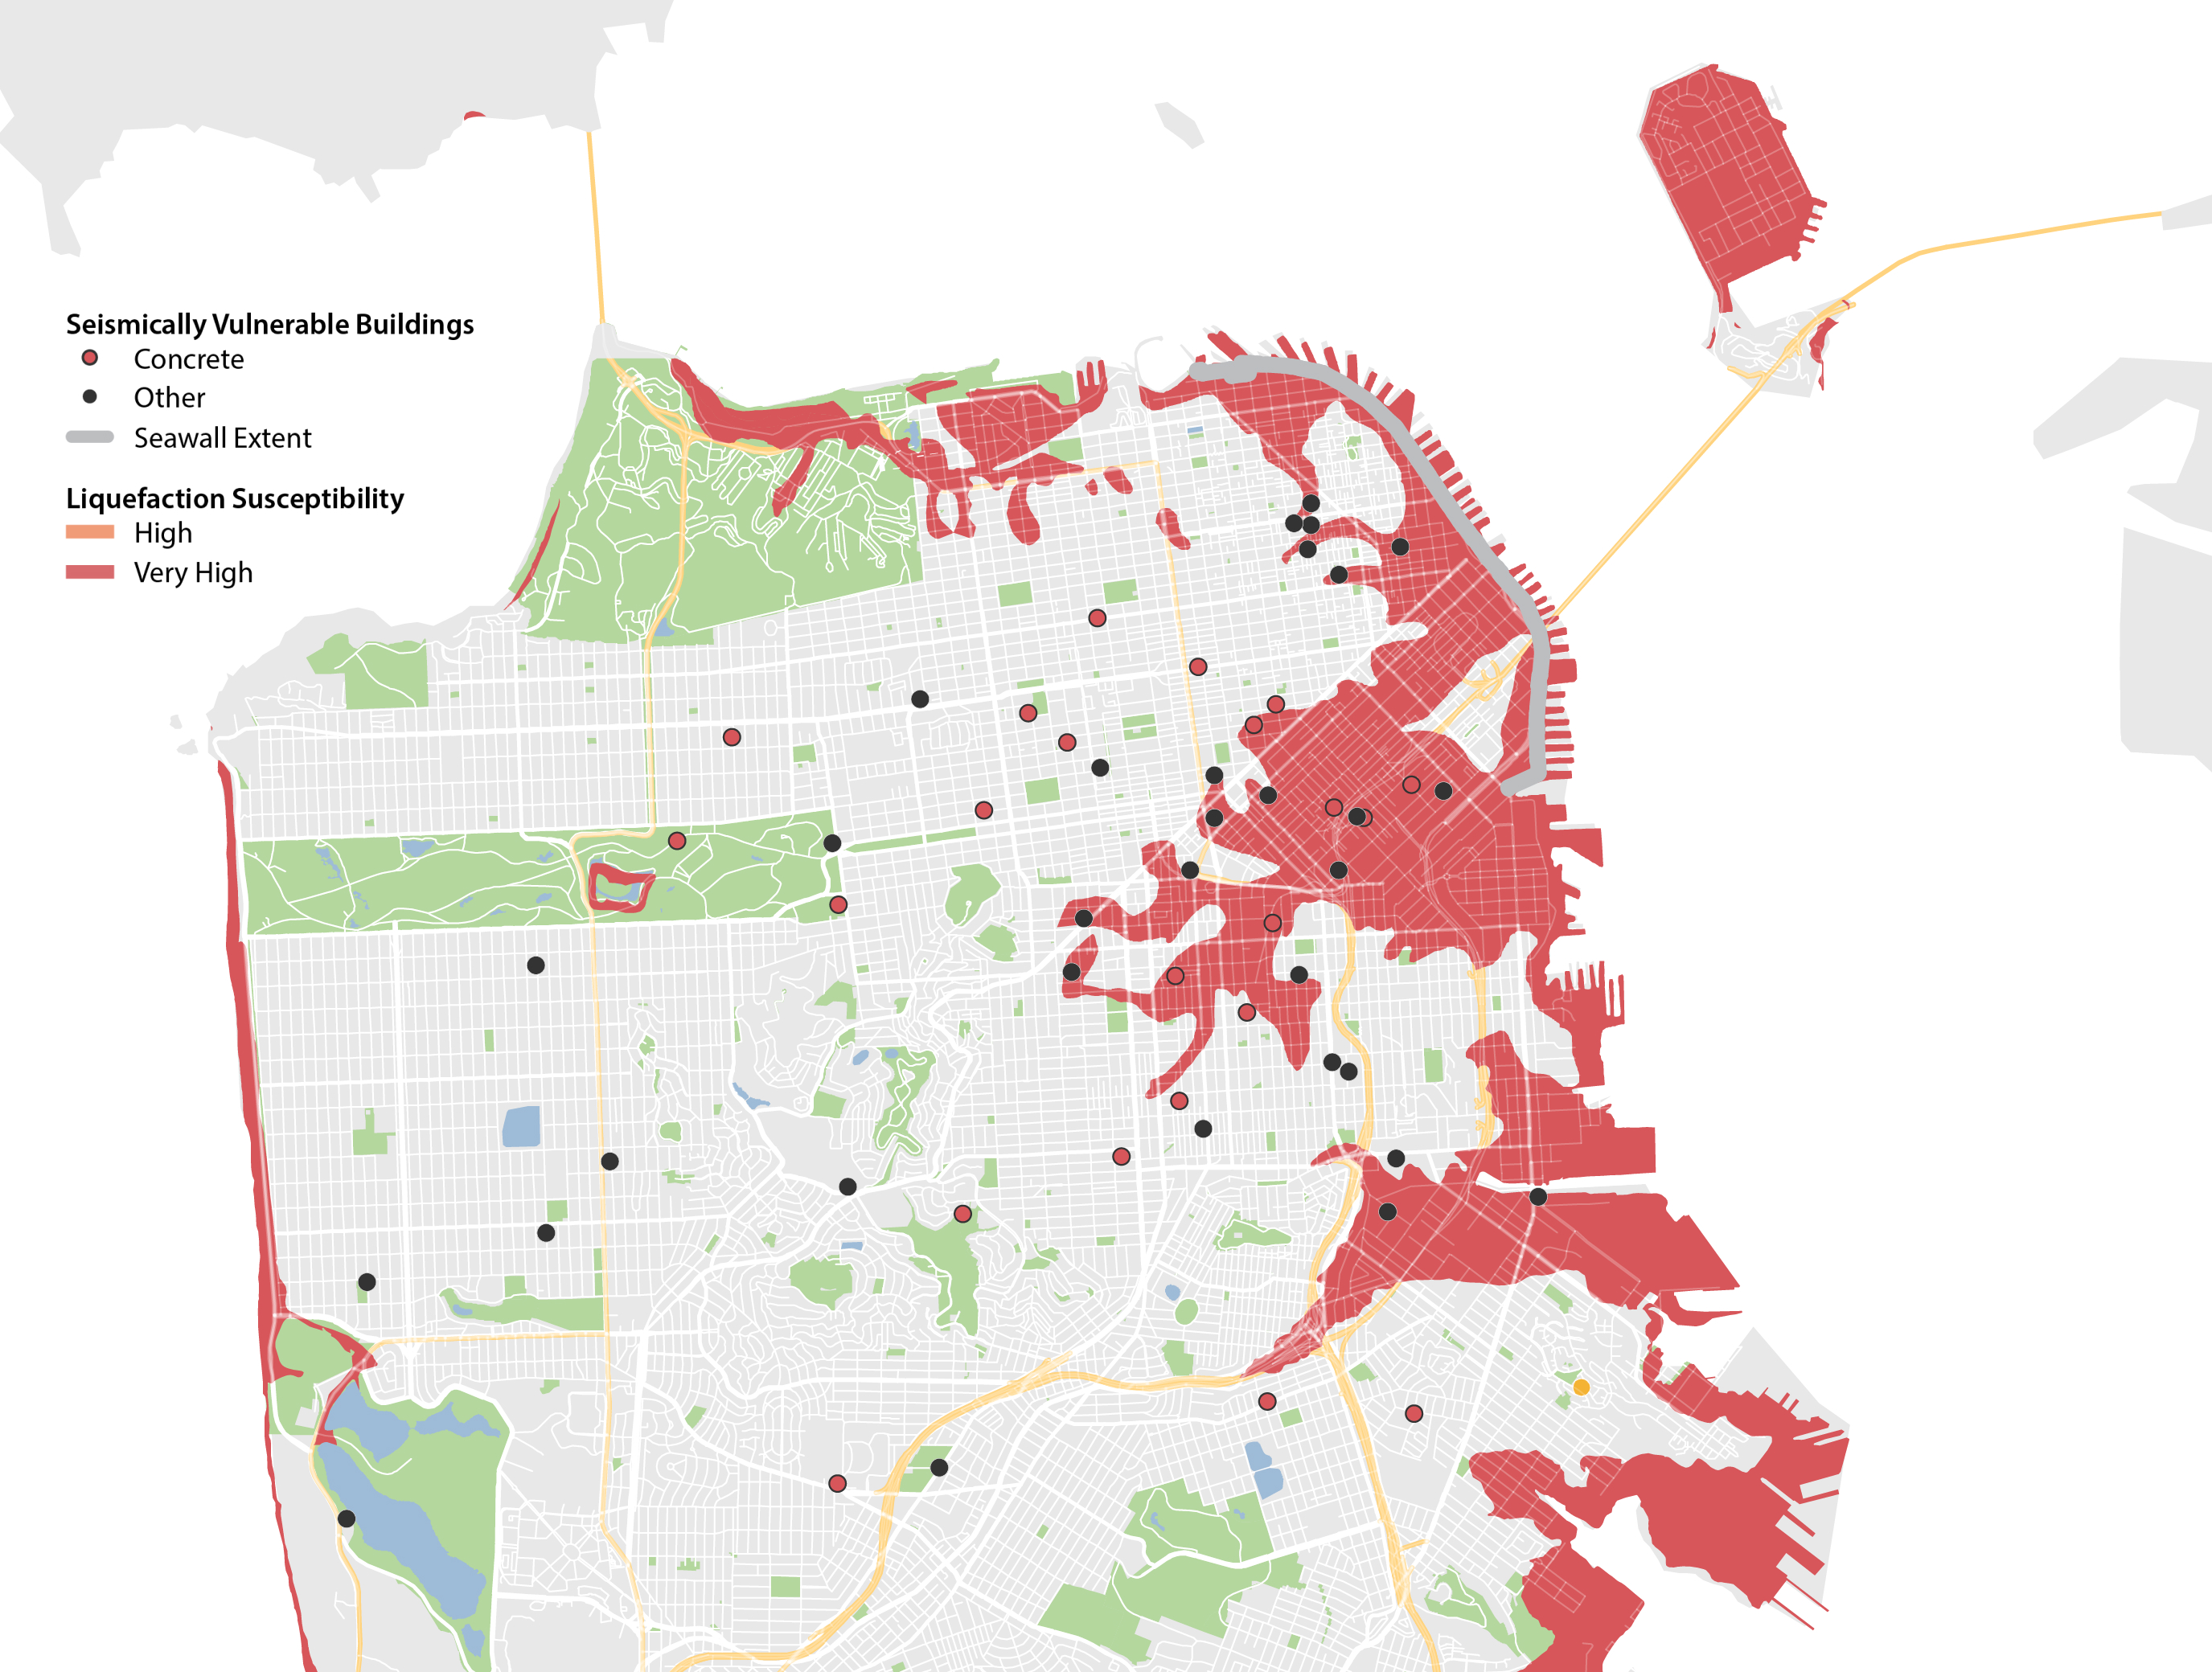
A rising priority for both public and private buildings is addressing vulnerable concrete and rigid-wall-flexible-diaphragm buildings. There are approximately 3,700 publicly and privately owned older concrete buildings that were constructed before modern City building codes, some of which have the potential to fail and collapse in an earthquake. To address this risk, the Office of Resilience and Capital Planning (ORCP) in coordination with the Department of Buildings Inspection (DBI) developed the Concrete Building Safety Program (CBSP). In response to recommendations from a working group of stakeholders, Mayor Breed issued Executive Directive 24-01, directing staff to develop legislation to identify concrete and rigid-wall-flexible-diaphragm buildings. The Directive also instructed the DBI to publish voluntary retrofit standards for concrete buildings in the San Francisco Existing Building Code to provide owners of vulnerable concrete buildings with a clear pathway on how to improve the safety of their buildings.
ORCP is also making efforts to address critical City-owned infrastructure vulnerable to failure in an earthquake. Seismic Hazard Ratings (SHRs) were first developed in San Francisco in 1992 and are used to assess risk and prioritize seismic-strengthening capital improvements for over 200 public buildings. Buildings are rated on a scale from SHR1 (best) to SHR4 (worst). At present, the City has addressed many of the buildings previously identified as SHR4. The status of the City’s remaining SHR3 and SHR4 buildings is summarized in the table below. Updating the ratings is important for the future prioritization of seismically vulnerable structures.
Seismic retrofit projects are typically bundled with other building improvements to increase the assets overall useful life. This includes modernizing building systems, addressing disability access and other requirements, as well as space alterations to improve functionality and service delivery. It’s also important to seismically reinforce non-structural building elements to the greatest extent possible. For more detailed information on the remaining City-owned SHR3 and SHR4 buildings, see Appendix E.
Table 4.1: Status of Known Remaining SHR3 and SHR4 Building
City-owned Seismically Vulnerable Buildings
SHR3
SHR4
Total buildings
19
14
Planning to Exit
2
3
Planning to Retrofit
6
7
Planning Phase
5
0
Design Phase
4
3
Under Construction
2
1
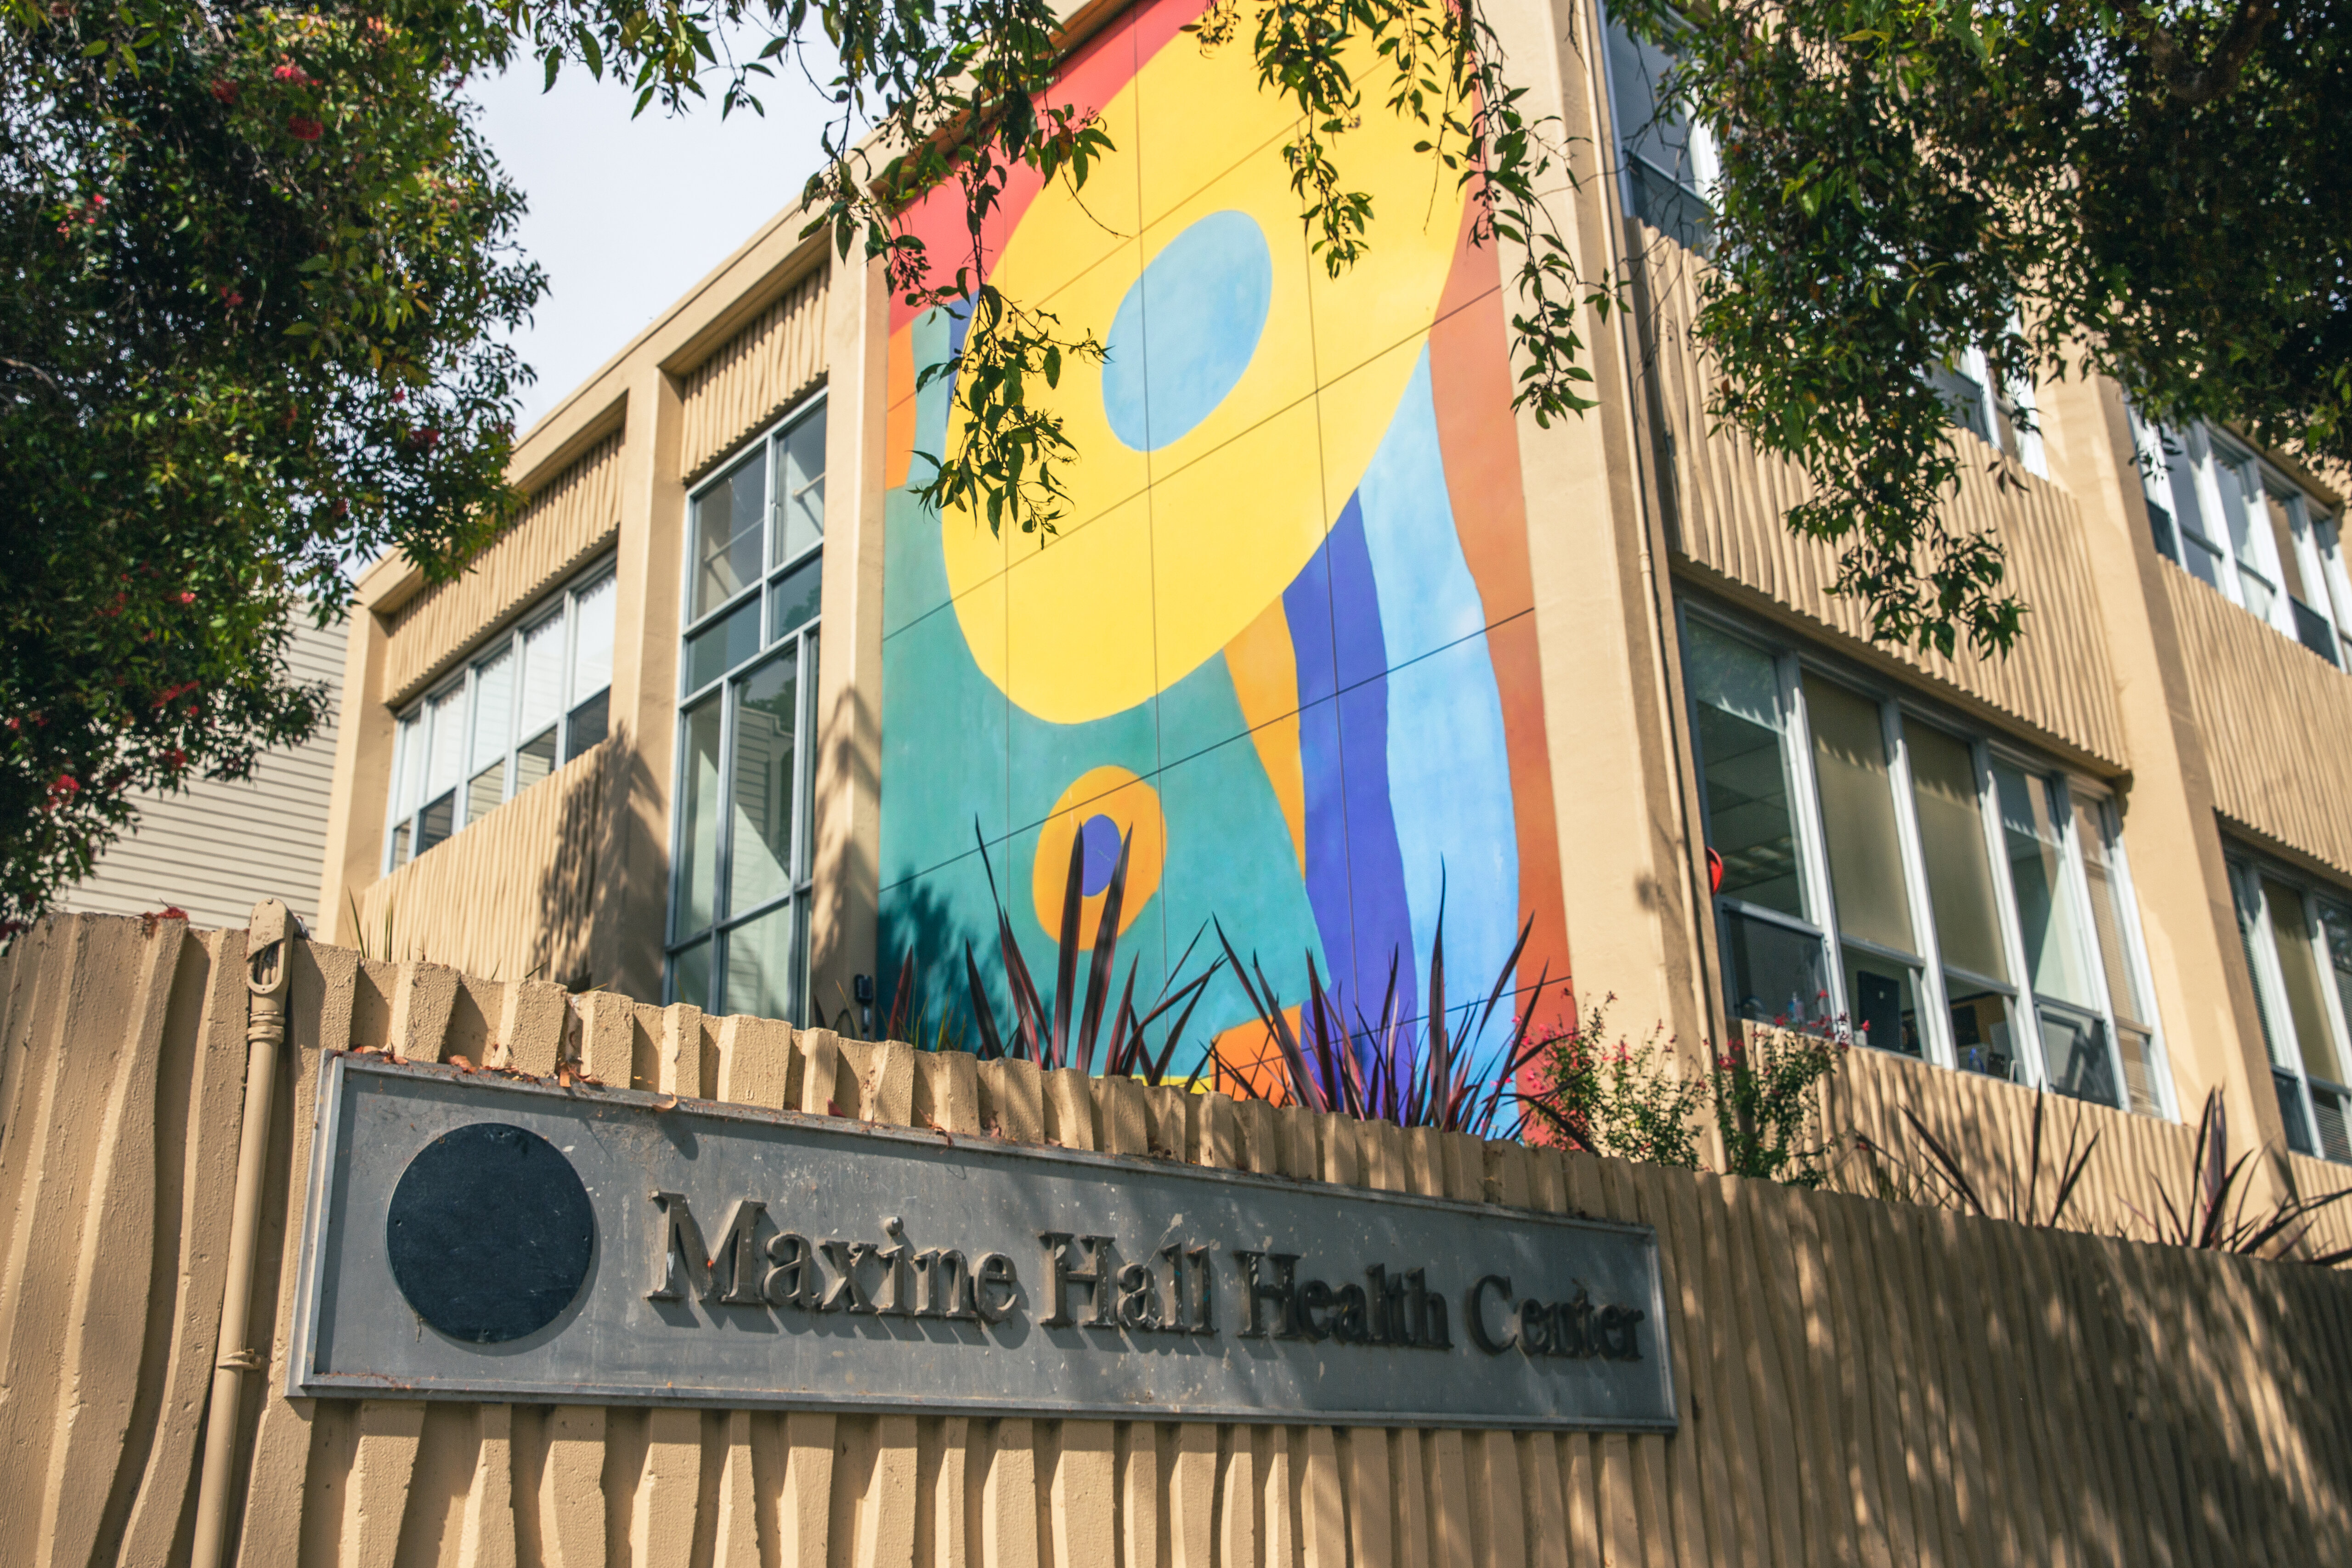
Maxine Hall Health Center
Lifelines Council
In addition to damaging buildings, earthquakes can also interrupt the provision of “lifeline” services like electricity, fuel, and water. Since 2009, the City has convened the Lifelines Council, a committee of public and private infrastructure providers who meet quarterly to share information and collaborate on seismic resilience initiatives. In 2020, this Council released the Lifelines Restoration Performance Improvement Plan, a report that assesses system interdependencies and makes recommendations about how lifeline access can be more quickly restored after a major disaster. In the anticipated 2025 update to this report, ORCP will follow up with infrastructure providers to understand how the recommendations are being implemented and any new emerging priorities.
Finally, several other key infrastructure improvement projects in progress will guard against earthquakes. This includes seismic retrofit work for the Embarcadero Seawall mentioned above; important Muni and SFPUC facilities; Islais Creek Bridge, and the Emergency Firefighting Water System. For more information, please see the Transportation Chapter, Infrastructure and Streets Chapter, andPublic Safety Chapter.
Building a climate-resilient San Francisco requires both safeguarding against current and future climate hazards as well as eliminating and sequestering harmful greenhouse gas (GHG) emissions. This section describes some of the key initiatives that the City is taking to make San Francisco resilient to immediate and long-term threats of climate change and build a more equitable and sustainable city.
Getting to Net-Zero
Chapter 9 of the environment code codifies San Francisco’s emissions reductions goals of 61% below 1990 levels by 2030, and net-zero emissions by 2040. The 2021 Climate Action Plan (CAP), which is currently being updated for 2025, is the City’s roadmap for meeting these emissions reduction goals. Capital costs, including considerable direct investments in the City’s buildings and infrastructure described below, only represent a portion of the total funding needed to implement the CAP.
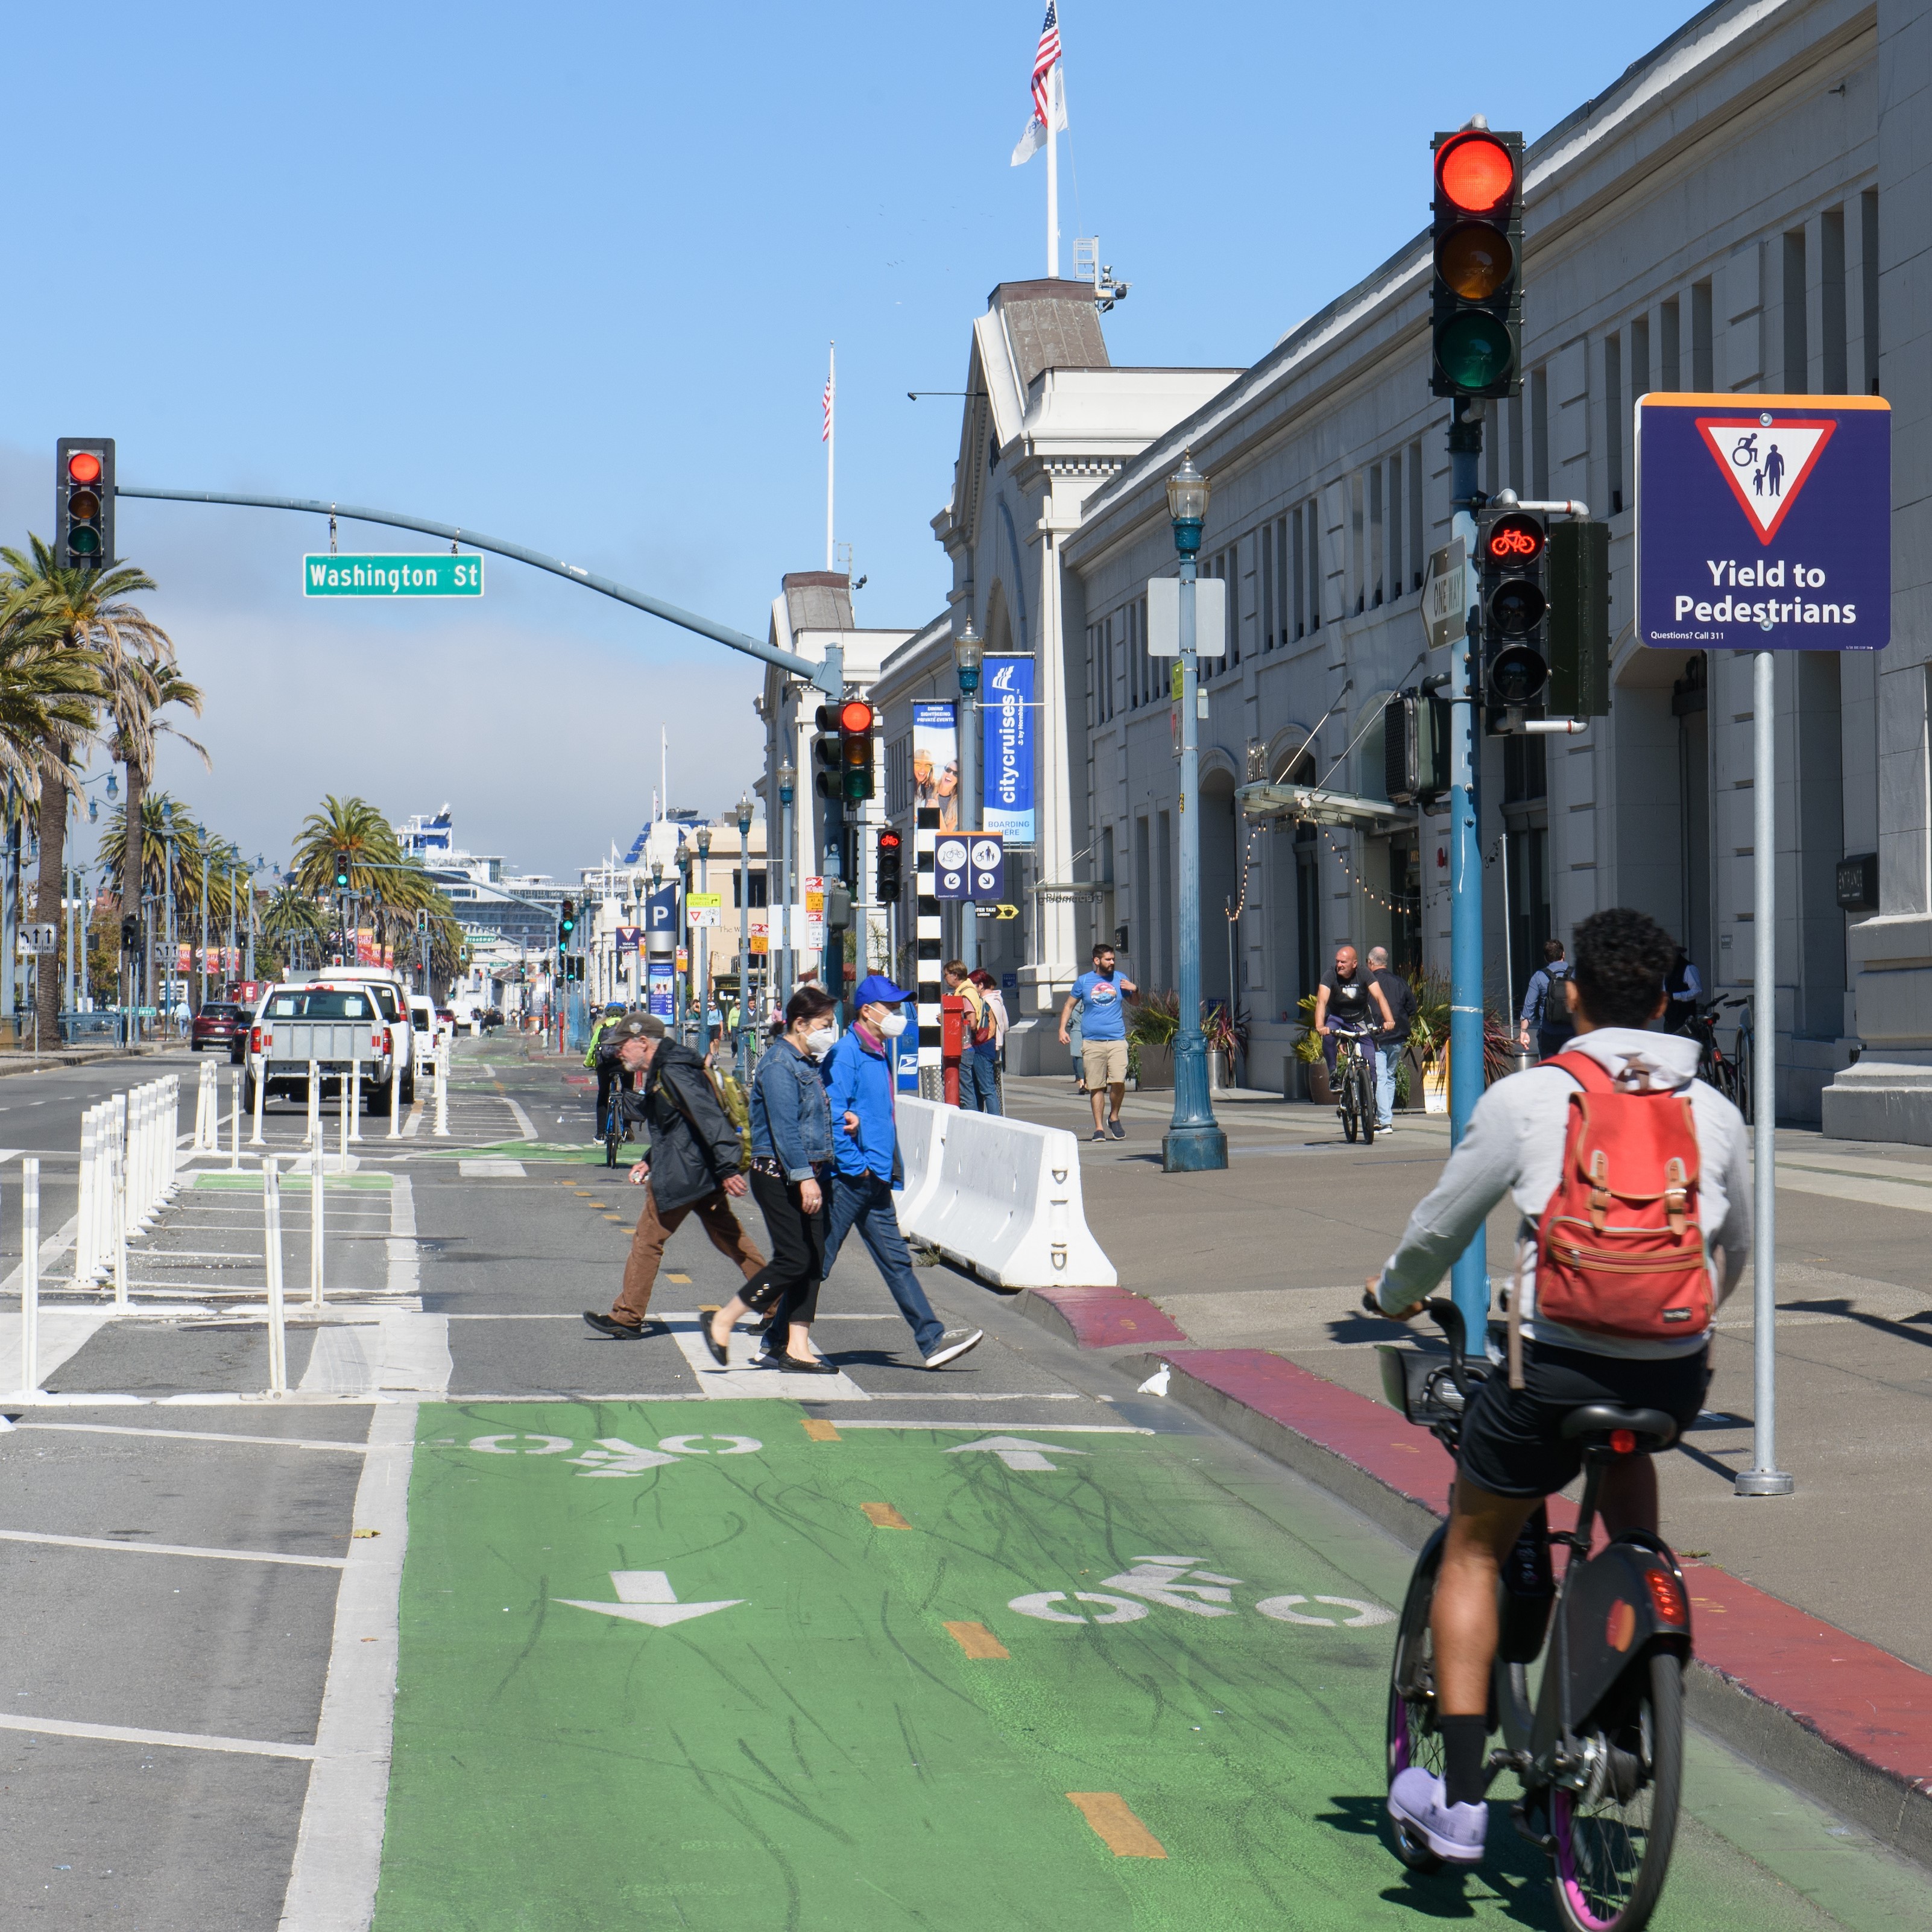
Embarcadero Bikeway
Transportation and Land Use
Per the City’s 2022 GHG emissions Inventory, 45% of the City’s total emissions are associated with the transportation sector. The 2021 CAP goals for the Transportation and Land Use sector are for 80% of trips to be taken by low carbon modes by 2030, and for 25% of all registered vehicles to be electric by 2030. The capital investments needed to support these goals primarily relate to the City’s transit system, its active transportation network, and its municipal fleet. The Municipal Transportation Agency (SFMTA) Climate Roadmap (2023) includes specific opportunities to support these emissions reduction goals.
Public Transit
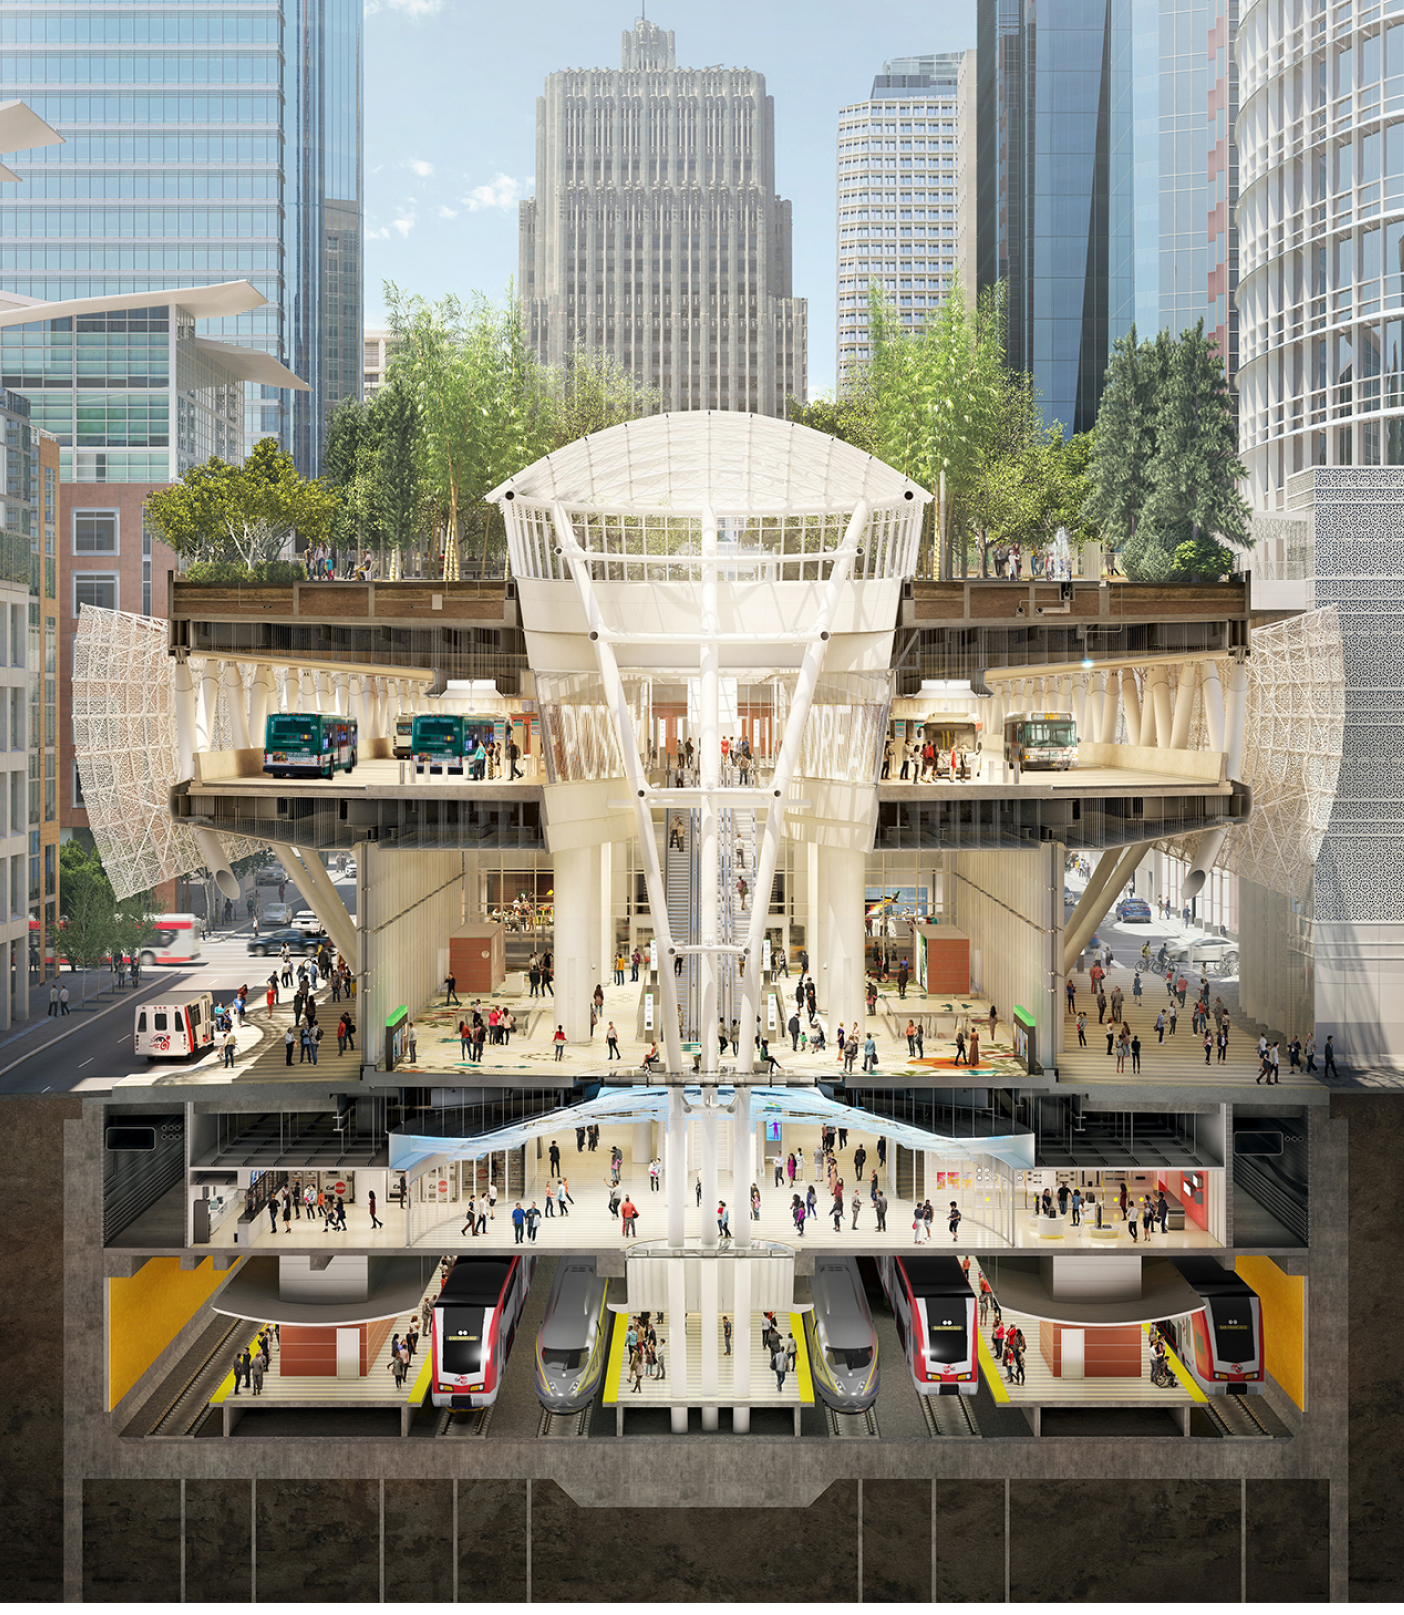
One key strategy in the Roadmap is to “build a fast and reliable transit system that will be everyone’s preferred way to get around”. These plans include advancing major transit capital projects, including a new Geary Subway line and a Central Subway extension. Other important actions include implementing a “Five-Minute Network” (the infrastructure required to have service every 5 minutes or better on core transit corridors) and other important improvements and modernizations to the Muni system. The cost of implementing these improvements through 2050 is approximately $34.5 billion in 2022 dollars.
SFMTA is also working towards a zero-emission bus fleet in support of the City’s CAP. It is currently in the process of evaluating how to transition facilities to support an electric bus fleet through its Building Progress Program to rebuild and upgrade our most obsolete yards. This process includes several pilot projects to validate technology decisions that can work at a larger scale. SFMTA’s 20-Year Capital Plan includes an eBus Facilities Conversion project at an estimated cost of $782 million in 2022 dollars. For more details on planned and deferred transit and transportation network investments, see the Transportation Chapter.
Another key strategy in the Roadmap is to “create a complete and connected active transportation network that shifts trips from automobiles to walking, biking, and other active forms of transportation modes. The types of needed capital investments include protected bicycle lanes, Slow Streets, bicycle parking, and access to active transportation options at transit stops. The cost of implementing these improvements through 2050 is estimated to cost $898 million in 2022 dollars. SFMTA is in the process of completing a Biking and Rolling Plan by early 2025, which will provide more detail on the needed investments, especially in the near term.
Electric Vehicle Charging
A third strategy in the Roadmap is to “accelerate adoption of zero-emissions vehicles (ZEVs) and other electric mobility options”. Charging infrastructure is needed across the City in order to make the transition to electric vehicles more attractive and accessible to people and organizations. The types of needed capital investments include expanding the number of charging stations to at least 10% of spaces in municipally owned parking lots, and explore curbside EV charging through a feasibility study. The cost of implementing these improvements through 2050 is approximately $161 million in 2022 dollars.
Fleet Decarbonization
Finally, San Francisco plans to decarbonize its (non-revenue) fleet of light-, medium-, and heavy-duty vehicles to both align with its emissions reduction goals and comply with state “Advanced Clean Fleet” regulations. The Administrator’s Office estimates that $30 million in 2024 dollars is needed to install an estimated 1,500 chargers for its light-duty vehicles. Importantly, these estimates do not include the potential costs associated with electrical grid upgrades that will be needed to support increased charging capacity across the City. The City has already secured an initial investment of $5 million for charging infrastructure. Investments in alternate fuel technologies such as hydrogen fuel cells are likely needed to fully decarbonize the City’s heavy-duty vehicle fleet.
Building Operations
Per the City’s 2022 GHG Emissions Inventory, 44% of the City’s total emissions are associated with the building sector. The CAP establishes zero-emission targets for large commercial buildings by 2035, and all buildings by 2040. A key strategy to achieve this goal is to phase out natural gas equipment with efficient and all-electric equipment. Achieving this mostly relies on investment by private building owners, but large investments in City-owned facilities will also be required.
Municipal Buildings
Four percent of the City’s emissions come from municipal buildings—which has been slightly increasing since 2015. Chapter 7 of the San Francisco Environment Code mandates that all new municipal buildings and major renovations must be fully electric, eliminating fossil fuel use for heating, cooling, water heating, and cooking. Additionally, it requires existing building systems to be electrified upon equipment replacement or failure. City departments must inventory gas-using equipment in their buildings using an application developed and managed by SF Environment. To date, 228 buildings are included in the current inventory.
A 2019 San Francisco Public Utilities Commission (SFPUC) natural gas consumption study estimates that 31% of annual natural gas consumption could be eliminated through projects currently in process or through mechanical retrofits in the next 10 years. The study also provides cost estimates for six example projects that range from $100,000 to decarbonize 1 South Van Ness to $500,000 million to decarbonize the San Francisco Airport. Electric infrastructure upgrades and building improvements will also likely to be needed for most existing-municipal-building electrification projects. According to the SFPUC, interconnection costs alone are expected to range from $1.2 to $3.3 million per building.
In addition, Chapter 7 requires implementing solar and energy storage capabilities at Critical Community Institutions to provide carbon-free emergency power. The requirement applies to new construction, and major renovations at public safety facilities, health clinics, community centers, libraries, and emergency management facilities. The total capital cost associated with this requirement is estimated to fall between $247 million to $1.58 billion in electrification costs for 332 municipal buildings.
Energy Supply
As of 2022, 89% of the electricity consumed by the City is generated from renewable sources. The City’s CAP sets a goal to achieve 100% renewable electricity by 2025, and 100% renewable energy by 2040 (meaning no fossil fuels). A key strategy to achieve this is to provide 100% renewable electricity at affordable rates which will then facilitate the decarbonization of buildings and transportation.
The CAP calls for a “decarbonization master plan,” which would map out strategic decommissioning of the natural gas system to accompany electrification efforts. The master plan would also aim to protect low-income ratepayers during this transition.
Achieving the CAP’s energy supply goals requires investment in distribution infrastructure, including acquisition of PG&E’s assets serving the city, to provide clean, reliable and affordable electricity. Fully controlling electrical delivery would also allow San Francisco to advance equity in electric service and workforce development. The City and County submitted a petition with the California Public Utilities Commission (CPUC) requesting a formal determination of the value of PG&E’s local electric infrastructure, which is the next step in the City’s efforts to acquire the utility’s city-based electric facilities and complete the transition to public power. The request comes after the City made a $2.5 billion offer in 2019 and again in 2020 to purchase PG&E’s local electric assets.
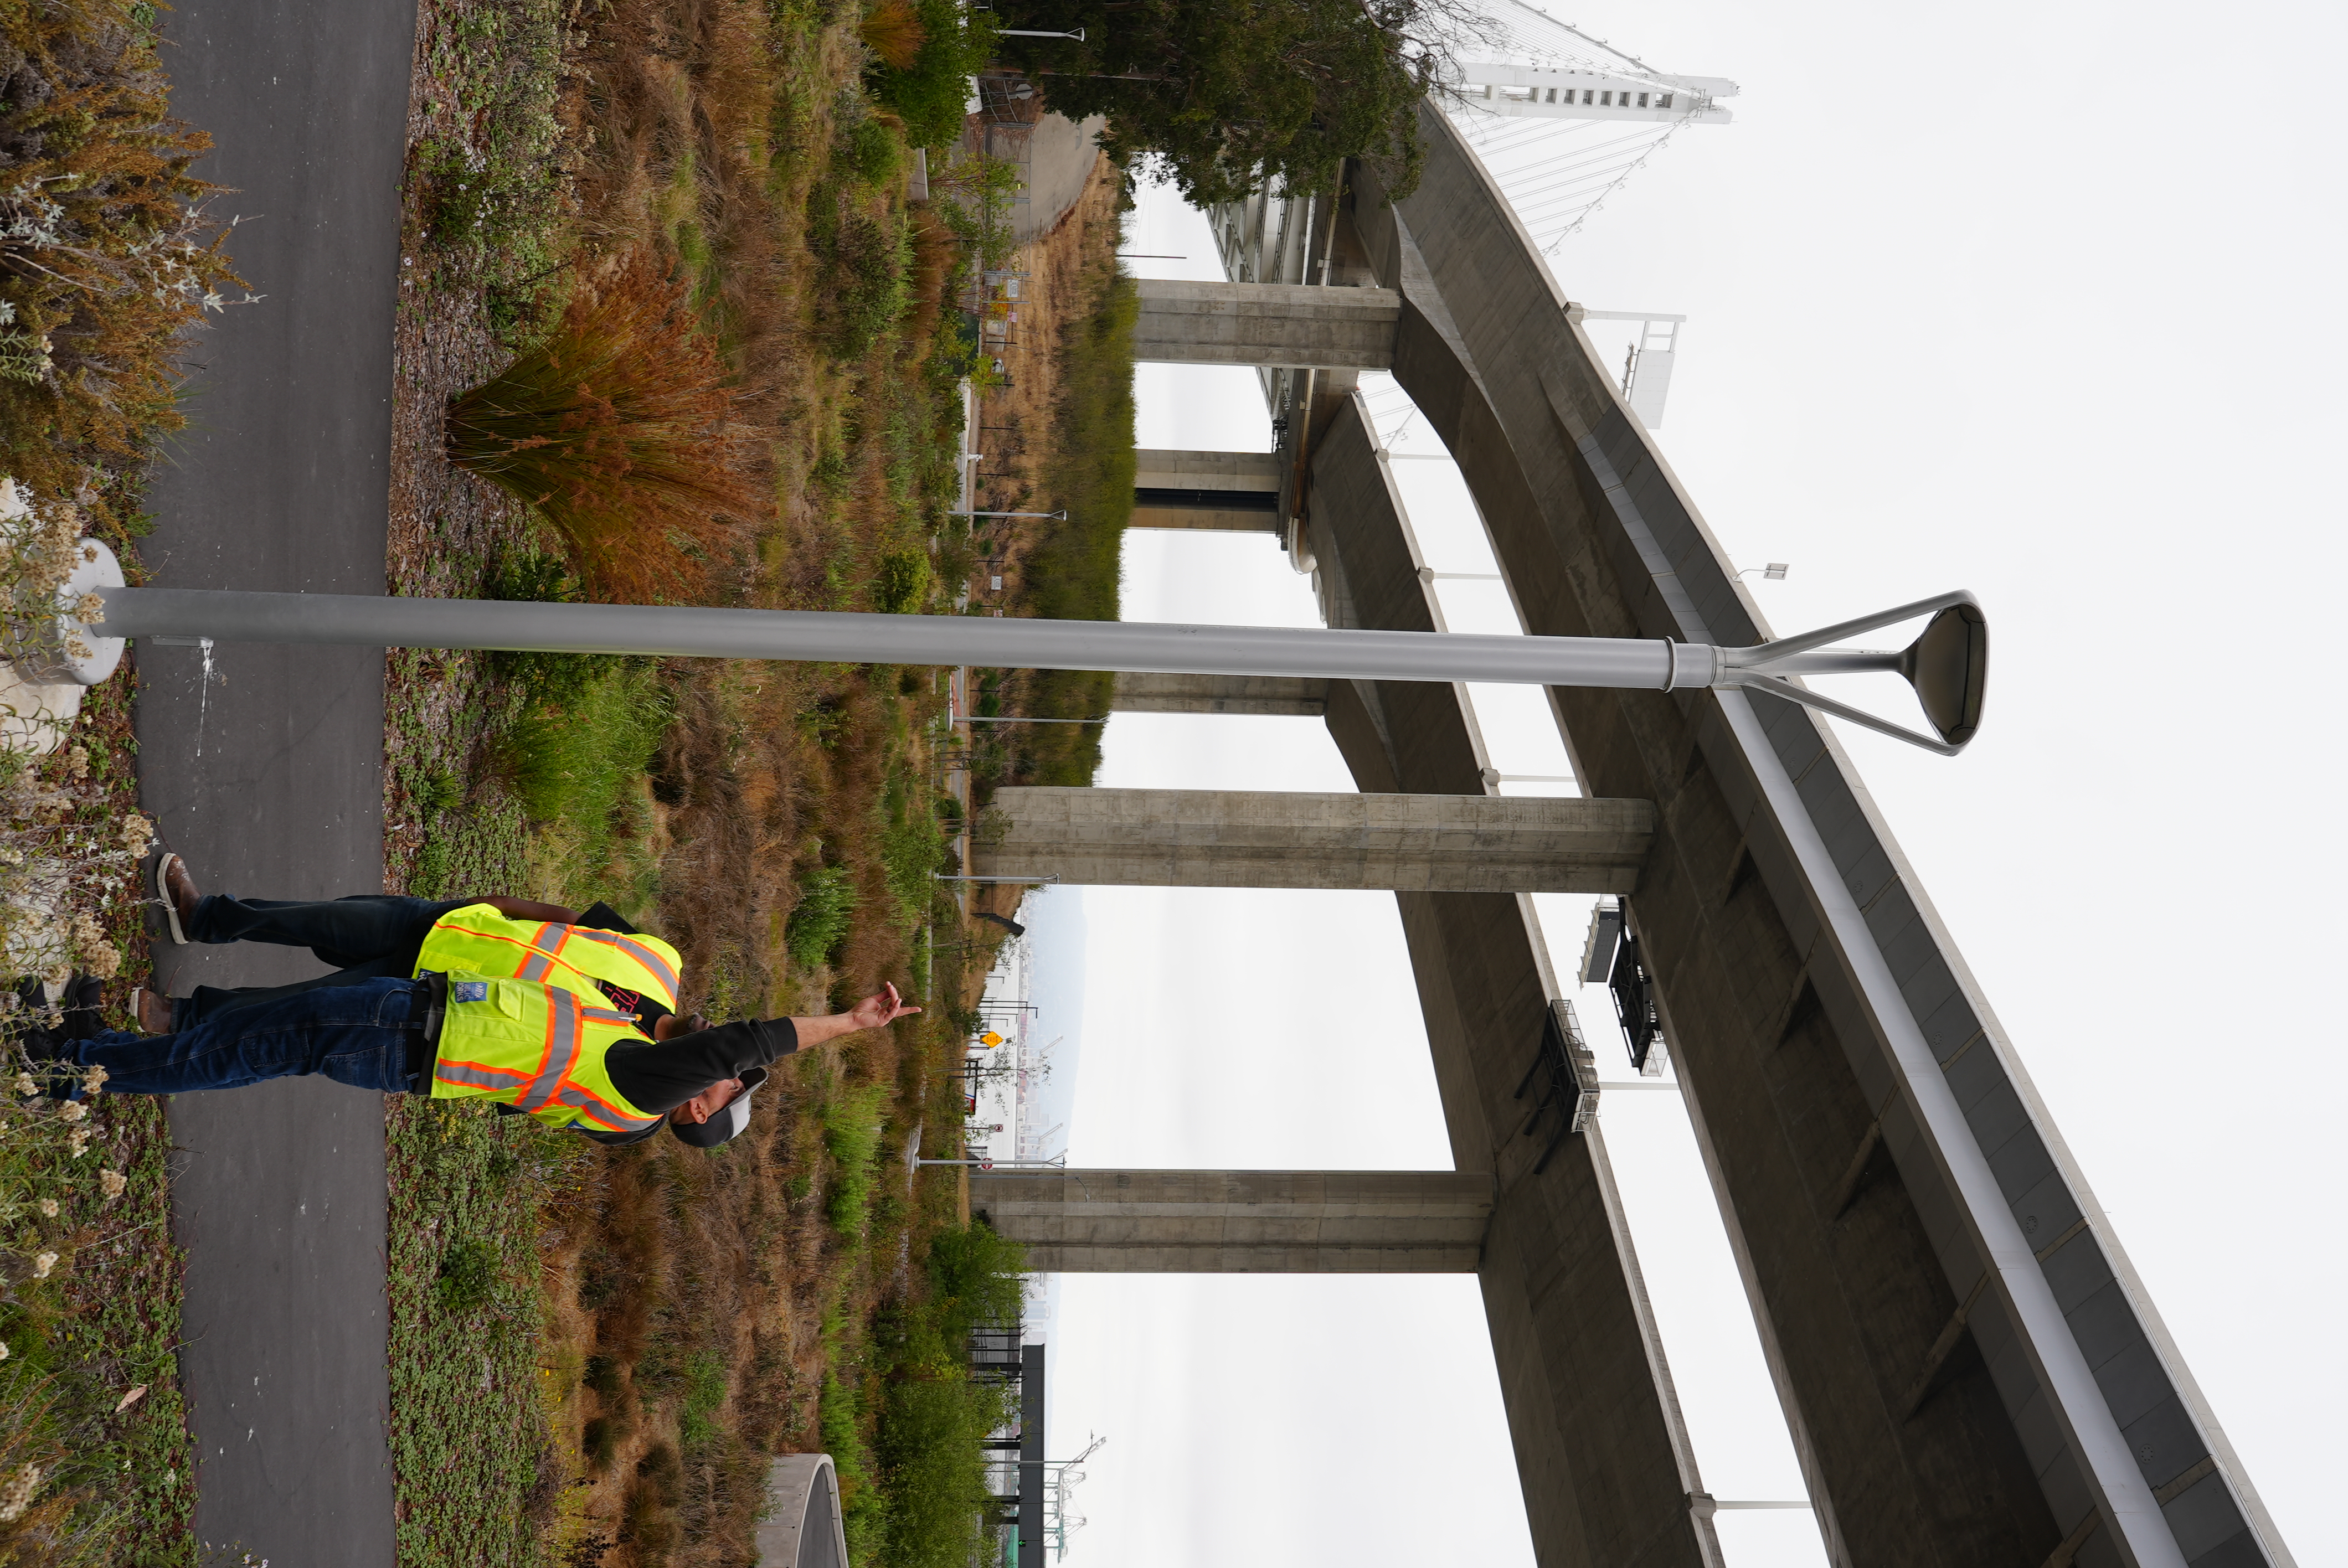
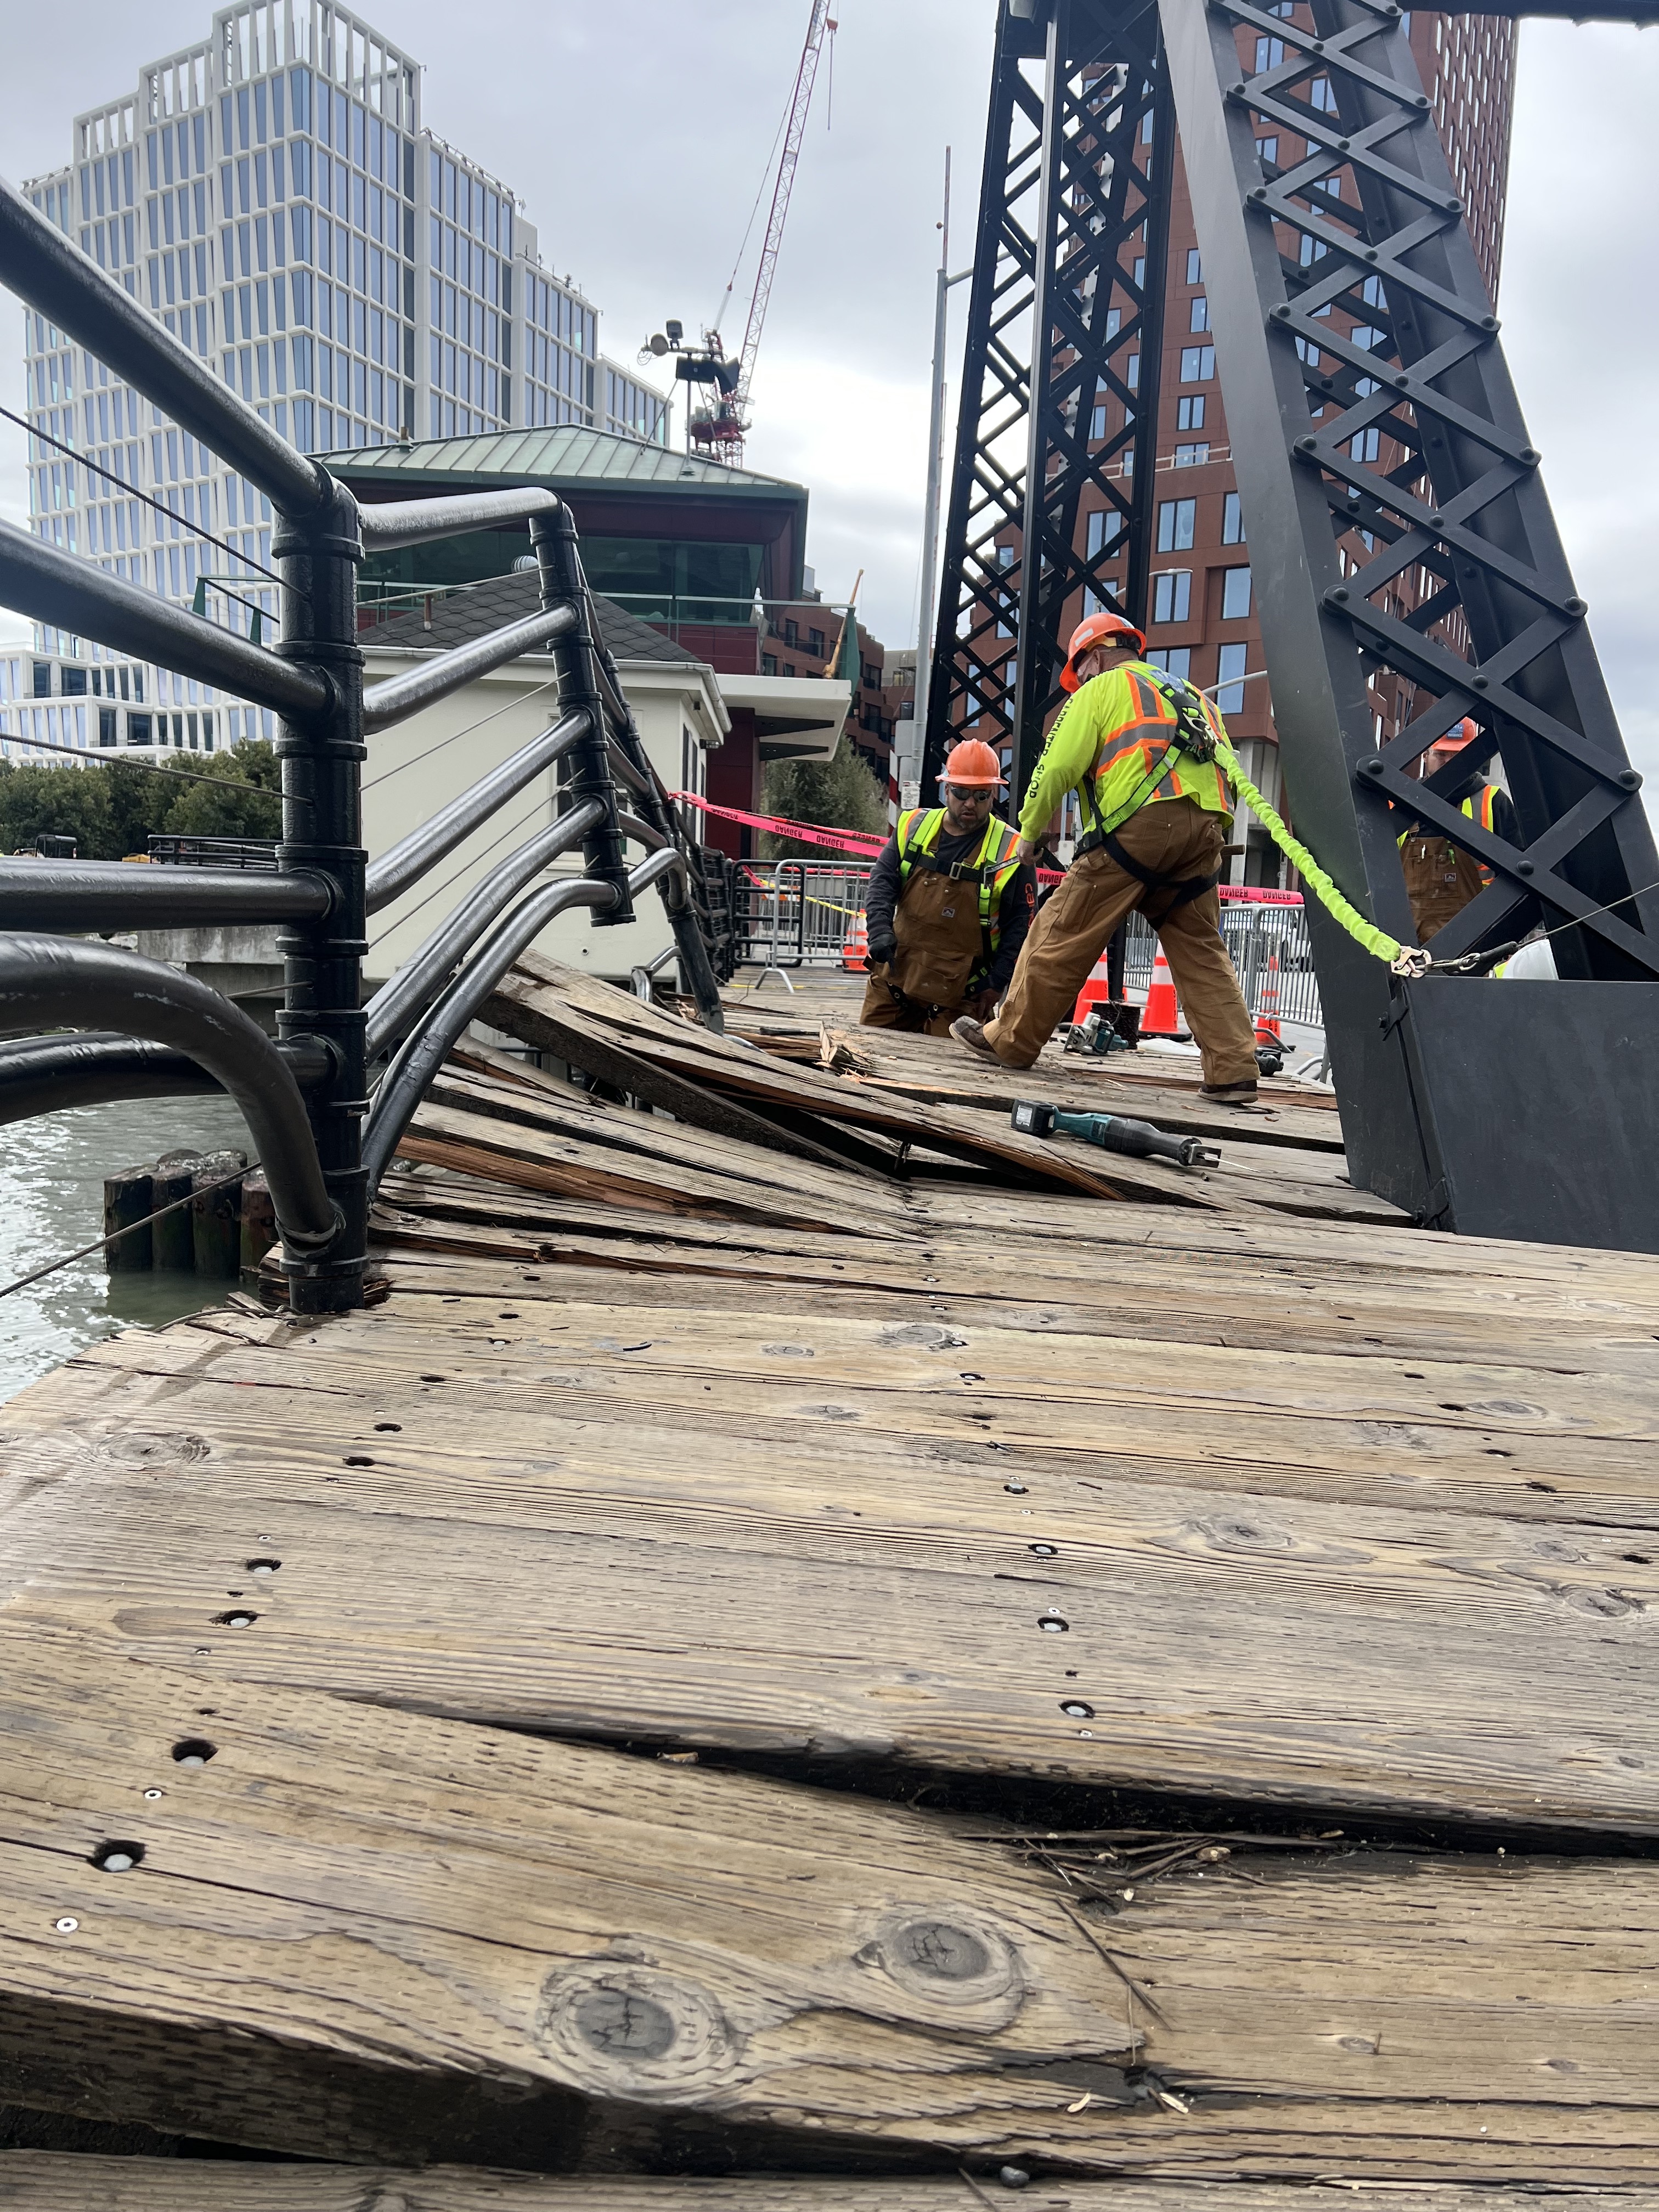
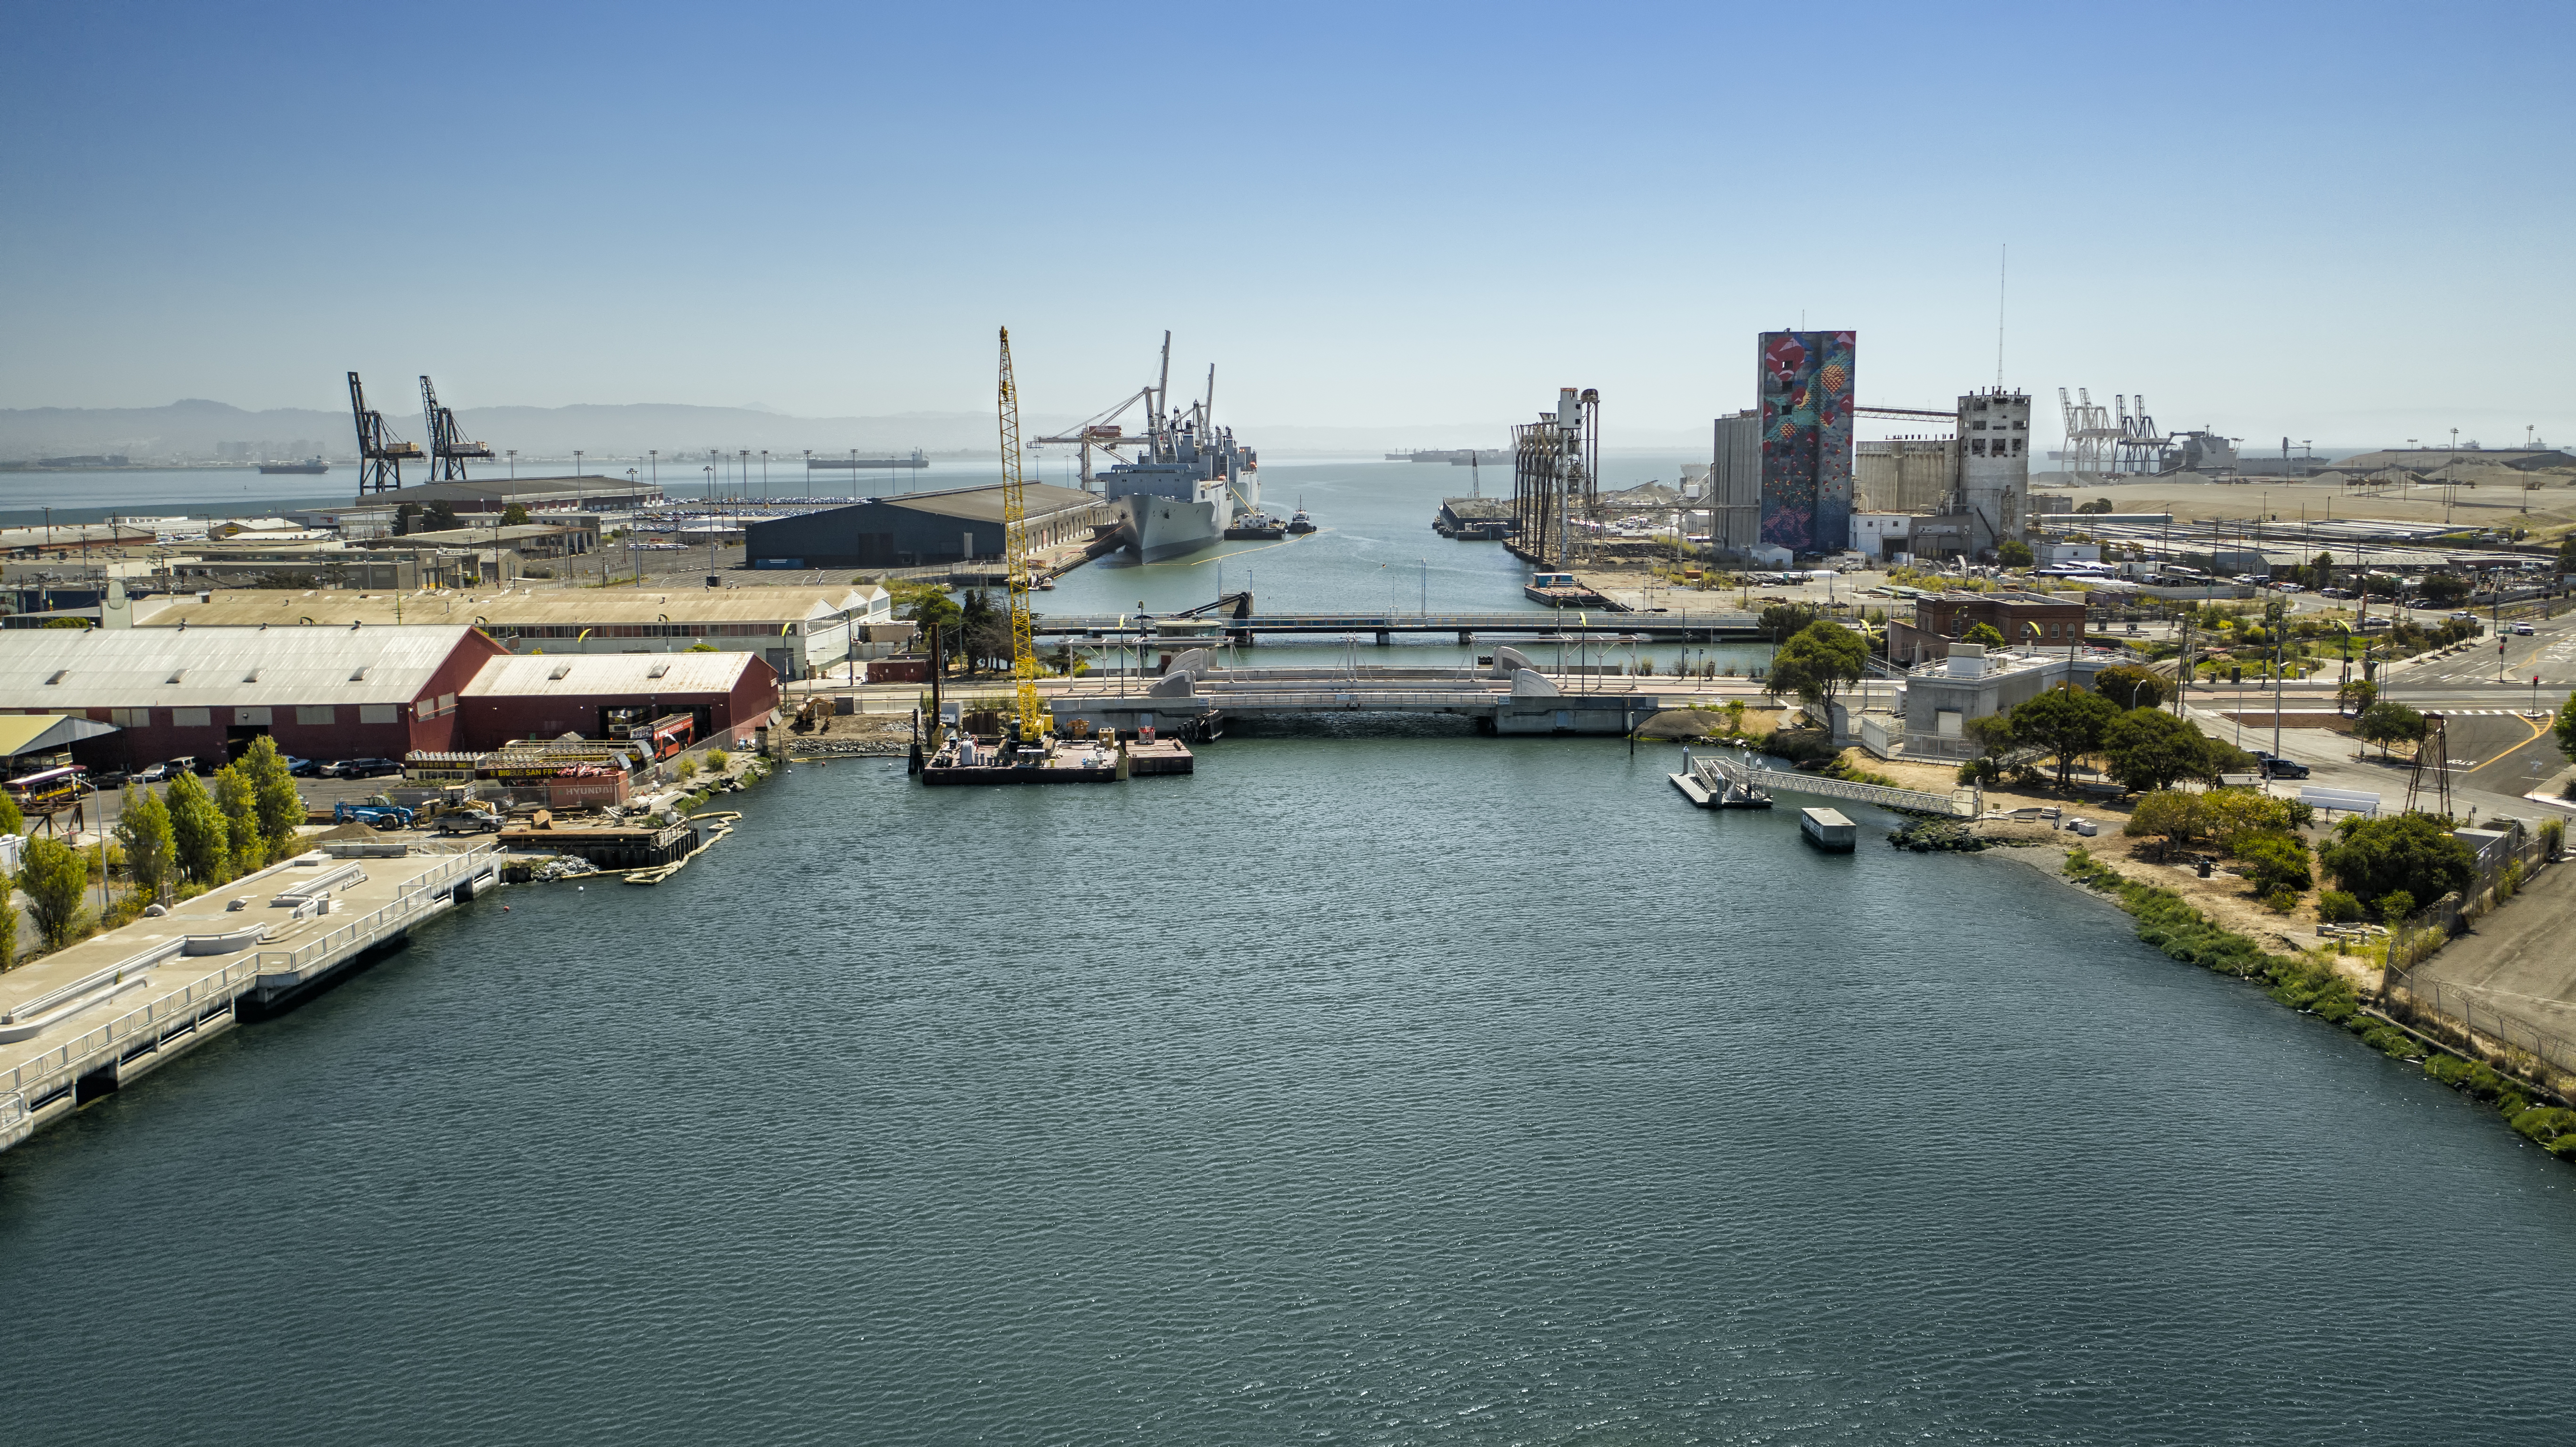
Islais Creek Bridge
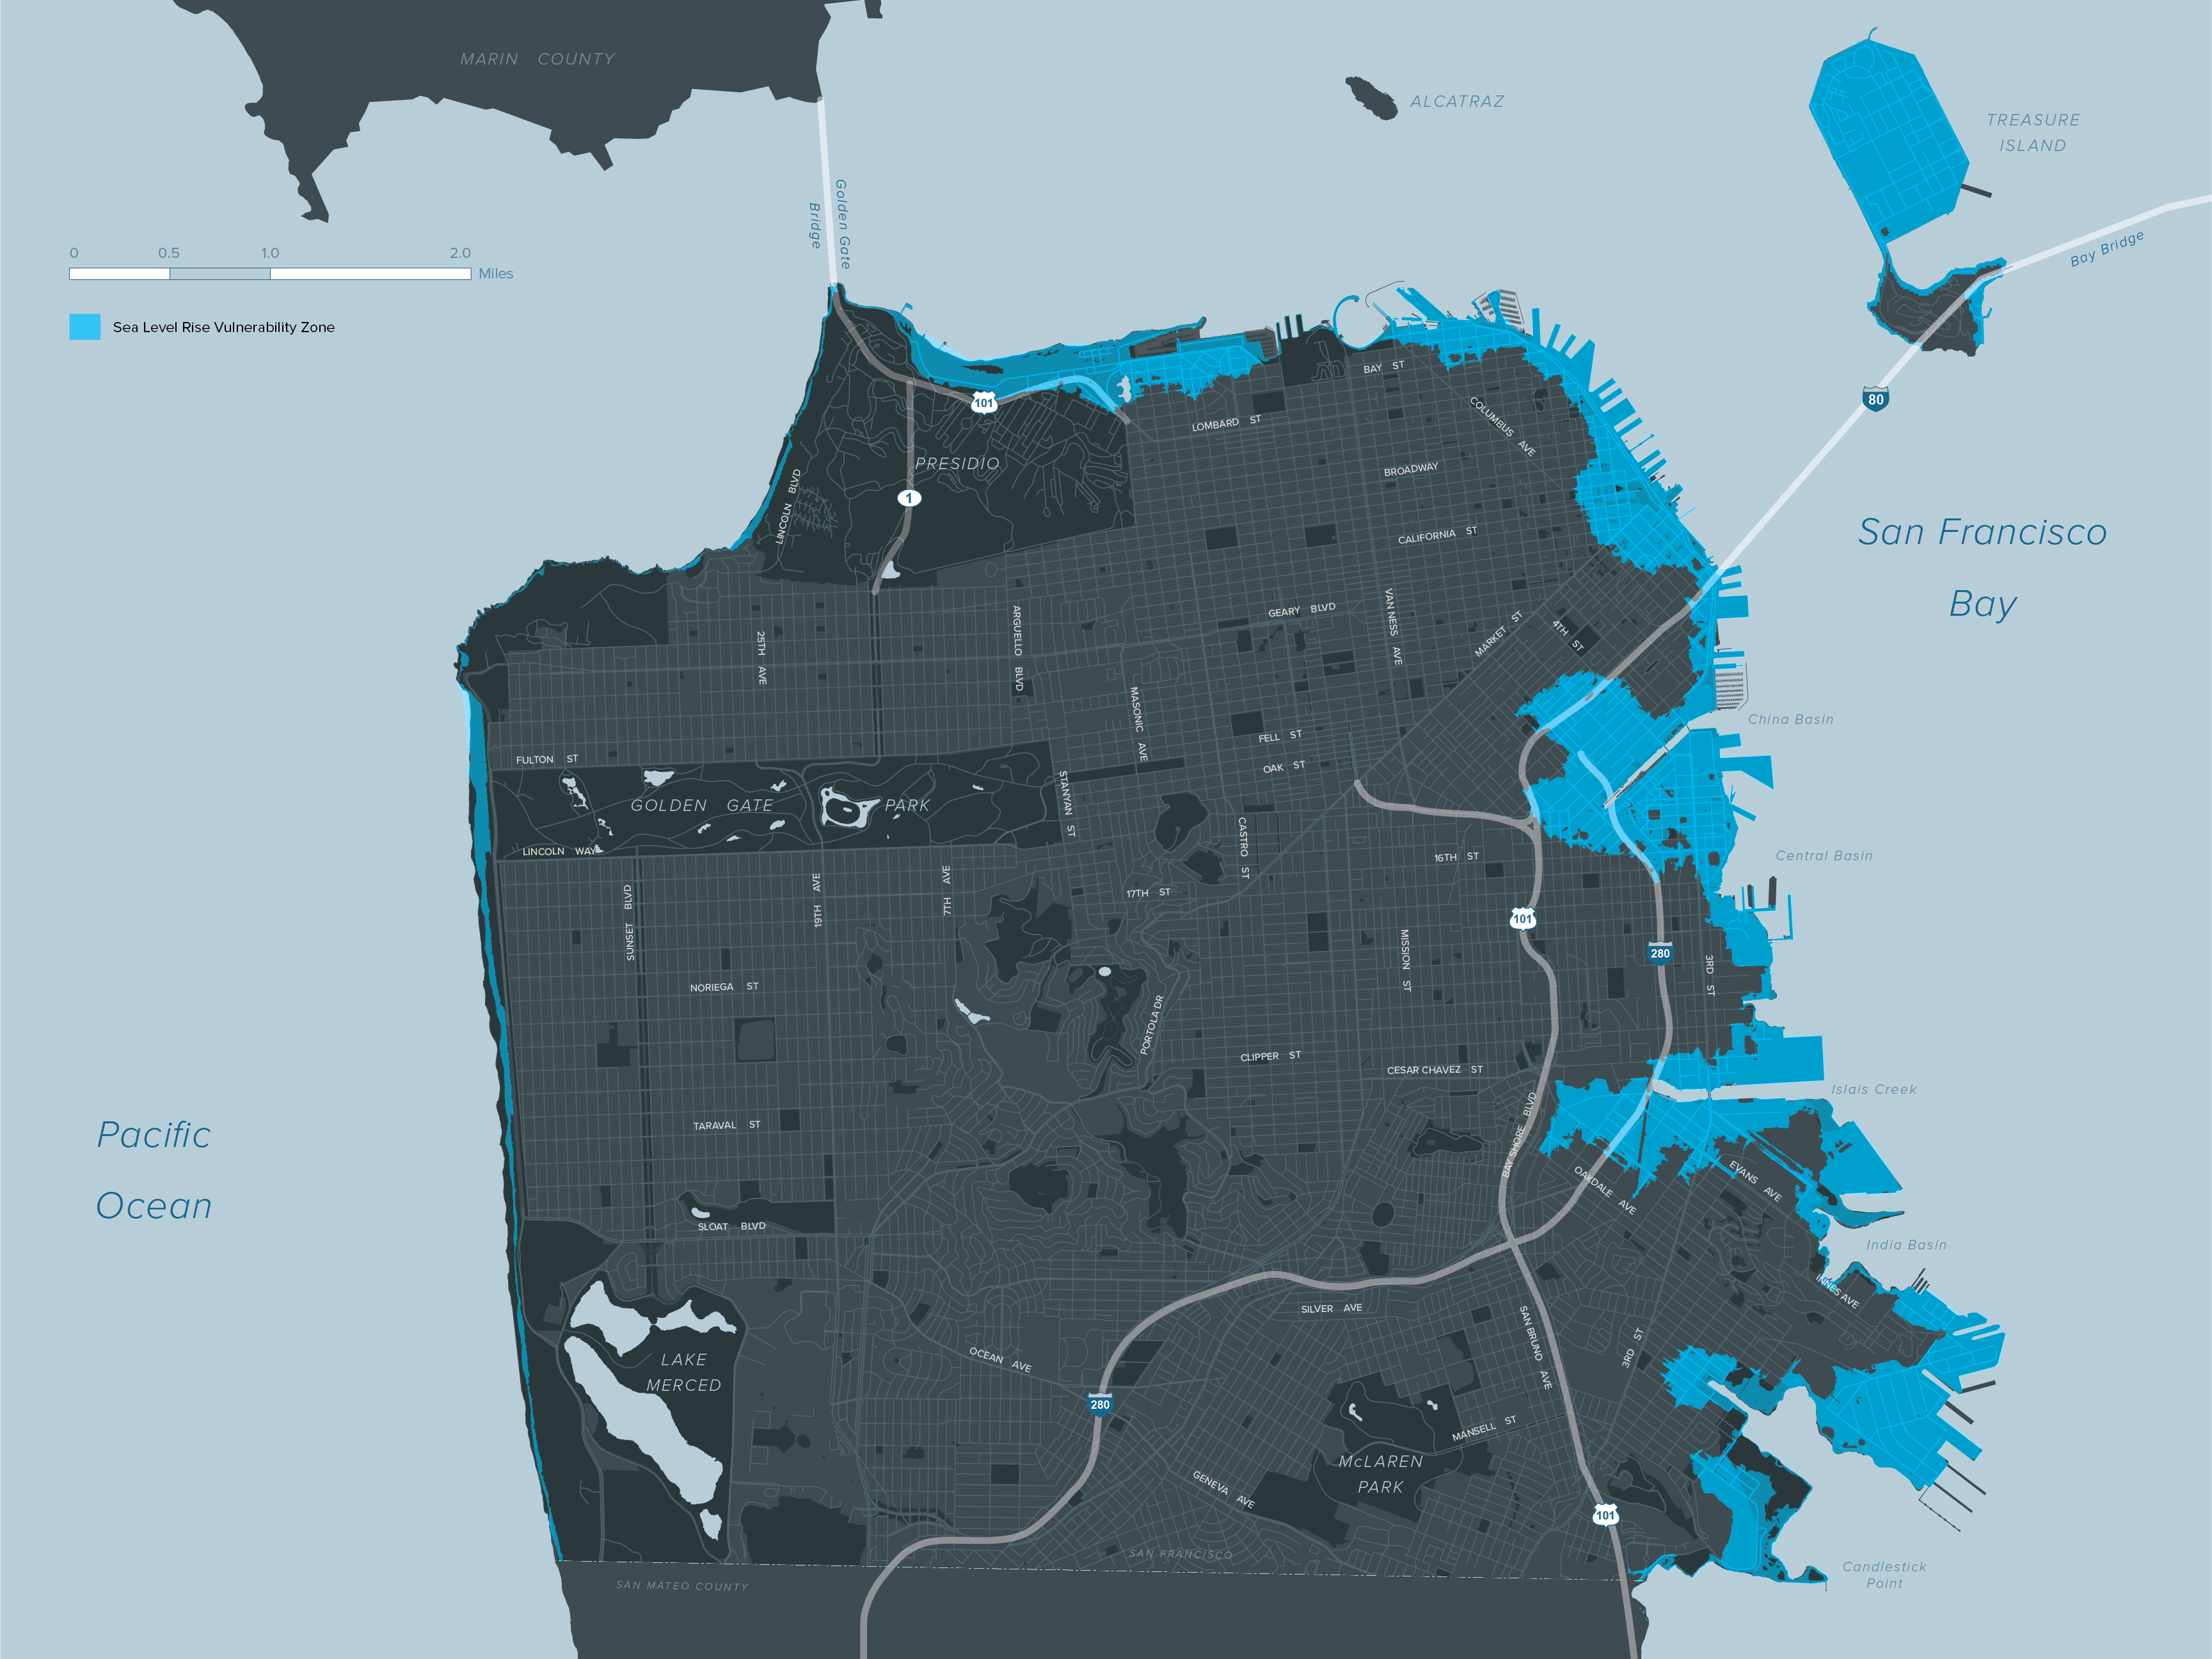
Sea Level Rise and Flooding
San Francisco faces coastal flood risks today that will increase as sea level and groundwater rises and extreme storms become more frequent. Historic buildings, small businesses, popular attractions, open spaces, and critical services such as BART, Muni, and the wastewater system are all vulnerable. To defend against these flood risks, San Francisco is working to adapt the shoreline, while also strengthening the waterfront for the risk of a major earthquake. By working with the US Army Corps of Engineers, the City has a once-in-a-generation opportunity to defend itself from future floods and earthquakes, improve and rejuvenate the waterfront, enhance the connection to the San Francisco Bay and nature, and bring benefits such as more open space, enhanced mobility, safety, and jobs to residents, commuters, and visitors. This program and other efforts are discussed below.
Sea Level Rise Guidance
San Franisco has been a leader in planning for sea level rise through its Sea Level Rise Guidance for Capital Planning, which was adopted in 2014 and updated in 2020. This Guidance is currently being updated to align with new sea level rise science and guidance from the State. For any capital project greater than $5 million and located in the City’s Sea Level Rise Vulnerability Zone, a project manager must complete a checklist demonstrating that the project has been analyzed for sea level rise vulnerability and risk and appropriate adaptation measures have been incorporated.
San Francisco Waterfront Coastal Flood Study (Flood Study)
Adapting to sea level rise requires going beyond individual assets to include entire areas of the shoreline. The Port of San Francisco’s Waterfront Resilience Program works to ensure the waterfront, and its critical regional and citywide assets, are resilient to hazards while also increasing waterfront accessibility. The U.S. Army Corps of Engineers (USACE) and the Port have partnered on the San Francisco Waterfront Coastal Flood Study (Flood Study) to study the costs and benefits of building coastal flood defense infrastructure and companion inland drainage infrastructure along the San Francisco shoreline from Heron’s Head to Fisherman’s Wharf. The USACE Draft Plan released in early 2024 will inform subsequent stages of funding and design in order to develop targeted construction projects. The proposed solutions are estimated to cost $13.5 billion in 2024 dollars. If it is approved by Congress, the federal government would pay 65% of the cost, leaving the remaining 35% or $4.7 billion to come from local and state sources.
Securing the local and state matching funds will require a concerted citywide effort. In 2017, Mayor Edwin Lee convened a Seawall Finance Working Group led by the Office of Resilience and Capital Panning with support from the Port, City finance experts, and private sector leaders, to generate a set of potential revenue measures, including a $425 million Seawall Earthquake Safety Bond passed by voters in 2018. The recommendations also prompted City advocacy for urban waterfront resilience funding, which was included in State Proposition 4, which voters approved in the November 2024 election.
New sources of funding will be required to unlock the federal funding available through USACE after Congress authorizes the project. The 2028 San Francisco G.O. Bond schedule includes $200 million from the 2028 Waterfront and Climate Safety Bond. The Port of San Francisco is pursuing a strategy to focus a significant portion of remaining Proposition A funding on projects that can qualify for local match credit. Even with these efforts, a new comprehensive funding strategy is needed to (1) develop the required local matching sources and (2) relieve the Port’s capital budget of the sole obligation to fund non-bond eligible expenses associated with the Waterfront Resilience Program.
Shoreline Adaptation Plan
Shoreline adaptation planning extends beyond the Port’s jurisdiction to the north and south. The City is continuing to pursue state and federal funding opportunities to bring necessary investments to Bayview Hunters Point that address future flooding and advance environmental justice. The Yosemite Slough Neighborhood Adaptation Plan will develop strategies to protect the slough and surrounding communities from sea level rise through the end of the century. The project is designed to advance racial & social equity, cross-sector collaboration, and community capacity in planning for multiple climate risks.
San Francisco will also be developing a comprehensive Shoreline Adaptation Plan that addresses sea level rise as required by state legislation (SB 272). This will help ensure that all vulnerable segments of the shoreline are addressed in one plan. The plan will update past assessments with current science, such as groundwater rise risks, provide additional community engagement opportunities, and incorporate additional adaptation strategies tailored to local needs.
Ocean Beach
In San Francisco, the bay shoreline is generally more vulnerable to sea level rise due to its lower elevation than Ocean Beach, however, adaptations remain necessary to protect Ocean Beach from rising sea levels. A number of City, state, and federal agencies are working to adapt Ocean Beach to climate change and coastal erosion. Erosion is expected to worsen with sea level rise, further threatening roads and sewers, and causing the beach to narrow. The Ocean Beach Climate Adaptation Project will change the roadway south of Sloat Boulevard, modify public access, alter coastal management, protect critical infrastructure, and prepare Ocean Beach for a changing climate. Agencies are working together with beach users and community members to adapt to these coastal changes and protect critical infrastructure while supporting open space, recreation, and natural habitat. The cost of the Ocean Beach Climate Adaptation Project (south of Sloat) is approximately $130 million through FY2035. Costs beyond the 10-year horizon are currently unknown.
Projects and plans for Ocean Beach north of Sloat Boulevard include work to identify funding, partnerships, and community stewardship to implement nature-based solutions to restore dunes and reduce erosion. The Ocean Beach Master Plan and San Francisco Estuary Institute (SFEI) Dune Study call for sand replenishment between Santiago Street and Sloat Boulevard to reduce coastal erosion. The Great Highway Pilot Project will help determine how the Great Highway will be used in the future as a recreational space.
Extreme Precipitation
San Francisco is also looking at stormwater flooding. With funding from a number of departments, the SFPUC completed the Extreme Precipitation Study in conjunction with Pathways Climate Institute and Lawrence Berkeley National Laboratory (LBNL). The Study predicts future storms are likely to be more intense and severe as the climate warms. The combined sewer system cannot handle larger predicted storms, so future plans will need to include infrastructure adaptation measures to reduce flood risk. The City is also studying how flood policies and governance may need to change to better manage extreme precipitation.
Sea Level Rise Vulnerability Zone
Heat and Poor Air Quality
San Francisco is a historically temperate city with buildings and infrastructure developed for our cool coastal climate. As extreme heat and wildfire smoke events become more frequent and more extreme, this infrastructure is less able to protect vulnerable San Franciscans from health impacts. Extreme heat and poor air quality sit at the intersection of public health and the built environment and the ability of our buildings and infrastructure systems to protect against these hazards has a direct impact on health outcomes. Adaptation of buildings and infrastructure is critical for protecting the health and wellness of San Franciscans, and for ensuring continuity of operations during hazard events.
The Heat and Air Quality Resilience Project (HAQR) identifies, plans, and implements medium-to-long-term extreme heat and wildfire smoke strategies. It focuses on the resilience of disproportionately impacted frontline and BIPOC communities. This is achieved by creating strategies between the City and community based organizations to advance equity.
A particular focus of HAQR is to support extreme heat and air quality adaptations to the City’s public and private building stock. HAQR elevates extreme heat and wildfire smoke resilience as a building rehabilitation goal, amplifies policies with heat and air quality resilience co-benefits, identifies new funding streams, and puts together best practices.
HAQR also supports the expansion of green infrastructure city-wide by targeting investments to address urban heat islands and neighborhoods with heat-related health burdens. These nature-based solutions will increase equitable outcomes for neighborhood residents and align with the CAP’s residential carbon sequestration objectives. The HAQR Green Infrastructure Priority Zones show areas where future projects are likely to have the biggest benefit.
Achieving racial equity would mean living in a world where race is no longer a factor in the distribution of opportunity. The 10-Year Capital Plan strives to fund projects to promote equity in the services delivered by the City’s facilities and infrastructure. This is reflected in the funding principles of this Plan and department efforts that inform capital investment priorities (Funding Principle 2: Protects Life Safety and Enhances Resilience, Including Racial Equity).
Department Equity Plans include the Planning Department's Racial and Social Equity Action Plan, Recreation and Park Department’s Equity Zone metrics, Muni Service Equity Strategy, and Department of Public Health’s Community Health Needs Assessment.
Planning Department Efforts
The San Francisco Planning Department plays a key role in reducing racial and social inequities across the city through proactive policies and community-led initiatives. A major component of this includes zoning changes to add an additional 82,000 units of housing and over 300,000 residents over the next eight years, increasing housing affordability for low- and middle-income households. These zoning changes focus on neighborhoods with concentrations of resources to support positive economic, educational, and health outcomes for more families. The additional units and households may bring neighborhood benefits as well as new infrastructure investment needs. The Economic and Neighborhood Development, Affordable Housing,Infrastructure + Streetsand Transportation chapters provide additional information on these changes and how they will be funded.
Another Planning Department effort is the Racial and Social Equity Action Plan. The Action Plan provides tools and guidelines to apply an equity perspective to the department’s budgeting, planning, and project reviews. The goal of this approach is to ensure that investments in infrastructure, facilities, and services are prioritized to meet the needs of historically marginalized communities, with a focus on equitable access to cultural resources, economic opportunities, and affordable housing.
The Planning Department also developed the City’s first Environmental Justice (EJ) Element of the General Plan through a collaborative process with community-based organizations. This framework proposes policies that ensure the residents of communities that face the highest burden from historic chronic patterns of disinvestment are centered in receiving new services and amenities during the future development of the city. The EJ Communities Map uses a variety of environmental and socioeconomic information to determine where residents face the top one-third of cumulative environmental and socioeconomic burdens across the City. The EJ Communities include areas of Bayview Hunters Point, Chinatown, Excelsior, Japantown, Mission, Ocean View-Merced Heights-Ingleside, Outer Mission, Potrero Hill, SoMa, Tenderloin, Treasure Island, Visitacion Valley, and Western Addition.
Office of Resilience and Capital Planning (ORCP) Efforts
ORCP evaluates capital budget requests for their impact on climate and equity. Equity-focused projects are either located within Environmental Justice (EJ) communities or serve vulnerable populations directly. Many of these projects involve extensive community engagement to ensure their design aligns with local needs. Recent examples of projects strongly connected to equity goals include the renovation and retrofitting of community health clinics, opening the new India Basin Park, connecting nearly 20,000 units of affordable housing to free broadband internet, delivering hundreds of new permanent supportive housing units, and beginning renovations of two of the City’s neighborhood cultural centers. In FY25, approximately 19% of the Capital Budget was dedicated to projects that advance equity.
In order to continue funding projects that contribute to a more equitable San Francisco, this Plan calls for significant investments in areas where racial disparities continue to be significant, including public health and affordable housing. More on the City’s efforts to address affordability can be found in the Affordable Housing Chapter and address health equity in the Health and Human Services Chapter.
Building Our Future refers to emerging resilience needs that will have a large impact on San Francisco’s infrastructure. These needs do not neatly fit into the Capital Plan’s service areas, often span beyond the 10-year planning horizon, and are difficult to define in terms of scope and cost.
Most of the long-term resilience projects come from citywide planning and coordination efforts including the Hazards and Climate Resilience Plan, Climate Action Plan, ClimateSF, Earthquake Safety Implementation Program, and the Housing and Environmental Justice Elements of the City’s General Plan. In addition to sections on climate and earthquake safety, this chapter starts with efforts to address racial and social equity.
As a waterfront city located between two major fault lines, San Francisco must continue to plan for the next disaster even as we address long standing systemic challenges and disparities. Resilience is a constant process of preparing and protecting communities, buildings, and infrastructure. We must prepare for future shocks while addressing the ongoing stressors of unaffordability, inequity, and aging infrastructure.
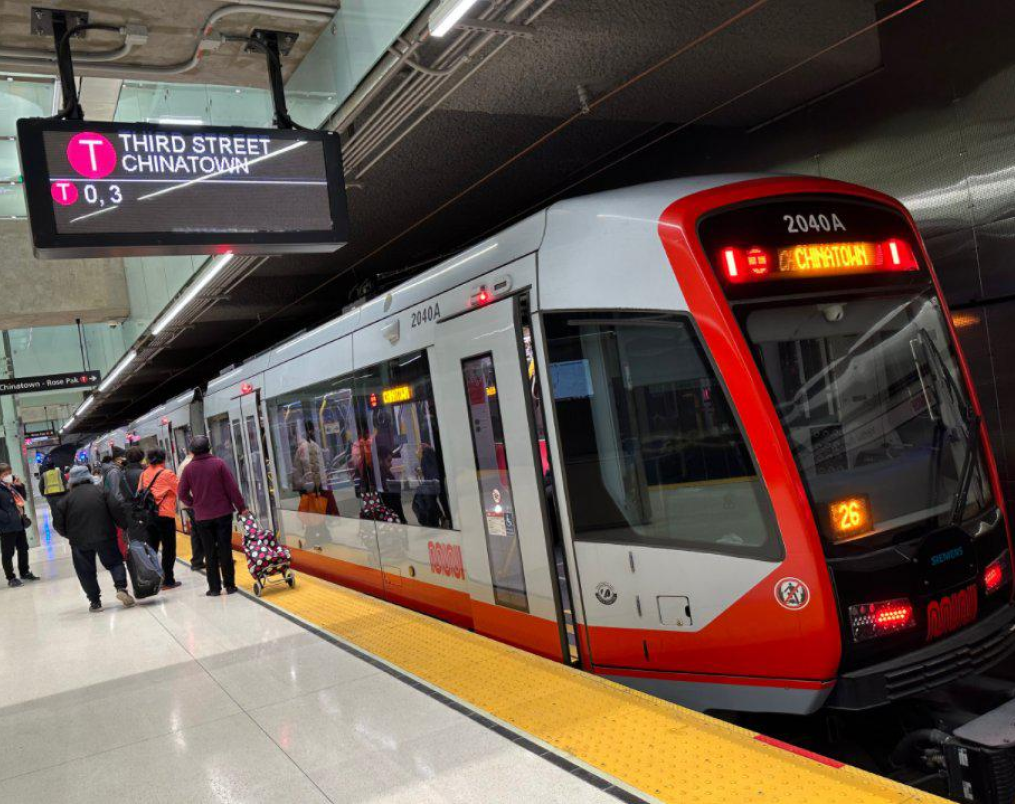
Completed the Muni-Metro T Third Line through SoMa, Union Square, and Chinatown. The T Third started its historic new route, providing a direct Metro connection between Sunnydale and Chinatown-Rose Pak Station. This project included construction of the Mission Bay Loop on Third Street between 19th and 20th Streets, which allows SFMTA to operate higher frequency service on the northern portion of the T-line.
Completed the first phase of the 16th Street Improvement Project from Potrero to Third Street, which made community-informed improvements including transit lanes, new sidewalk bulb-outs, new ADA ramps at each intersection, new streetlights, 50 new trees along 16th Street, and new sewer and water pipes.
Completed the final phase of the L Taraval Improvement Project, which made crossings safer for people walking, increased accessibility, and improved transit reliability and safety for our customers.
Improved the speed and reliability of popular bus lines by creating permanent transit-only lanes.
Completed Quick Build projects on key corridors, like Williams Avenue, Townsend Street, Golden Gate Avenue, Folsom Street, and Leavenworth Street — using tools like lane reductions, crosswalk upgrades and daylighting to slow down vehicle speeds and increase visibility, safety and comfort for people walking.
Grew the city’s bike network to 472 miles by increasing connectivity between many of San Francisco’s neighborhoods.
Activated new traffic signals at 16 intersections and implemented traffic signal upgrades at 22 intersections.
San Francisco County Transportation Authority
Completed construction of the Southgate Road Realignment from Yerba Buena Island to Treasure Island.
Broke ground on the Yerba Buena Island West Side Bridges Retrofit Project.
Metropolitan Transportation Commission (MTC) awarded $750,000 to the San Francisco Recreation and Parks Department to support the Visitacion Avenue Pedestrian and Bicycle Safety Improvement Project.
The U.S. Environmental Protection Agency awarded the Treasure Island Mobility Management Agency (TIMMA) a $20 million grant for Treasure Island Connects program. The program will improve environmental conditions and help close equity gaps for Treasure Island residents, employees, and visitors by expanding clean public transportation resources serving the area.
San Francisco International Airport
Completed the Harvey Milk Terminal 1, which received LEED Platinum certification and includes a new north check-in lobby, a new mezzanine-level security checkpoint, two additional aircraft gates, five new concessions, and a new connecting walkway that links all SFO terminals post-security.
Completed the Taxiway D&T Reconstruction project ahead of schedule. This project realigned the taxiways to address existing non-standard taxiway geometry and relocated the fuel vault.
Improved accessibility at Blue Heron Lake (formerly Stow Lake) perimeter path, Union Square stairs, Louis Sutter Playground trails and restroom, Harding Park parking lot, and the Gardens of Golden Gate Park’s Botanical Garden Bookstore.
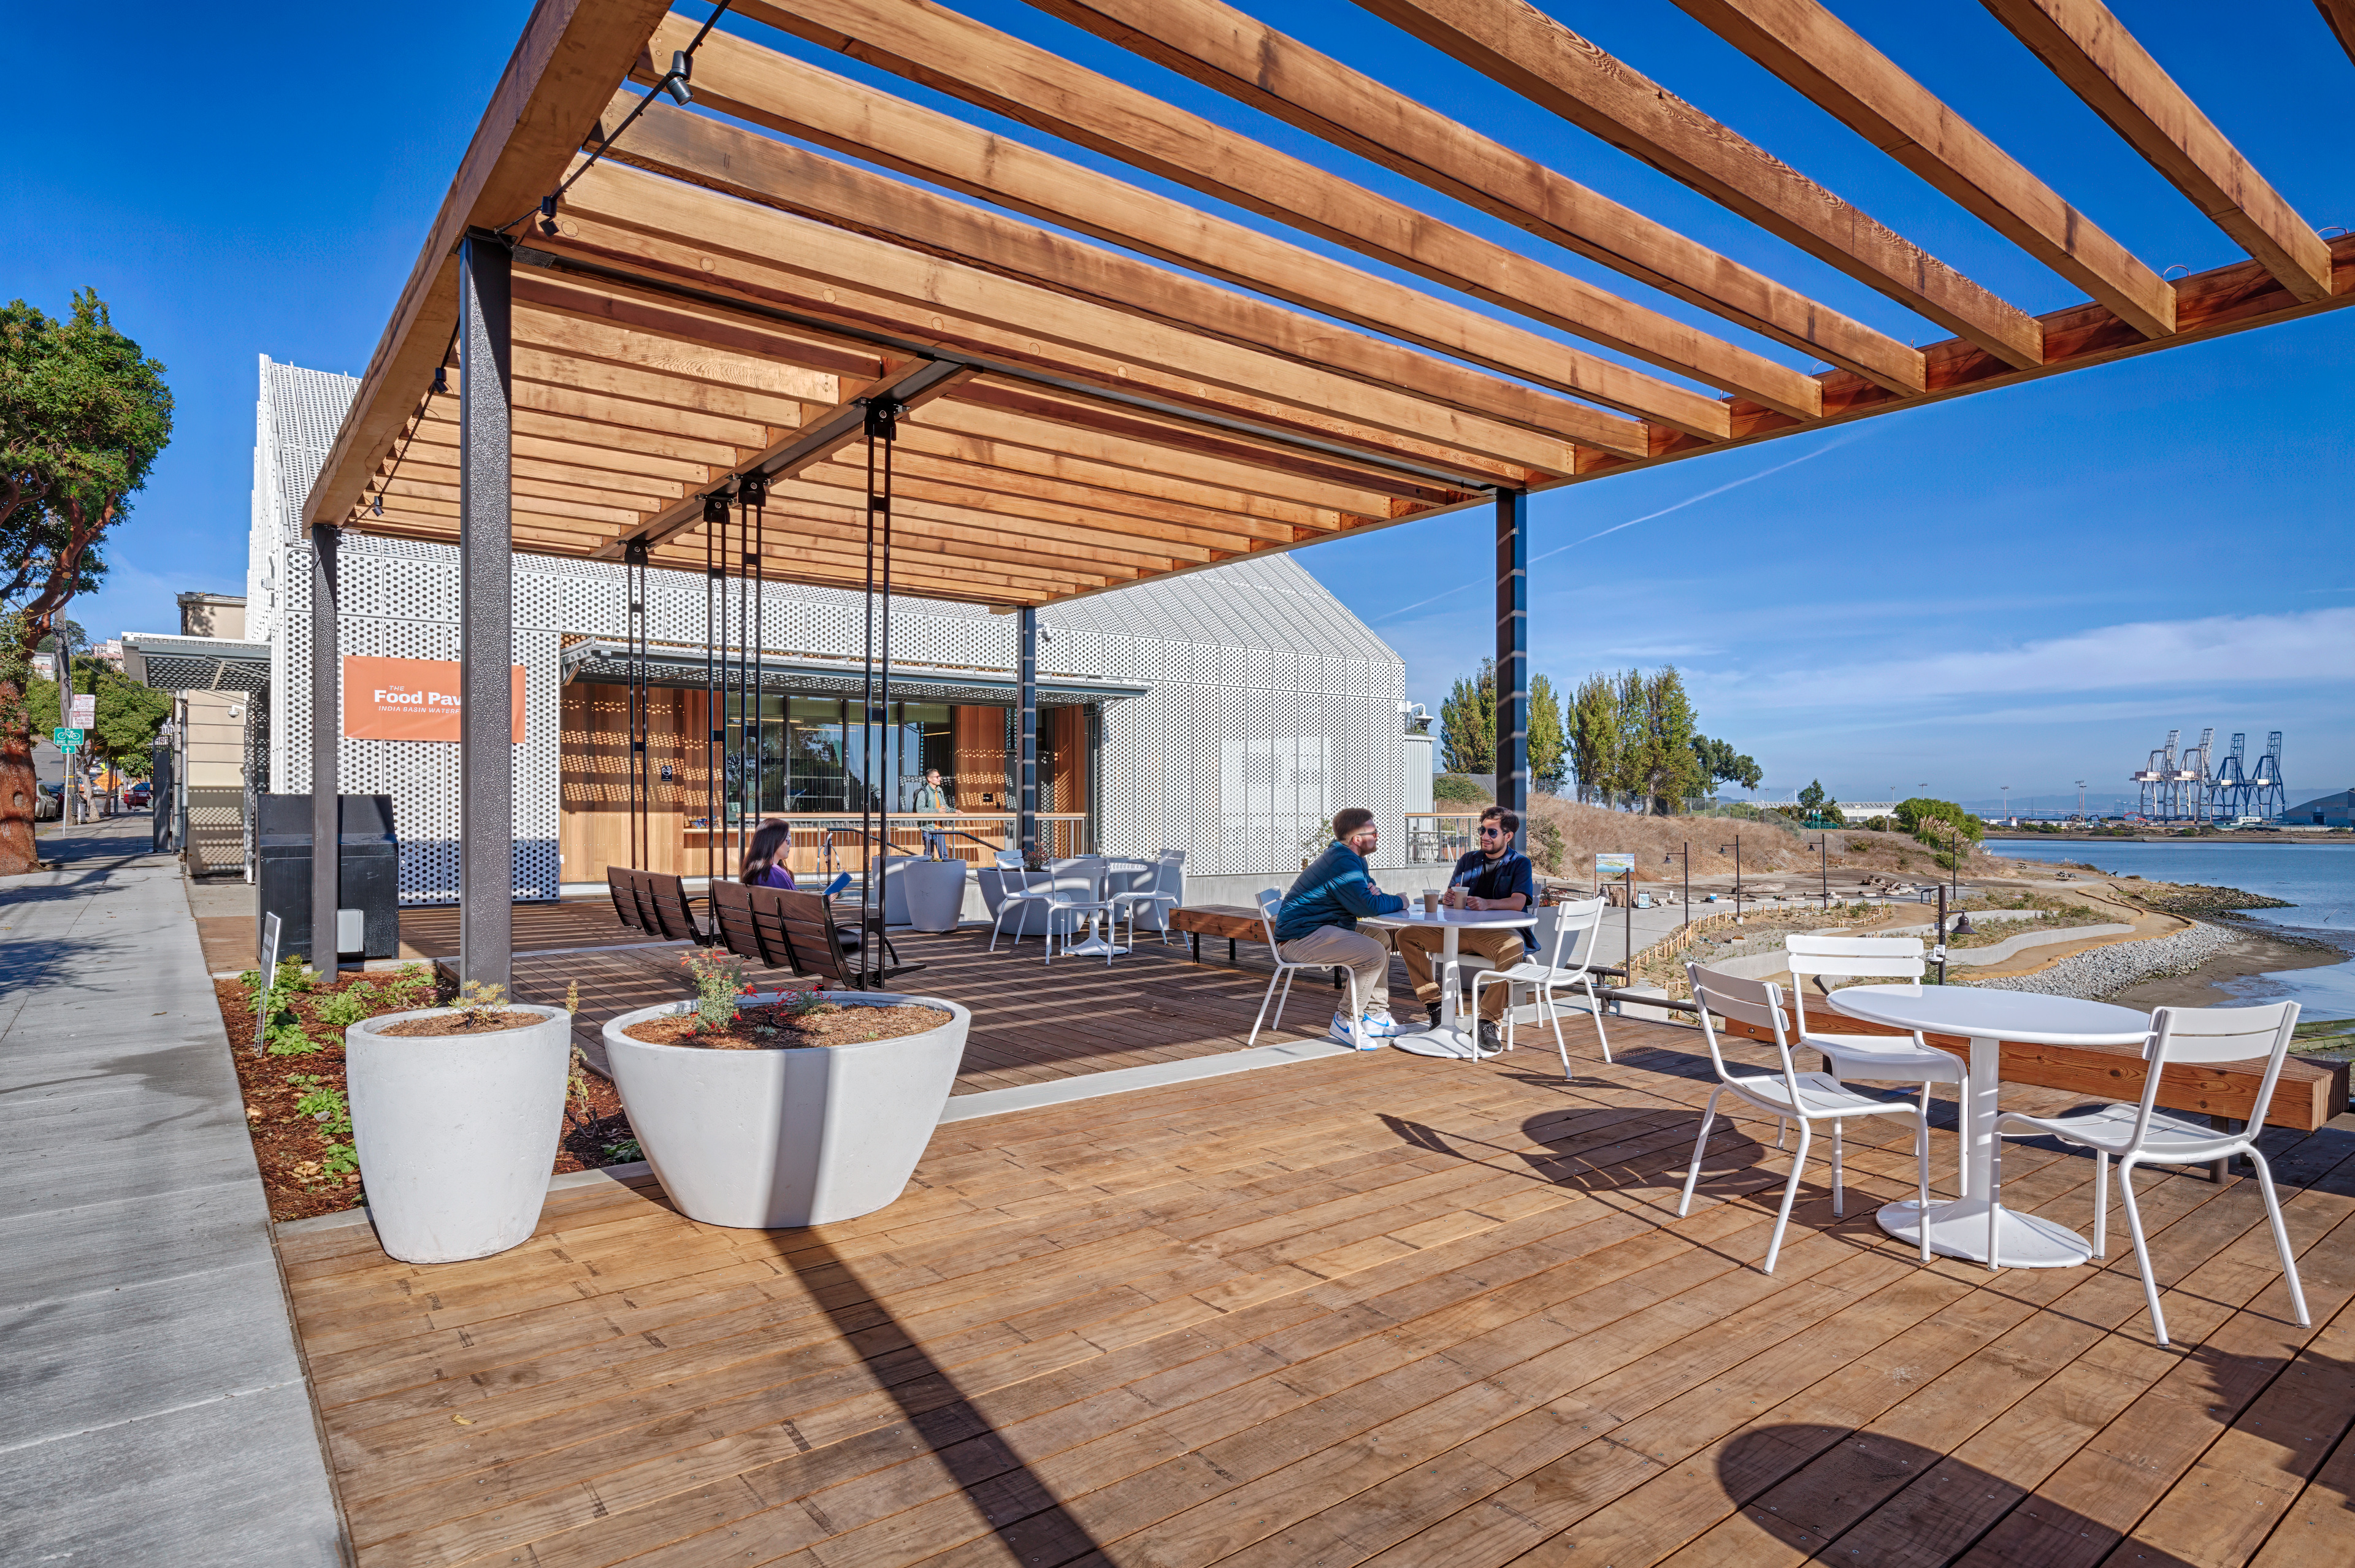
Completed Phase 2 at India Basin Waterfront Park with the park creation at 900 Innes, a former industrial waterfront property, and completely renovated Fillmore Turk Mini Park with a community-driven design.
Completed renovations at neighborhood parks, including a full renovation at Esprit with the addition of a new dedicated dog play area and flexible exercise stations, replaced the Crocker Amazon soccer fields, added a restroom to Noe Valley Town Square, and lighting at Lafayette Park.
Transformed United Nations Plaza into a skate park and recreation hub featuring new amenities.
Broke ground on three major projects funded through the 2020 Health & Recovery Bond; Japantown Peace Plaza and the construction of two new recreation centers at Gene Friend and Herz Playground Recreation Center.
Completed acquisition of 240 6th street, the Gene Friend Recreation Center Extension.
Made significant progress on the Let’sPlaySF! Playground Programs with two more completed playgrounds at Herz Playground and Richmond Playground, and Stern Grove playground in construction.
Completed five improvement projects and started the last 2012 Improvements projects at our Citywide Parks, including Lake Merced Trail improvements, significant improvements in Golden Gate Park (GGP), including the much-lauded GGP Middle Lake Restoration, JFK Promenade, and a new gateway at 9th and Lincoln.
Broke ground on the Twin Peaks trails project.
Completed 35 deferred maintenance projects including court resurfacing, court repair, playing field rehabilitation, playground resurfacing, security and lighting, and gym floor resurfacing, four of which fall within Environmental Justice Communities.
Arts and Cultural Departments
Progressed the pre-action fire sprinkler system at the Asian Art Museum, including completed pipe replacement work, progressed generator installation, and achieved 85% construction on temper switch installation.
Completed roof repair work on the Fulton Street side of the Asian Art Museum, with continuing repair work on the Larkin Street and McAllister Street sides.
Completed programmatic and schematic design for the retrofit and renovation of the African American Art & Culture Complex and the Mission Cultural Center for Latino Arts.
Completed exterior SOMArts ADA Barrier Removal and Retaining Wall Project.
Restored and reinforced 27 projects within the Civic Art Collection across San Francisco.
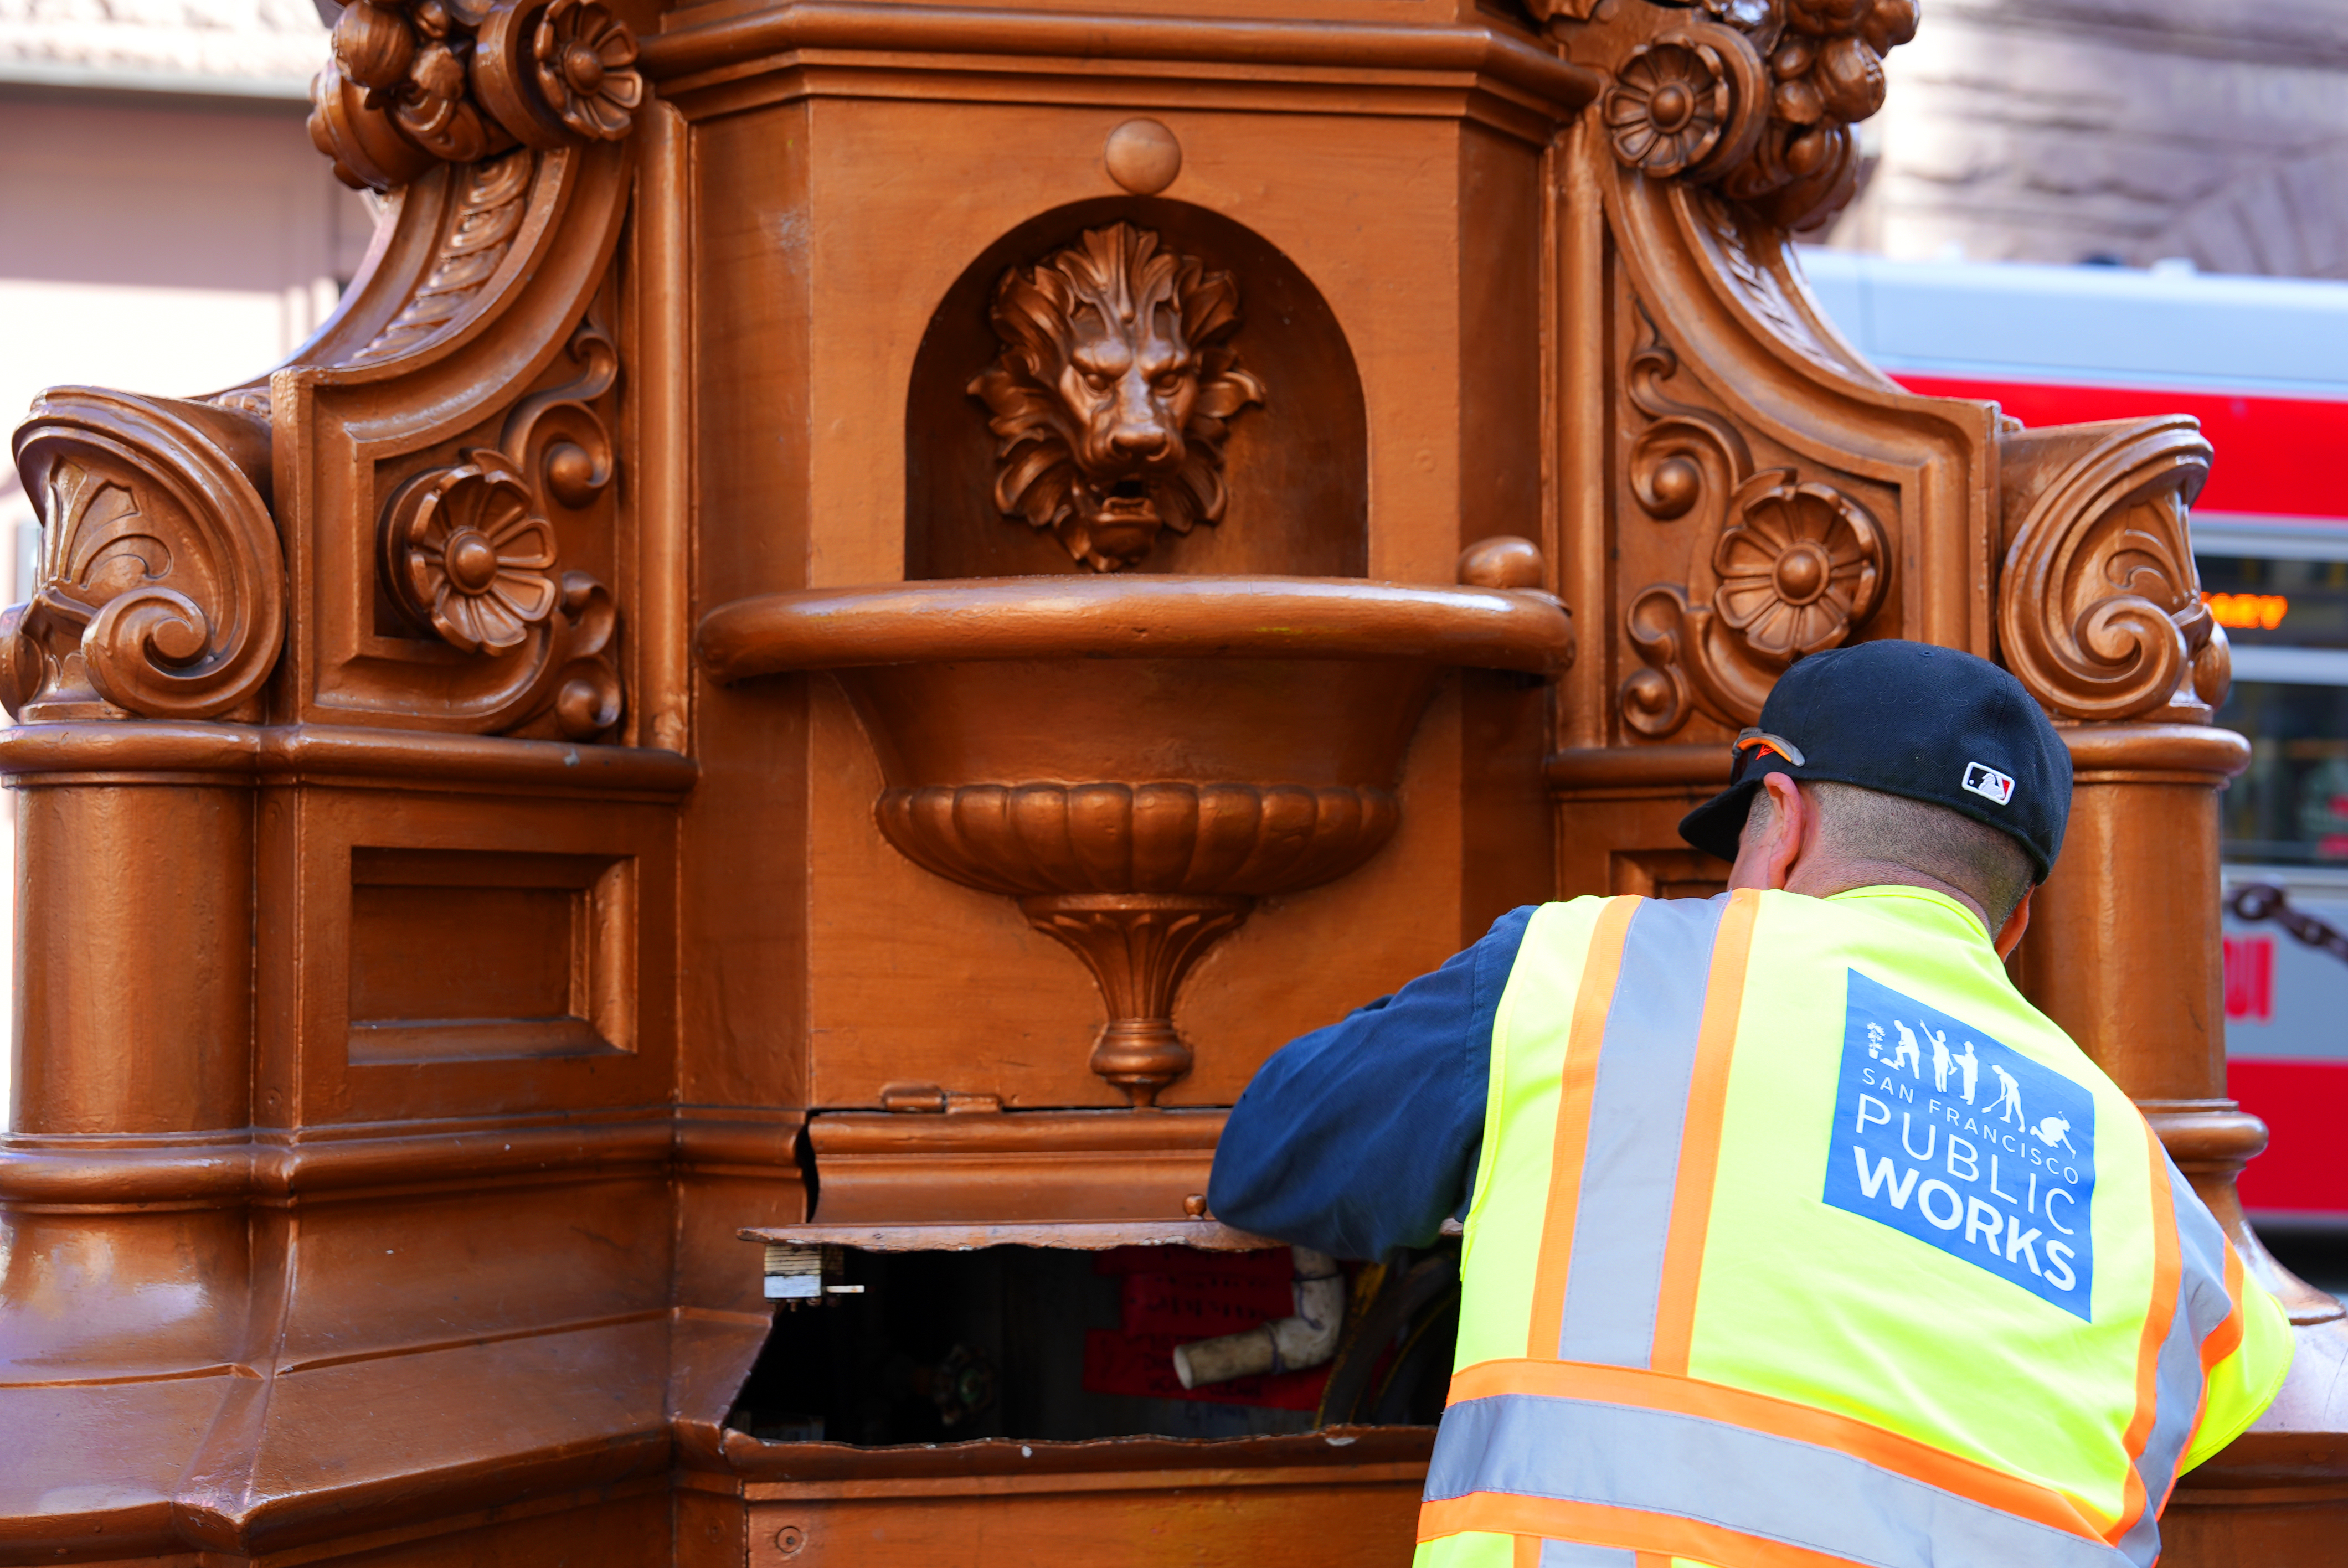
Restored Mechanics Monument and Lotta’s Fountain.
Completed engineering condition survey and mock-up for metal restoration and corrosion project for the De Young Museum tower.
Completed about 80% of masonry restoration for the Court of Honor at Legion of Honor.
Completed Opera House Seating Replacement and Improvement Project for ADA accessibility.
Completed Opera House Taxi Ramp Awning.
Educational Agencies
Completed award of Mission Branch Library Renovation Project. The $34 million renovation project is 30% complete.
Completed renovations for the Mobile Service & High-Density Storage Facility at 750 Brannan Street.
Near completion of the Energy Efficiency Project at the Library’s Support Services Facility.
City College is planning to repair facilities using Proposition A funds to make necessary seismic retrofit and earthquake safety improvements, and upgrade buildings and facilities for energy-efficiency.
Voters approved a $790 million G.O. Bond for SFUSD Facilities in November 2024.
Completed HVAC system comprehensive upgrades and replacements for Station 9, 14, 26, and Community Paramedicine at 1415 Evans.
Completed hose tower removal work at Fire Stations 6, 11, 12, 21 and 38. Hose-tower removal and replacement is in process for Fire Station 15.
Progressed Emergency Firefighting Water System (EFWS) improvements including the completion of Pump Station 2 seismic retrofit project, installation of new pipes on parts of 19th Avenue as well as at new developments in Mission Bay, and the Clarendon supply pipeline.
San Francisco Police Department
Completed server room upgrades in alignment with federal National Incident Based Reporting System standards at the Academy, Central Station, and Marine Unit.
Awarded contract to Construction Manager / General Contractor to complete seismic retrofit and historic renovation of Ingleside Station.
Design finalized and contractors selected for Surge and PCD phase 1 construction at 1828 Egbert Ave.
Completed replacement of men’s showers at Mission Station.
Other Public Safety Accomplishments
Completed a renovation of the 911 Call Center in Spring 2024. The renovation project not only meets today’s needs but anticipates the growth and challenges associated with a 24/7 operation that is essential in the response to major emergencies.
Completed the Sheriff's Department Facilities Master Plan and Infrastructure Improvement Plan, documenting current and future capital needs across its jails and other facilities.
Completed plumbing upgrades for County Jail #6, including additional hot water heaters, new toilet privacy partitions, and sewer system repairs.
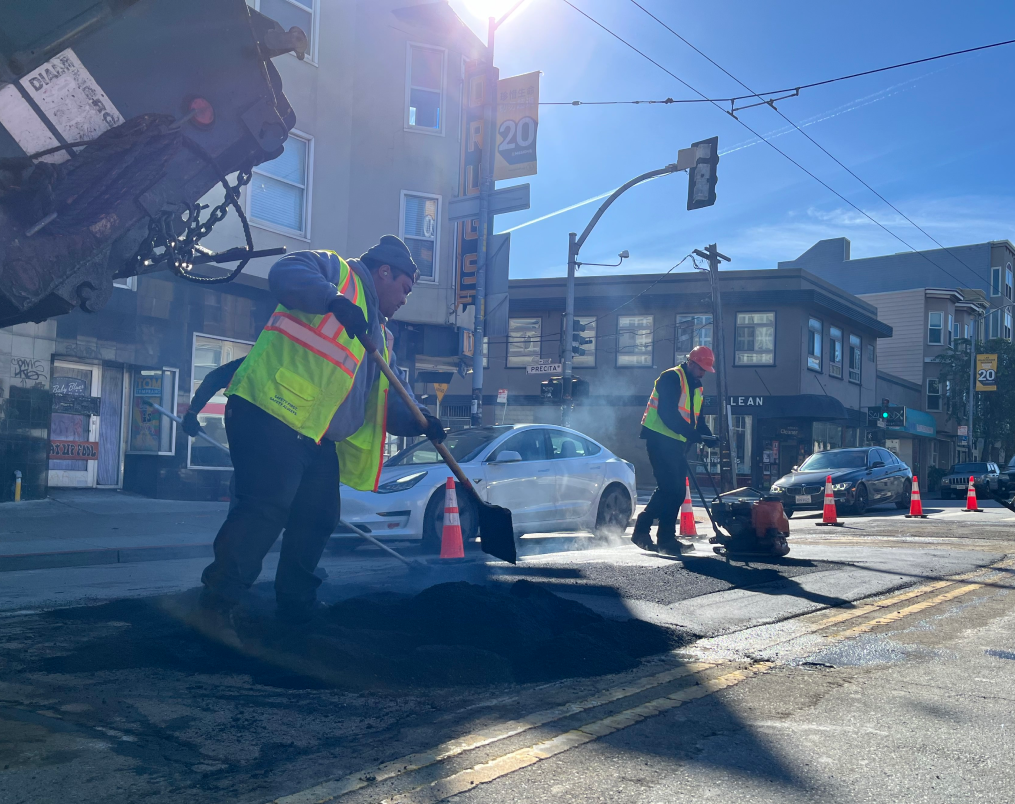
Repaved and maintained 1,011 street blocks, maintaining the City's Pavement Condition Index at 75 for 2024.
Constructed a total of 1,558 curb ramps.
Inspected 109 and repaired 31 street structures, such as bridges, retaining walls, plazas and public stairways.
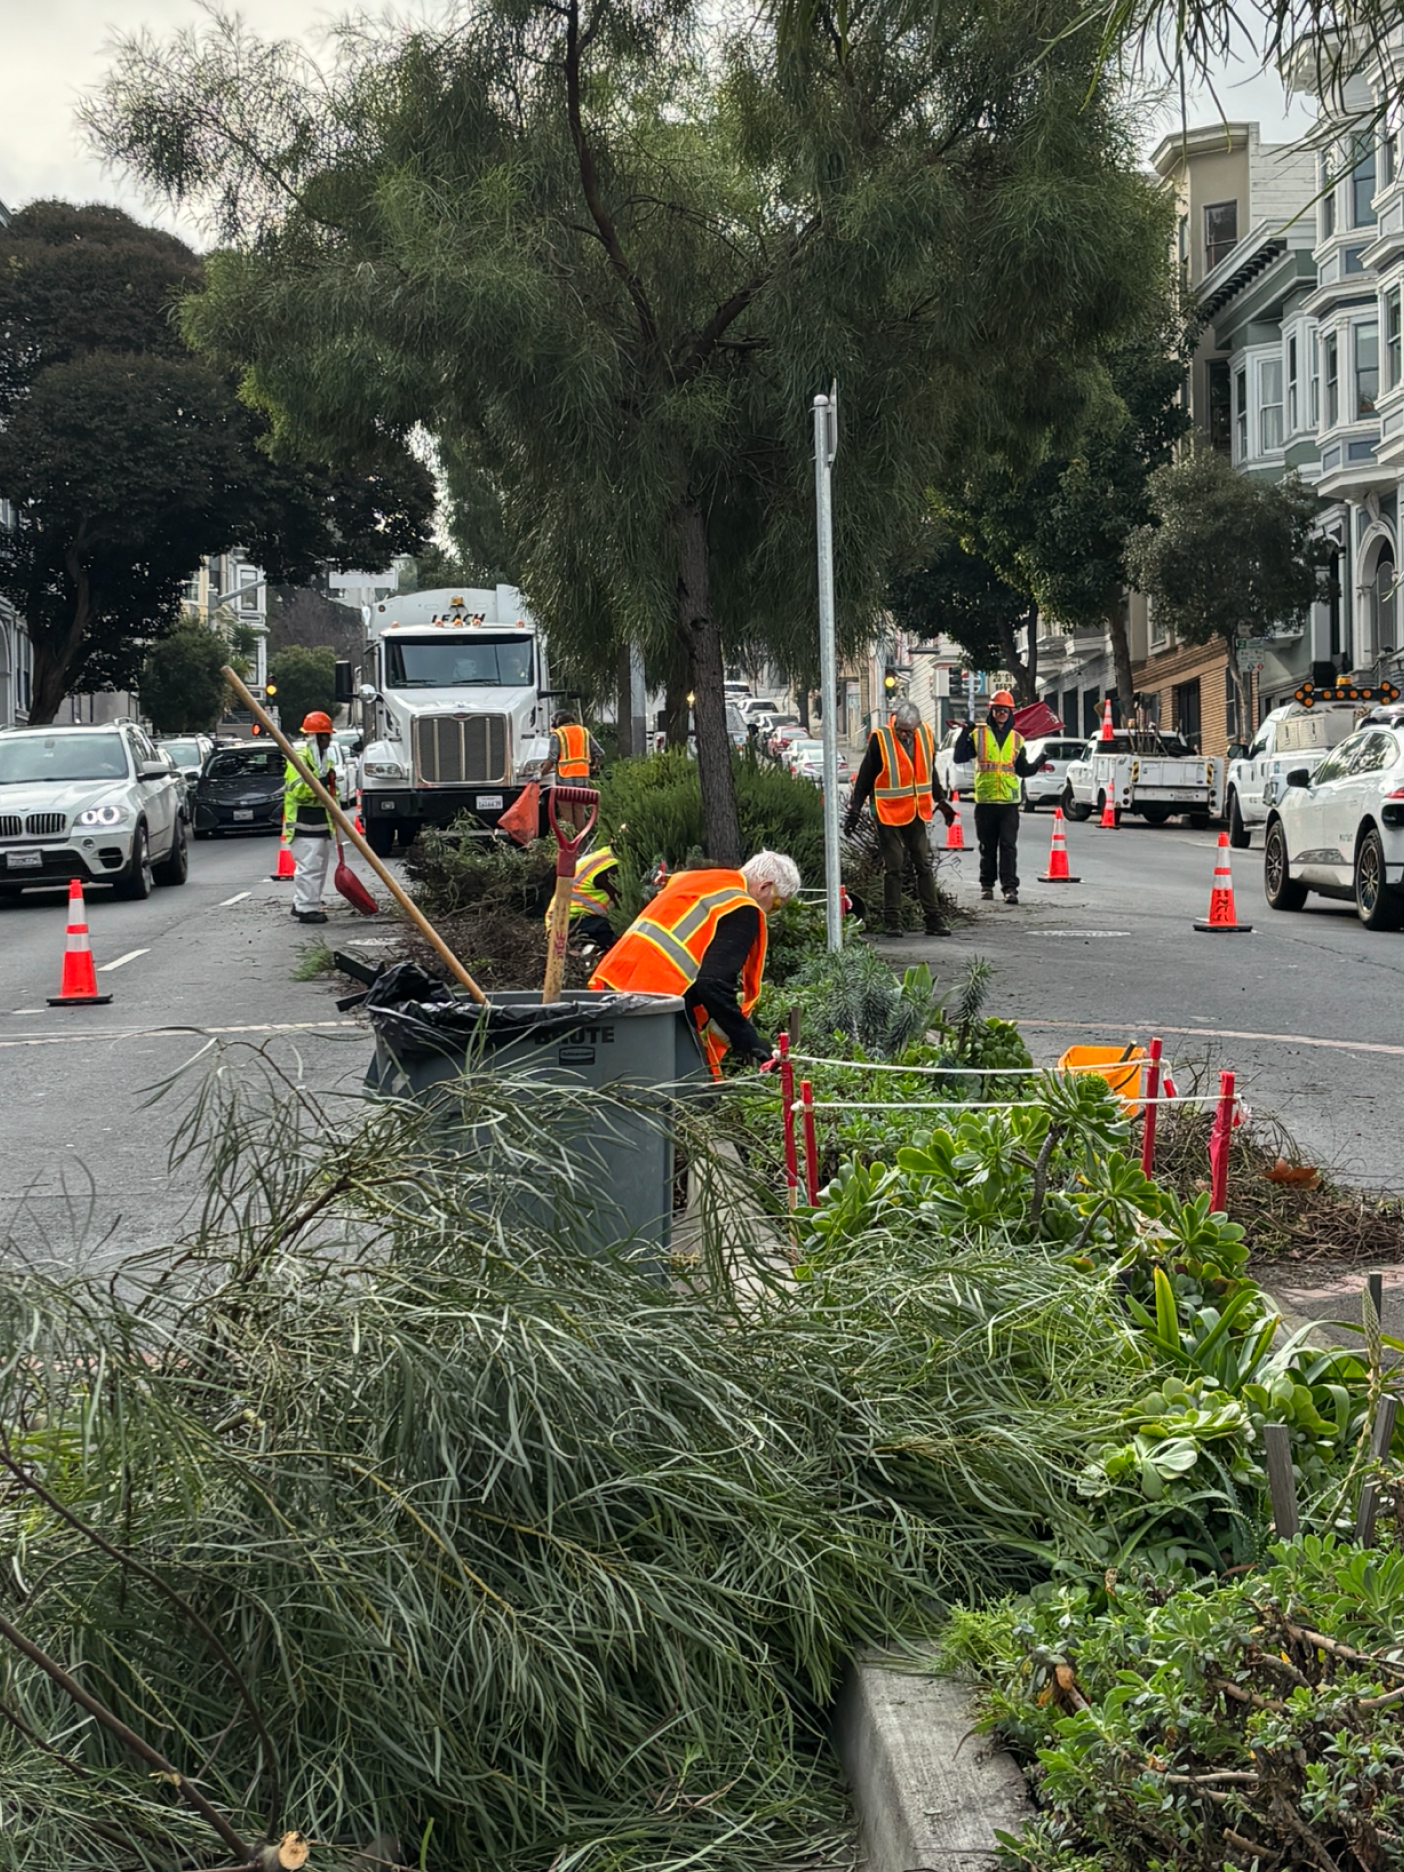
Inspected 15,775 trees, planted 2,766 trees, and maintained 26,526 trees.
Repaired more than 77,175 square feet of sidewalks, equivalent to 28 blocks.
Completed Phase 1 of Better Market Street, focused on the stretch between Fifth and Eighth streets, including ADA-compliant curb ramps, upgraded traffic signals, repaved roadways, new trees, benches, sidewalk pavers, and bike racks.
Public Utilities Commission
Completed several Water projects including, the Rollins Road Building Renovation, Harry Tracy Water Treatment Plant Filter Replacement, Corrosion Control Phase 2, Watershed Environmental Improvement, San Francisco Westside Recycled Water Pump Station, San Francisco Groundwater Supply, Emergency Firefighting Water System Pump Station No. 2, Clarendon Supply, and Reservoir and Irrigation projects.
Replaced 14 miles of water mains and completed 9 water main replacement construction contracts in San Francisco.
Replaced22 miles of main sewer work and awarded contracts for another 18 miles towards the completion of the Sewer System Improvement Program (SSIP), now at nearly 53% completion.
Commenced operation of New Headworks at Southeast Plant.
Completed several Wastewater projects including Wawona Area Stormwater Improvements, Mariposa Pump Station, Cargo Way Flush Line and Baker Street Combined Sewer Discharge Baffle Improvements, and three Large Diameter Sewer Improvements projects.
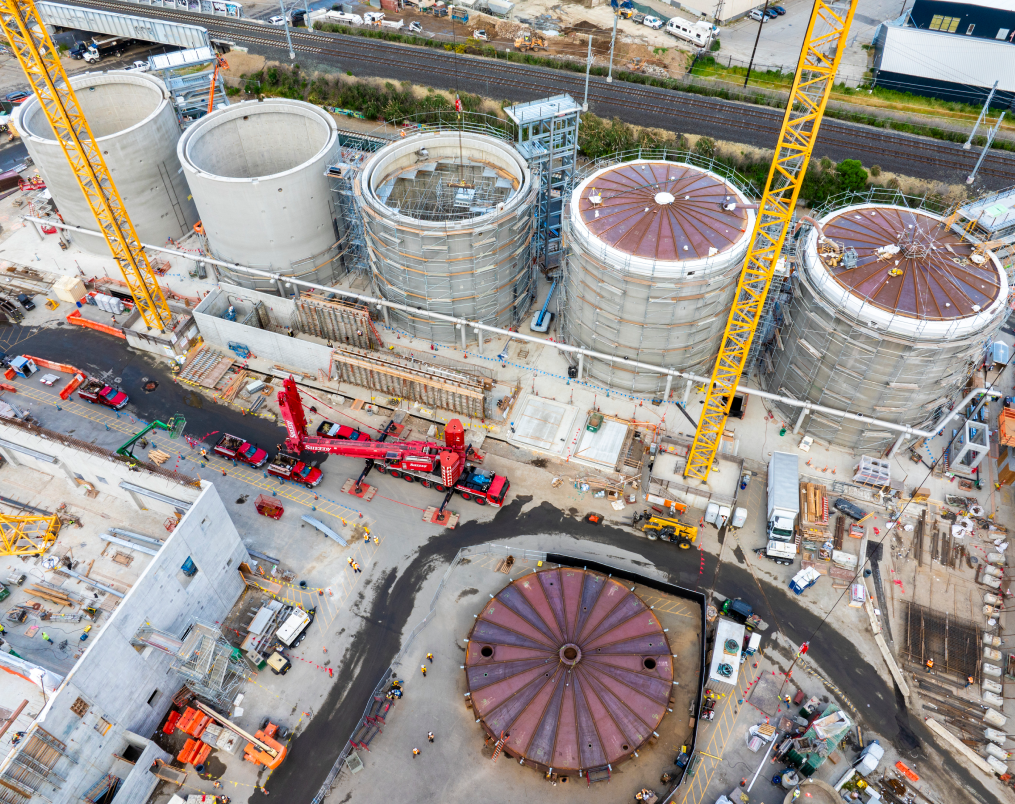
Advanced construction on several Wastewater projects including the Biosolids Digester Facilities Project, the Oceanside Water Pollution Control projects, the Southeast Water Pollution Control projects, the Westside Pump Station Reliability Improvements project, and the Treasure Island Water Resource Recovery Facility.
Started construction on the Channel Pump Station Bar Screens Replacement project.
Completed the second and third of five annual Hetch Hetchy water system shutdowns for construction of the Mountain Tunnel Improvements Project.
Completed several projects at O’Shaughnessy Dam including Fall Protection Improvements, Spillway Access, and installing two large-diameter gate valves.
Made significant progress on the San Joaquin Pipeline (SJPL) Tesla Valve Replacement, the SJPL Valve and Safe Entry, and the Moccasin Powerhouse and GSU Rehabilitation projects.
Completed emergency actions and repairs along the HHWP system associated with the 2023 January Winter Storm and 2023 March Winter Storm projects, including major repairs along Hetch Hetchy Road and Cherry Lake Road.
Completed eight metered Wholesale Distribution Tariff (WDT) interconnections for projects exceeding 10kW.
Completed the installation of three solar electric projects.
Energized the Bay Corridor Transmission Distribution substation, as well as major phase for redevelopment projects at Pier 70, Mission Rock, Treasure Island, and Yerba Buena Island.
Converted 626 decorative high pressure sodium luminaires to LEDs on the island along the Embarcadero.