San Francisco sits at the center of the Bay Area, both geographically and economically. To support our residents, workers, and visitors, the City must maintain a vast system of transportation infrastructure ranging from crosstown buses and Muni trains to the San Francisco International Airport, one of the busiest in the United States. Regional transportation assets like BART and Caltrain also run through the city, connecting San Francisco to the surrounding counties.
San Francisco is currently in the midst of implementing several major initiatives that will improve its transportation system. From the Transbay Transit Center downtown, Bus Rapid Transit lines on major thoroughfares, and terminal expansions at the Airport, San Francisco is adding capacity that will dramatically improve mobility for residents. The projects being pursued will expand the City’s transit network and provide benefits for generations to come.
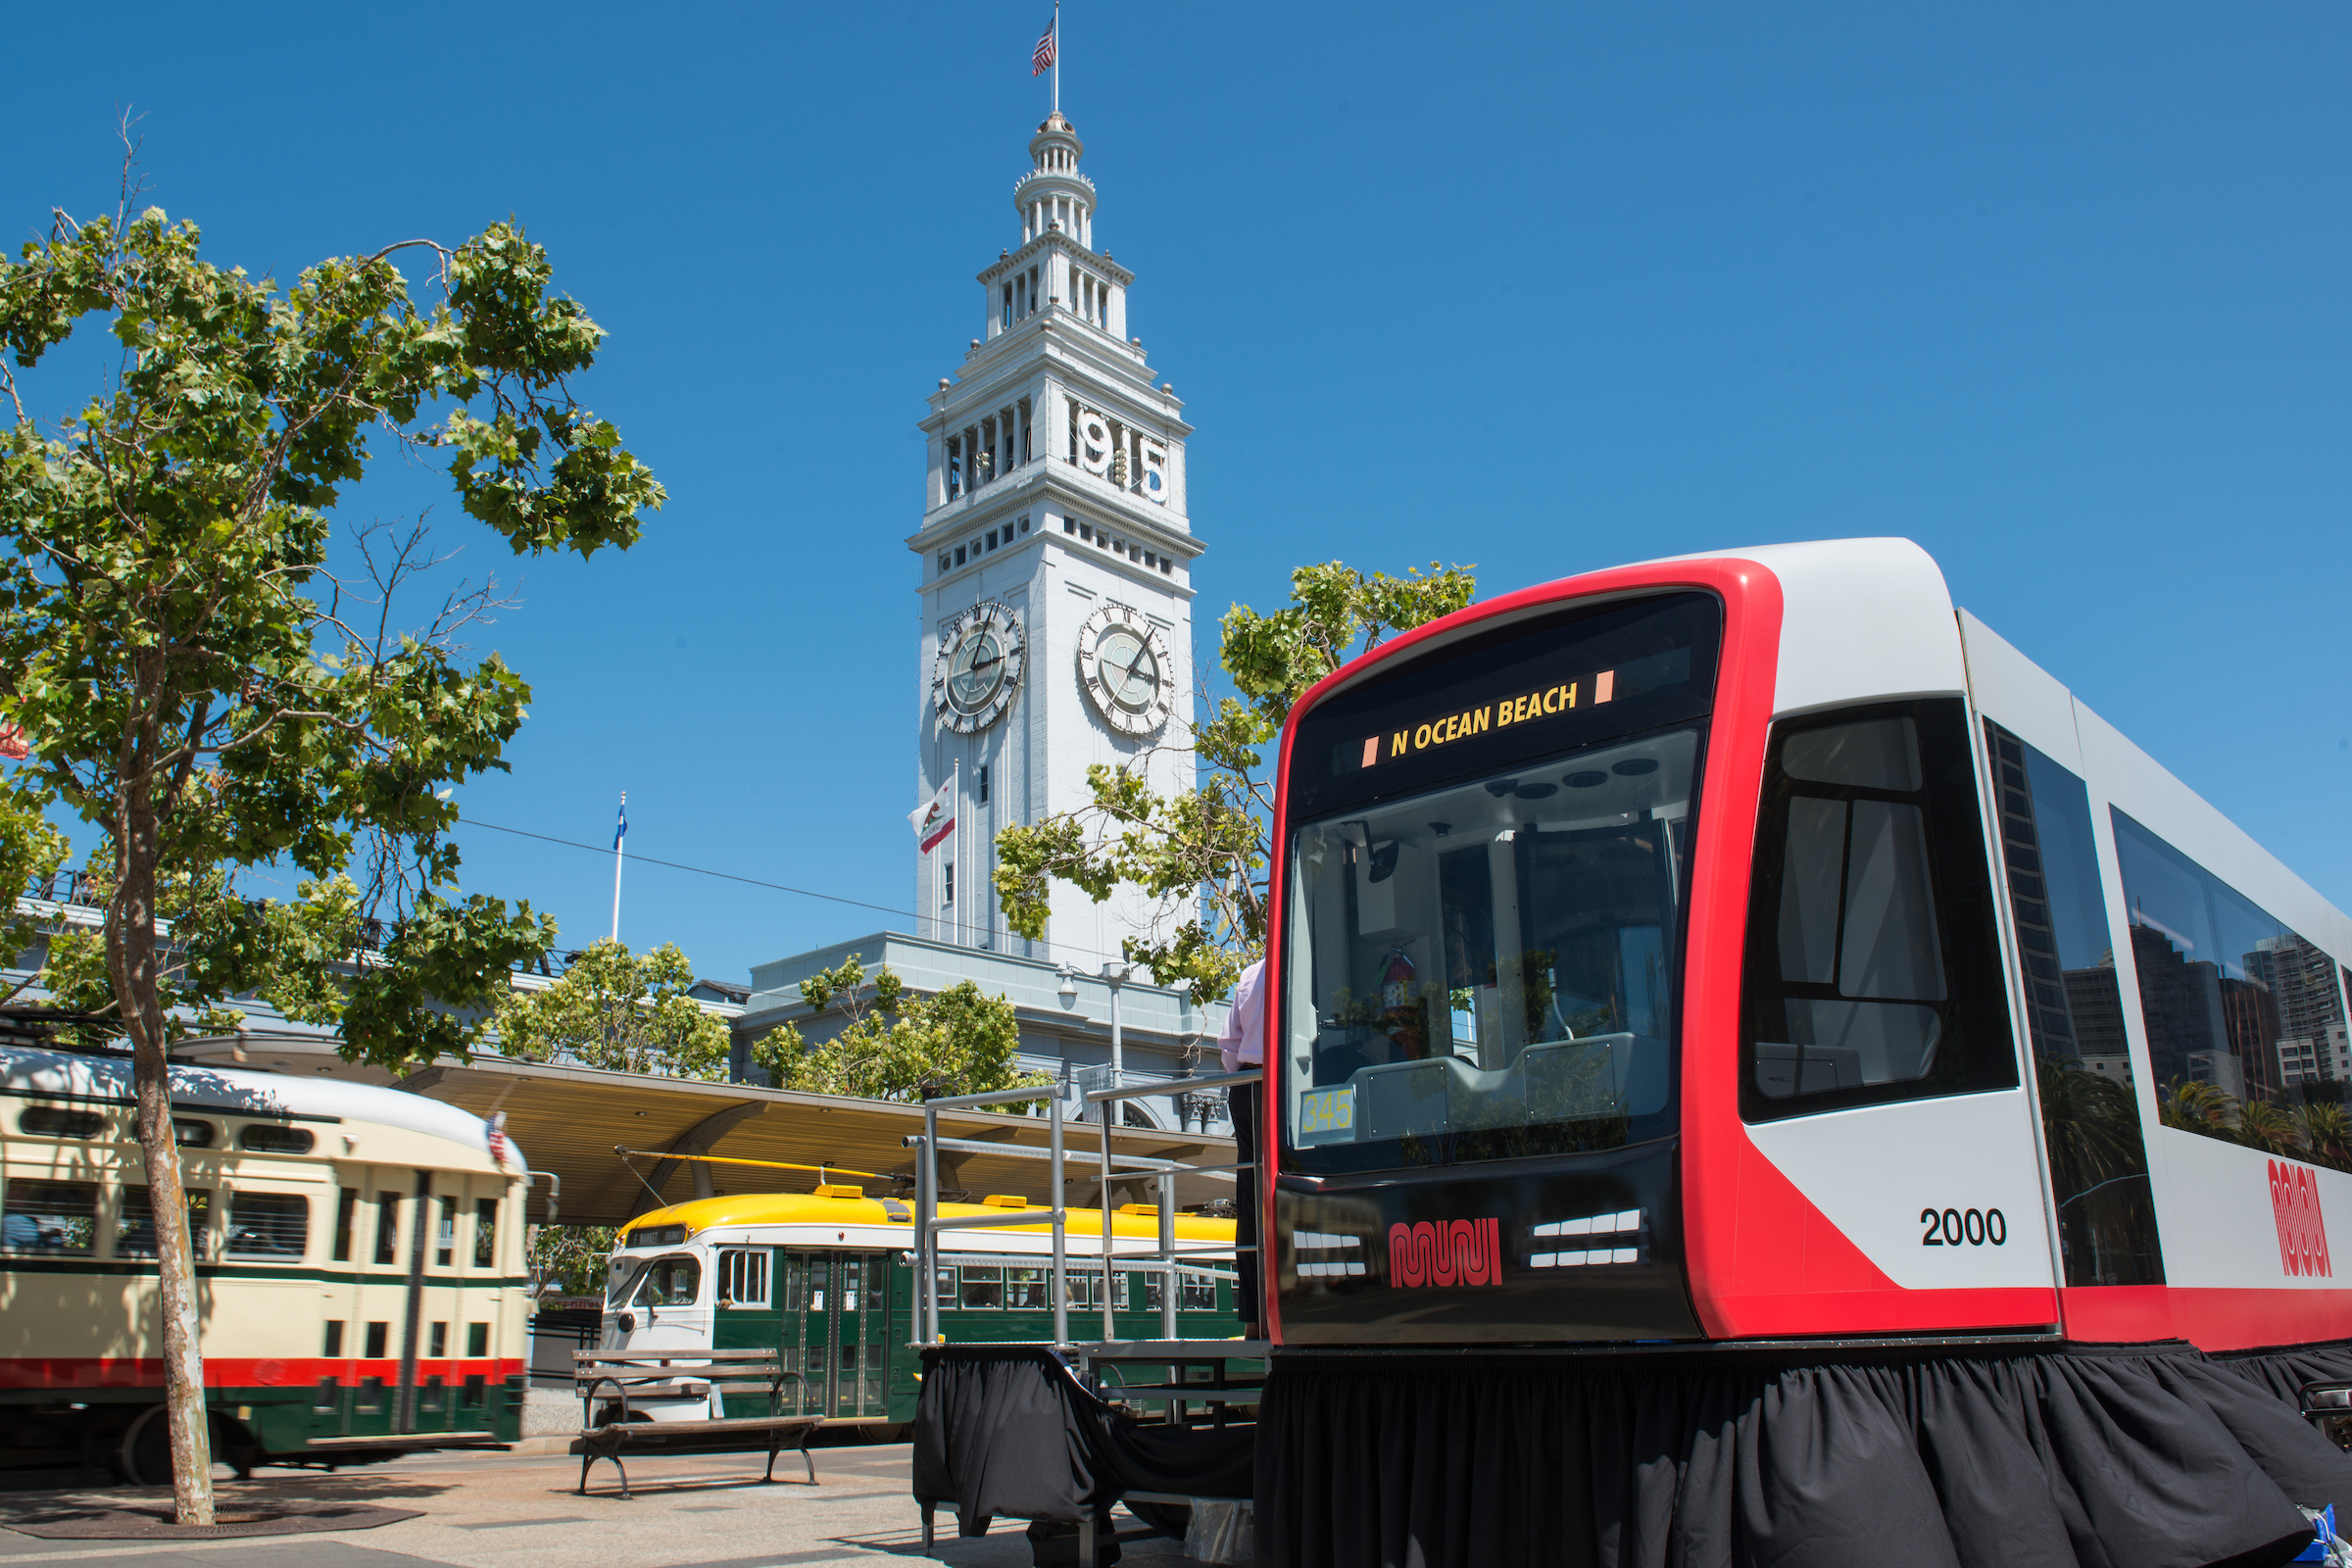
San Francisco Municipal Transportation Agency
The San Francisco Municipal Transportation Agency manages all City-owned ground transportation infrastructure in the city. Related operations include running the San Francisco Municipal Railway (Muni), managing parking and traffic, facilitating bicycling and walking, regulating taxis, and planning and implementing strategic community-based projects to improve the transportation network and prepare for the future.
The SFMTA has a number of short-term and long-term processes in place to identify and prioritize its capital projects. Once every two years the SFMTA develops its own fiscally unconstrained Capital Plan, last published in 2015, to identify needs for projects and programs over the next 20 years. This Capital Plan is overseen by the Transportation Capital Committee, which is comprised of representatives from all the agency’s functional divisions. This identifies the agency’s capital investment needs and establishes priority investments.
Over the next 10 years, the SFMTA’s total capital need is $6.1 billion.
This document summarizes SFMTA’s capital needs at a high level. For a detailed description of SFMTA’s capital projects, please see the SFMTA’s published plans at https://www.sfmta. com/about-sfmta/reports.
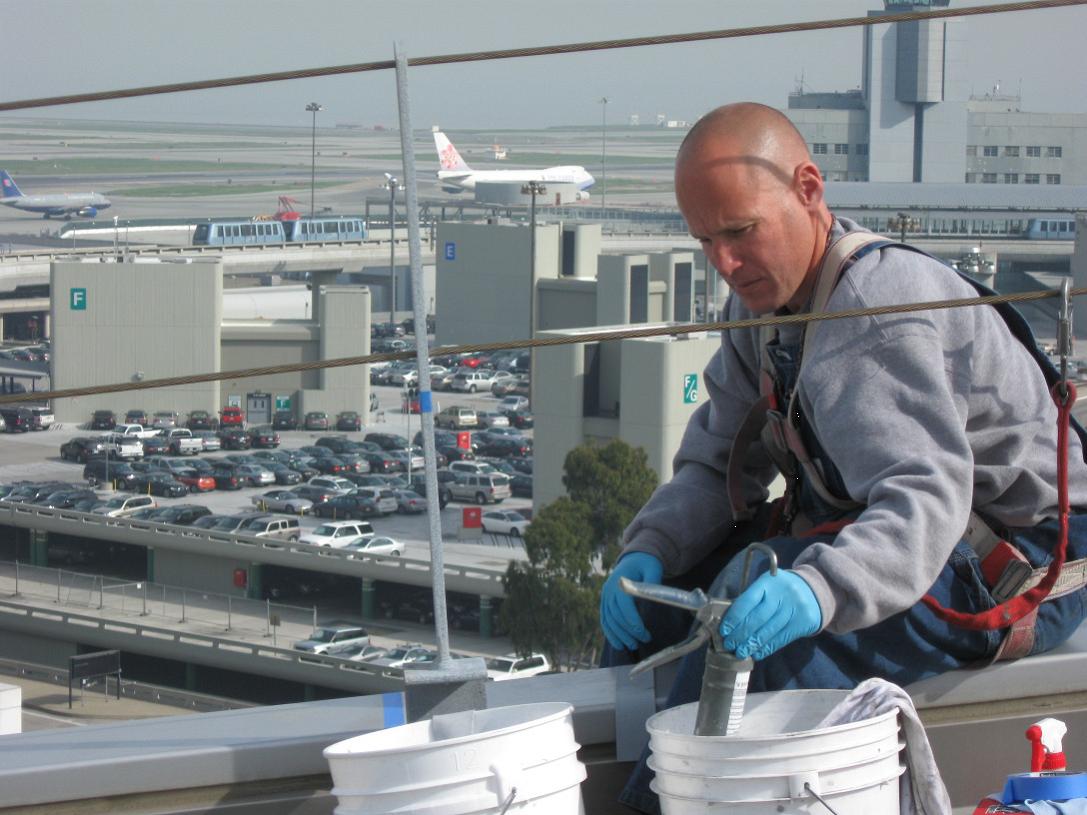
San Francisco International Airport
Owned by the City and County of San Francisco, and located within unincorporated San Mateo County, the San Francisco International Airport (SFO) manages a large and diverse infrastructure portfolio that includes four runways, 91 operational gates, and four terminals that total 4.4 million square feet. It also oversees 32 miles of roadways, five parking garages, the AirTrain transit system, a rental car facility, leased cargo and maintenance facilities, a waste treatment plant, and more than 274 miles of pipelines, ducts, power, and pump stations for water, sewage, storm drainage, industrial waste, and gas, in addition to electrical, and telecommunications distribution systems.
To help manage its assets, the Airport maintains a five-year and a 10-year Capital Plan, which is generally updated annually. A major objective of Airport’s current Capital Plan is to meet increased infrastructure demands driven by historic levels of passenger growth. In FY2016 the Airport continued its long run of passenger growth, reaching a record 51.4 million passengers – a seven percent increase over the prior year and a 56% increase since FY2007.
The Airport’s Capital Plan identifies $5.7 billion in need over the next five years, and $6.1 billion over the next 10 years. This chapter contains a high level summary of the Airport’s capital needs. For a more in-depth description of the Airport’s capital projects, please see the five-year and 10-year Capital Plans published on the Airport’s website: http://www.flysfo.com/about-sfo.
San Francisco County Transportation Authority
The San Francisco County Transportation Authority (SFCTA) is the sub-regional transportation planning and programming agency for the City. The SFCTA is responsible for the City’s long-range transportation planning, coordinating with federal, state, and other local transportation agencies. In this capacity SFCTA helps to plan, fund, and deliver improvements for San Francisco's roadway and public transportation networks.
In early 2017, the SFCTA will adopt a minor update of the 2013 San Francisco Transportation Plan (SFTP), the long-range countywide transportation plan. The SFTP evaluates existing needs and growth trends to develop updated transportation sector policies, strategies, and investment priorities for sustainable growth.
The full SFTP can be found at http://www.sfcta.org.
Connect SF (http://connectsf.org/) is a multi-agency collaboration process that builds on the SFTP and other local planning efforts to develop an effective, equitable, and sustainable transportation system for our future. It will develop a long-range vision that will guide plans for the City and our transportation system.
Peninsula Corridor Joint Powers Board (Caltrain)
San Francisco, along with San Mateo and Santa Clara counties, is a representative member of the Peninsula Corridor Joint Powers Board (JPB), which operates and maintains Caltrain, one of the oldest commuter rail services in Northern California. Caltrain provides peak and off-peak connections along the Peninsula rail corridor between San Francisco and Gilroy. Per the 1996 Joint Powers Agreement, funding for system-wide capital improvements are shared equally among the three member counties, while local improvements are, in general, borne by the county in which the improvements are located.
The total estimated cost for the 10- year JPB Capital Improvement Program is $3.3 billion, as projected in its most recent Short Range Transit Plan, covering FY2015 through FY2024. This includes basic maintenance, renewal costs, and major enhancements. An example of such enhancements are the conversion to an electrified system and installation of a federally mandated Positive Train Control system.
The Short Range Transit Plan can be found at www.caltrain.com.
Transbay Joint Powers Authority
The Transbay Joint Powers Authority (TJPA) was created to manage all matters concerning the financing, design, development, construction, and operation of the Transbay Program, including the Transbay Transit Center. The Transbay Transit Center will help unify a fractured regional transportation network by connecting eight Bay Area counties and the State of California through 11 transit systems: AC Transit, BART, Caltrain, Golden Gate Transit, Greyhound, Muni, SamTrans, WestCAT Lynx, Amtrak, Paratransit, and the future California High-Speed Rail. The Program’s total capital cost is estimated at approximately $6.2 billion. It is funded through a mix of local, regional, state and federal funds.
A related project overseen by the City’s Office of Community Investment and Infrastructure will create a new mixed-use transit-oriented neighborhood surrounding the new Transit Center. For more information on Transbay neighborhood development, please refer to the Office of Community Infrastructure and Investment Section within the Economic and Neighborhood Development Chapter of this Plan.
Bay Area Rapid Transit
Since its opening in 1972, Bay Area Rapid Transit (BART) has become essential to the mobility, economy, and livability of the Bay Area for riders and non-riders alike. BART currently carries 440,000 passengers on a typical weekday. Forecasts suggest that demand for BART will increase as the region grows, with 600,000 daily riders projected to use BART by 2040. However, after 44 years of service to the region, BART faces major challenges including aging infrastructure and crowded conditions for riders. Without addressing these issues BART will not be able function effectively, putting the Bay Area’s economic vitality and quality of life at stake.
In November 2016 voters approved Measure RR which authorized BART to issue $3.5 billion in G.O. Bonds to fund projects throughout its system. The Bond was put to the voters in three counties: San Francisco, Alameda, and Contra Costa. Its projects include replacement of 90 miles of track, renew mechanical infrastructure, repair of tunnels and stations, and many other initiatives that will modernize the BART system. The result of the Bond’s program will be shorter wait times, fewer delays, and more comfortable rides for passengers.
Riders to, from, and through San Francisco will benefit from overall system improvements. These improvements will include repairing water damage in the Market Street tunnels, ADA compliance to improve accessibility, and adding protective canopies to all downtown stations. BART will begin Phase 1 of its Powell Street and Balboa Park modernizations to improve capacity, aesthetics, and security. Balboa Park is also receiving the Eastside Connection Project, which will improve access to the station.
BART's investments in San Francisco will establish its stations as inviting public spaces and provide reliable service to its riders.