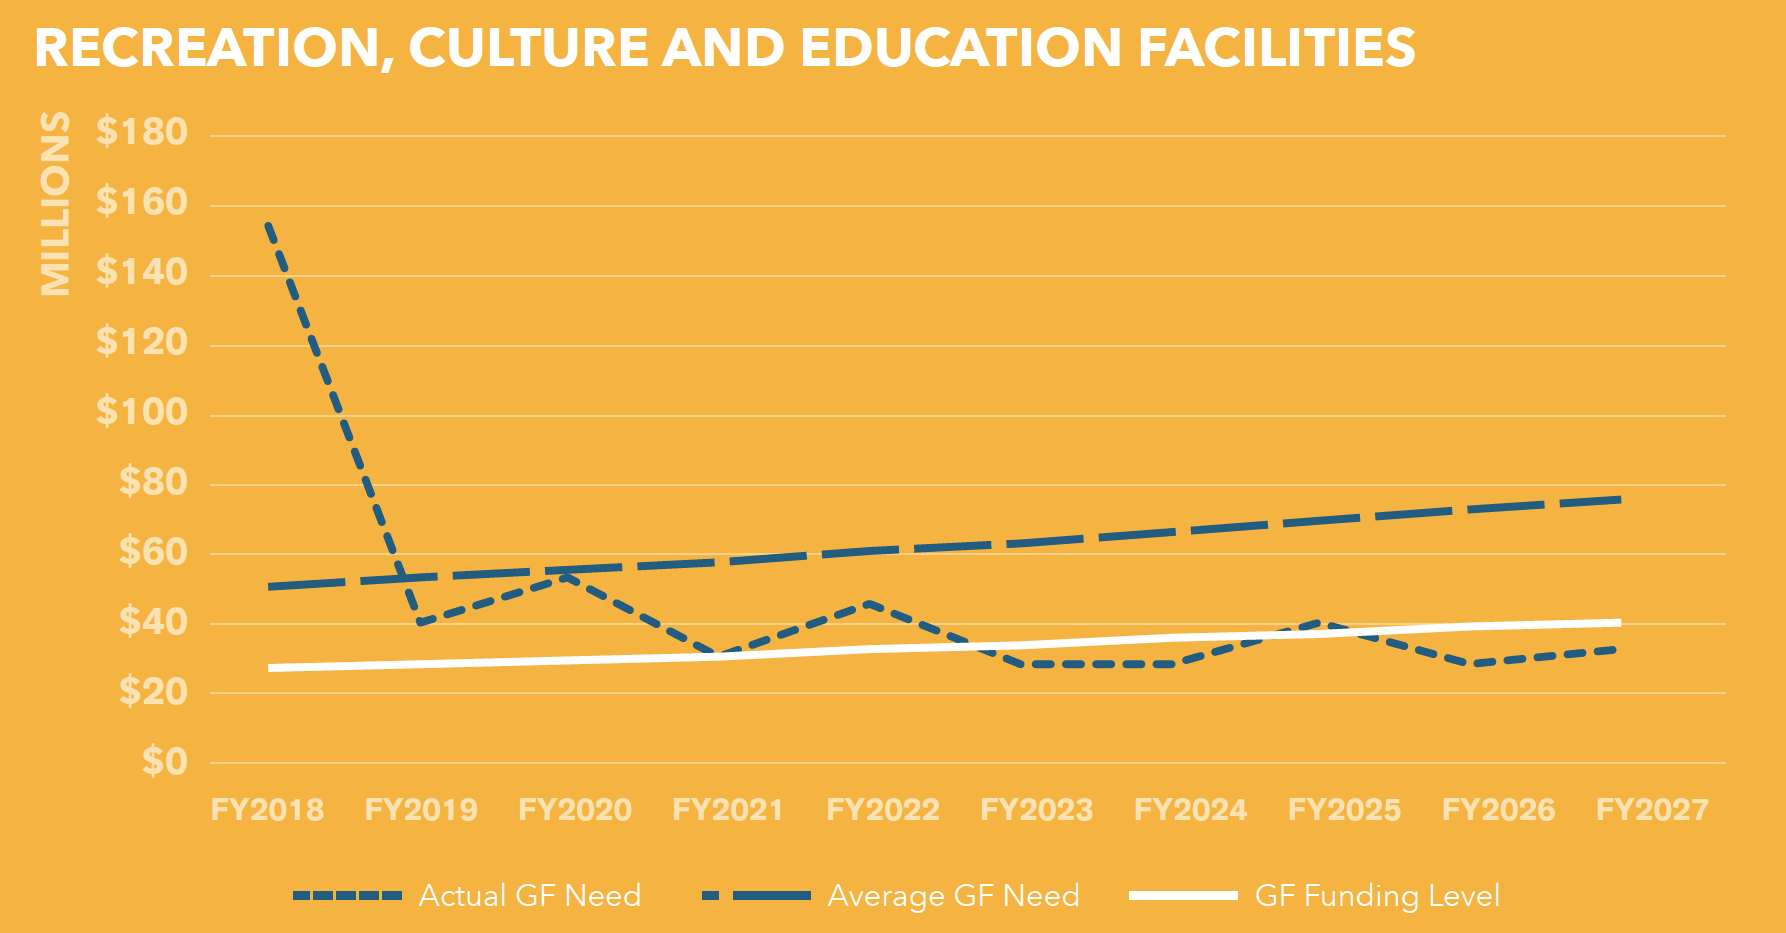
| Project Name |
Description |
REC – Neighborhood Park Projects
& Open Space Improvements |
Neighborhood parks typically include a mix of facilities and amenities, such as playgrounds, courts, fields, clubhouses, restrooms, and dog play areas. This program focuses on improving and modernizing facilities to provide recreational opportunities that meet current and future demand. New investment is needed to modernize the system, increase open space and recreational opportunities, improve the quality of park experience, and address currently unmet as well as future needs in high growth areas. These projects often have partnership investment, which are developed along with the projects, particularly for projects delivered from the Community Opportunity Fund.
This program will receive $25 million from the 2020 Health and Recovery G.O. Bond. Additional funding is expected from the REC set-aside within the General Fund and the planned 2028 G.O. Bond, pending voter approval. |
REC – ADA Improvements
to Parks Facilities |
In coordination with the Mayor’s Office on Disability (MOD), this program includes disability access improvements to specific sites and facilities as cited for ADA complaints and barrier removals. Corrections include toilet and shower alterations, walkway and pathway paving to compliant accessible slopes, ramp and stair handrails and provision of accessible parking. In addition, REC is leveraging grants and other capital funds where possible.
The planned funding for this program is $600,000 per year from the REC set-aside within the General Fund. MOD continues to receive complaints related to physical access within this portfolio, and may make additional requests from the General Fund. |
| REC – Buchanan Street Mall Improvements |
Buchanan Street Mall is comprised of five consecutive blocks of green space, asphalt paths, and underperforming playgrounds from Eddy Street to Grove Street. Presently within the five blocks are several temporary gardens, tree planters, seating areas, decorative lighting, and interactive sculptural multimedia installations that explain the neighborhood’s history. Developed through a robust community process, the project is intended to reinvigorate a long-underfunded community by creating a place that serves as a primary gathering place for the neighborhood, starting with the block between Golden Gate Avenue and Turk Street. Key design elements on the initial block renovation include playground and exercise equipment for all-age play, flexible spaces, landscaped area, and intimate gathering areas with seating options. Remaining funding could support a memory walk with a variety of interpretive elements.
This project will receive $2 million from the 2020 Health and Recovery G.O. Bond. In addition, $3 million is expected from the Market Octavia Plan Area in FY2022. Previously appropriated funding sources include $515,000 from the IPIC Market Octavia Plan Area and $578,000 from the General Fund. REC is also seeking to supplement this funding with Prop 68 grant funding in partnership with the Trust for Public Land. |
| REC – Buena Vista Park |
Buena Vista Park is a 36-acre park and includes a children’s play area, dog play area, tennis courts, restroom facilities, park maintenance facilities, trails, pathways, and landscaped and natural areas. The park contains one of the City’s few remaining coast live oak groves on its northern side. Improvements may include the restoration and repair of existing park elements such as circulation and hardscape improvements; soil management and erosion controls; forestry and planting improvements; water conservation and irrigation improvements; and enhancement of site furnishings and lighting.
This program will receive $3 million from the 2020 Health and Recovery G.O. Bond. |
REC – Chinatown/Portsmouth
Square Improvements |
This program would fund much-needed improvements to Portsmouth Square to create a central community space that is safe and welcoming to all, including the many residents of nearby affordable housing. REC has a preferred plan at Portsmouth Square that is currently undergoing environmental review. Improvements may include a reconstruction of amenities such as the playground or addition of other amenities; pathway and accessibility improvements; landscaping and beautification; removal of the pedestrian bridge over Kearny Street; expanded clubhouse footprint; and lighting improvements.
This project is estimated to cost $65 million, and will receive $54 million from the 2020 Health and Recovery G.O. Bond. The project has previously received $9 million in Transit Center Community Facilities District funding and plans to use $500,000 of Downtown Park Fund fee revenue. |
| REC – Citywide Parks |
Together, San Francisco’s citywide serving parks – Golden Gate Park, John McLaren Park, and Lake Merced Park – comprise almost 2,000 acres of open space, each with vast, ongoing capital needs. This program renovates and improves park features, including restoration of natural features, recreational assets, and connectivity and access at these citywide parks.
This program will receive $13 million from the 2020 Health and Recovery G.O. Bond. |
| REC – Crocker Amazon Playground |
Crocker Amazon Playground is a host to numerous fields, tennis and basketball courts, three concrete bleachers structures and a clubhouse. It is a regional hub for ground sports athletics, soccer, lacrosse, baseball, and softball, and an important facility for neighbors. REC is exploring a potential public-private partnership with the San Francisco Giants to support equitable access through a variety of youth enrichment programs, such as baseball, softball, academic support, etc. Identified opportunities could include renovation of the baseball diamonds, ancillary structures, and other amenities including educational facilities, restroom improvements, security, pathways, parking improvements, site amenities, and potential development of multi-use natural grass areas.
This project will receive $15 million from the 2020 Health and Recovery G.O. Bond. An additional $15 million is expected from a San Francisco Giants grant. |
| REC – Gene Friend Recreation Center |
Located in an area where open space and recreation opportunities are limited, this facility is heavily used by children, seniors, and others who live and work in the SoMa neighborhood – which is also one of the city’s fastest growing neighborhoods. REC collaborated with the Trust for Public Land on a feasibility study and concept plan, which replaces the existing facility with one almost twice the size. The new facility would include a double basketball court gym and a second story of program space with triple the number of multipurpose rooms. The project includes improved lighting, security, and new outdoor amenities: a basketball court, plaza space, playground, and landscaping.
This project will receive $30 million from the 2020 Health and Recovery G.O. Bond. Previous funding includes $27.8 million from Eastern Neighborhood and Central SoMa impact fees. |
REC – Golden Gate Park
Botanical Garden Nursery |
In collaboration with the San Francisco Botanical Garden Society, a new nursery will be built at the Golden Gate Park Botanical Garden. The proposed project will replace several of the Botanical Garden’s existing aging structures, related equipment and storage as well as infrastructure required for growing plants. In addition, the project will consolidate the Botanical Garden’s existing growing grounds and greenhouse facilities into a single, contiguous area at the site of its current nursery.
REC has budgeted $150,000 of General Fund in FY2022 to supplement the previously allocated $181,000 in FY2021. SFBGS is leading a $6.8 million fundraising campaign for the project, which has so far reached 85% of their stated goal. |
REC – Herz Playground
New Recreation Center |
Herz Playground, situated on the southeast corner of John McLaren Park, serves the Visitacion Valley neighborhood. The Herz project includes the construction of a new rec center on park property. The new facility will be approximately 11,500 square feet and feature an indoor basketball court, bleachers, office space, a multi-purpose room, restrooms, and other spaces for storage and building systems equipment. Outdoor improvements will include a plaza at the entrance, installation of adult fitness equipment, lighting, removal of hazardous trees, and pathway and circulation improvements to connect the park with the Sunnydale community and neighboring Community Center that will be developed as part of the HOPE SF Sunnydale redevelopment.
This project will receive $10 million from the 2020 Health and Recovery G.O. Bond. In collaboration with HOPE SF, REC is also developing a partnership agreement estimated at $10 million that consists of both funding and services. |
| REC – India Basin / 900 Innes |
Located in the Bayview-Hunters Point neighborhood, the 900 Innes property, acquired in 2014, is a brownfield that needs substantial remediation before development. By connecting the site to adjacent India Basin Shoreline Park, REC will be able to create one grand waterfront park, close a critical gap in the San Francisco Bay Trail, and increase access to open space in an under-served area of the city. Along with planned improvements to India Basin Open Space funded by the adjacent housing development, a 20-acre network of new and/or improved open space will be created. With an emphasis on access, social equity, waterfront recreation, sea level rise resiliency, and marsh and wetland habitat, this project will feature pedestrian and bicycle shoreline access, passive open space, fishing areas, tidal marshes, plazas and event spaces, picnic areas, site furnishings, and historical and educational displays.
The India Basin / 900 Innes project is projected to cost $128 million, of which $76.3 million has been identified. This project will receive $29 million from the 2020 Health and Recovery G.O. Bond, $25 million from the John Pritzker Family Fund, and the remaining from combination of local, state and federal sources. REC is planning a private fundraising campaign, along with pursuing public grants, to bridge the remaining funding gap. |
| REC – Jackson Playground |
The 4.9-acre Jackson Playground is located in Potrero Hill and occupies an entire city block. Jackson Playground includes picnic areas, tennis and basketball courts, two ball fields, a children’s play area and clubhouse. REC, in collaboration with the Friends of Jackson Park community group, is working on a design for the renovation of the park. REC has a preferred plan at Jackson Playground that is currently undergoing environmental review. Improvements may include reorientation and renovation of some existing park amenities such as the sports fields, construction of a new playground, and the relocation, renovation and possible extension of the historic clubhouse.
This project will receive $10 million from the 2020 Health and Recovery G.O. Bond. In addition, the project is expected to receive $6.36 in FY2024 and 2025 from Eastern Neighborhood IPIC funding. The project has also previously been appropriated $1.6 million of Eastern Neighborhoods IPIC funding. This project is a partnership with Friends of Jackson who are expecting to raise approximately $9 million. |
REC – Japantown Peace
Plaza Improvements |
Japantown Peace Plaza, located in the heart of Japantown, was last renovated in 2000. For many years, the plaza has been leaking water to a public garage situated below the mall and plaza. The Japantown project will resolve the water intrusion and provide a reinvigorated space for the community. The renovation will include new planting, shade structures, paving, seating, lighting, and potential structural reinforcement of the Plaza and Peace Pagoda, if deemed necessary. The new community-driven, culturally sensitive design will provide more functional access to the Plaza, both for everyday and special event use, while harnessing the symbolism that this site holds within the neighborhood, city, and region.
This project will receive $25 million from the 2020 Health and Recovery G.O. Bond. |
| REC – Golden Gate Park |
Golden Gate Park Improvements would be delivered near the Golden Gate Park Senior Center to provide outdoor elements for senior or intergenerational engagement. These improvements could include outdoor, intergenerational exercise equipment to provide opportunities for both independent and guided activities, landscaping, communal gardening beds, pathways, and benches.
This project will receive $1 million from the 2020 Health and Recovery G.O. Bond. |
REC – South Ocean Beach
and Sustainability Efforts |
As part of the City’s first Climate Adaptation Project at South Ocean Beach, this initiative will create a new multi-use trail between Sloat Avenue and Skyline Boulevard with a restroom and a parking lot near Skyline, connecting the Lake Merced Trail and the Lower Great Highway Trail. The trail, restroom and parking lot project will be implemented in conjunction with other improvements at South Ocean Beach such as the creation of dune habitats, improved pathways to the beach, and the SFMTA, Caltrans and PUC-led projects in the area. Other anticipated projects include conservation, protection and restoration efforts, such as forest management; water conservation measures; energy generation and conservation measures; landscaping with native plants; acquisition, improvement, or expansion of urban agriculture sites; and development of new spaces to improve resiliency.
These projects will receive $14 million from the 2020 Health and Recovery G.O. Bond. Previously, the trail project has received $1.7 million in funding from the Federal FLAP program, $264,000 from Prop K sales tax, and $45,000 from an in-kind donation from SPUR. |
| REC - South Sunset Playground |
South Sunset Playground is a 4-acre park featuring ball fields, basketball and tennis courts, a playground, a paved multi-use play area and the clubhouse. The 2,600 square-foot single-story clubhouse includes a multi-purpose room, restrooms, a kitchen, and an office. The building was originally constructed in 1957 and has not seen any major renovation in decades. Improvements to the park could include the reconfiguration or renovation of interior spaces or building systems in the clubhouse, access improvements, landscaping, and beautification.
This project will receive $3 million from the 2020 Health and Recovery G.O. Bond. |
| REC – Kezar Pavilion Seismic Upgrade |
With a seating capacity of more than 5,000, the historic Kezar Pavilion, situated in the southeastern corner of Golden Gate Park, is used for large sporting events, and could be used for functions such as shelter, mass care and mutual aid after a major disaster. In 2013, an engineering study by Public Works found that Kezar Pavilion needs a seismic upgrade to ensure safety for staff and public use. The facility also requires comprehensive systems upgrades and historic rehabilitation.
The cost estimate for this project is $88 million. It will receive $70 million from the 2020 ESER G.O. Bond, and $5 million from the 2020 Health and Recovery G.O. Bond. Additional funding sources are yet to be identified. |
| REC - Esprit Park |
The Esprit Park renovation is a partnership project between REC, UCSF and the Dogpatch and Northwest Potrero Hill Green Benefit District. Renovation of this roughly 2-acre park includes drainage and irrigation improvements, refined circulation throughout the park, retaining the urban forest feel, clarifying functional use areas and providing infrastructure and amenities for different user groups including children, adult fitness community, and off-leash dog walkers.
The project has received $5 million from UCSF, $2.7 million through IPIC Funding and a $35,000 General Fund contribution. |
REC – New Park Acquisitions
and Capital Development Needs |
REC is currently reviewing potential site acquisitions for future parks in San Francisco. The recently acquired site at 11th Street in western SoMa needs to be remediated, planned, designed and developed. Planning for the new park is expected to begin in early 2021.
The 11th & Natoma project has received $8.8 million in Impact Fees from Eastern Neighborhoods and is expected to receive $3 million from Market Octavia Impact Fees. This project has also received $9.7 million for acquisition and $275,000 for remediation needs from REC’s Open Space Acquisition Fund. |
| REC – Bond Planning and Implementation |
This program funds staff time to progress and complete neighborhood park projects and citywide programs associated with the 2020 Health and Recovery G.O. Bond and future G.O. Bonds.
The projected funding for this program is $9.2 million over five years coming from the Central SOMA Interagency Plan Area. |
| LIB – Resilience Improvements |
The Library’s upcoming strategic planning efforts will address climate change issues in accordance with the City’s strategic plans and desired goals for weather relief centers. Working together with City partners such as the Office of Resilience and Capital Planning, Department of Emergency Management, and Department of Public Health, it is likely that some Library locations will be identified for the installation of enhanced cooling and/or air filtering systems to provide shelter for citizens during smoke or heat days. This work builds on the Library’s ongoing efforts to install more green energy systems, such as the solar energy project currently underway in partnership with the PUC at the 190 9th Street Support Facility.
In FY22 the Library has appropriated $291,000 for implementation of small-scale resilience projects. |
| LIB – Chinatown Branch Renovation |
The Chinatown Branch Library renovation will address the needs of the community and include the latest innovations in delivery of library collections, programs, and learning. The Chinatown Branch has special historical architectural significance, and the restoration of previously lost historical features will also be explored.
The estimated cost of the Chinatown Renovation is $29.5 million, including a budget for relocation of library service during construction. Given the challenges presented by the COVID-19 pandemic, the Library has appropriated $9.5 million towards this project through FY21, $1 million in FY22, and $2.5 million in FY23, leaving a budget gap of $16.5 million. With the Library Preservation Fund up for renewal in 2022, no additional Library funds are committed at this time. |
| LIB – Ocean View Branch New Construction |
Originally planned as a renovation, work for the Ocean View Branch Library has been re-envisioned as a new large facility to serve a beacon for the OMI neighborhood and beyond. Planning work has begun, engaging the community during the last two years to discuss project scope and identifying a probable site. There has been discussion about dovetailing the Library project with traffic improvements in the area long been desired by SFMTA, which may impact the timeline.
The estimated cost for the Ocean View construction project is $47 million. The Library has appropriated $12.5 million for this project through FY21, $1 million in FY22, and $2.5 million in FY23, leaving a budget gap of $31 million. With the Library Preservation Fund up for renewal in 2022, no additional Library funds are committed at this time. |
CCSF – Ocean Campus Utility
Infrastructure Replacement |
Infrastructure replacement and capital improvements at the Ocean Campus will address systems at risk of catastrophic failure and correct deficiencies that represent significant hazards to students, faculty, staff and the public. The scope of the project will repair, modify, replace, and/or construct the following infrastructure systems: fire suppression systems, potable water, sanitary sewer, storm drainage, natural gas and electrical distribution, data and emergency notification, video surveillance, lighting, boilers, and steam distribution.
The budget for this effort is $73.9 million and will be funded out of the California Chancellor’s Office Capital Outlay Program. |
CCSF – 750 Eddy Street Seismic
and Code Upgrades |
This project will add structural integrity to the building by bringing it into conformance with current building code. Concurrently, upgrades will be made to mechanical, plumbing, electrical, communication, building envelope, interior walls, floors, and ceilings as required by code and to facilitate seismic enhancements.
The revised budget for this project is $25.5 million, and CCSF is requesting additional funding from the California Chancellor’s Office Capital Outlay Program. |
| CCSF – Evans Center Renovation |
Structural and seismic and earthquake safety upgrades, including roof and window repairs to address water leaks, and reconfigure and upgrade skill-building spaces.
The budget for this project is $24.6 million through FY2031 |
| CCSF - Diego Rivera Theater with Mural |
This project would construct a new performing arts theater. The black box theater will make possible credentialed programs not currently available. The theater will be the future home of the Diego Rivera Pan American Unity mural.
The budget for this project is $95.7 million through FY2031 |
| CCSF - STEAM Center |
This project will build a multi-story facility to anchor programs for the Science Technology Engineering Arts and Math (STEAM) disciplines demanded by students. Also, new class spaces and offerings will help students gain hands-on learning experiences needed to secure good-paying jobs.
The budget for this project is $151 million though FY2031 |
| CCSF - Student Success Center |
This project will consolidate over 30 student development programs such as academic counseling, tutoring, career center, and transfer center. Improved access to services is key to increasing and maintaining future enrollment. The entire student body will be better served, especially historically marginalized student populations.
The budget for this project is $126 million through FY2031 |
CCSF – Science, Arts and
Media Building Renovations |
City College will address high priority structural upgrades and facility renovations at the Science Hall Academic building, and the Creative Arts and Multi Media building.
The budget for these projects is $132.3 million though FY2031 |
| CCSF - New Child Care Center |
This project will replace the current onsite childcare center, currently located in a temporary portable structure, with a facility that better serves faculty, staff and student families.
The budget for this project is $11.5 million through FY2031. |
SFUSD – Various Modernization, Expansion,
and Seismic Improvement Projects |
SFUSD has several long-standing seismic deficiencies and deferred maintenance needs. In addition, current demographic projections anticipate that SFUSD enrollment will grow by between 7,400 and 16,000 new students over the next 10 years, and this growth will require the expansion of current schools, as well as the possible construction of new schools. Also, SFUSD plans to continue making improvements for greater building efficiency, sustainability, and education-minded design.
This wide range of projects will be funded primarily by the $744 million 2016 SFUSD G.O. Bond and a planned $1 billion G.O. Bond in FY2022. Other funding sources may include state grants, impact fees, and other local sources. |