Economic + Neighborhood Development
OCII: Office of Community Investment and Infrastructure
TIDA: Treasure Island Development Authority
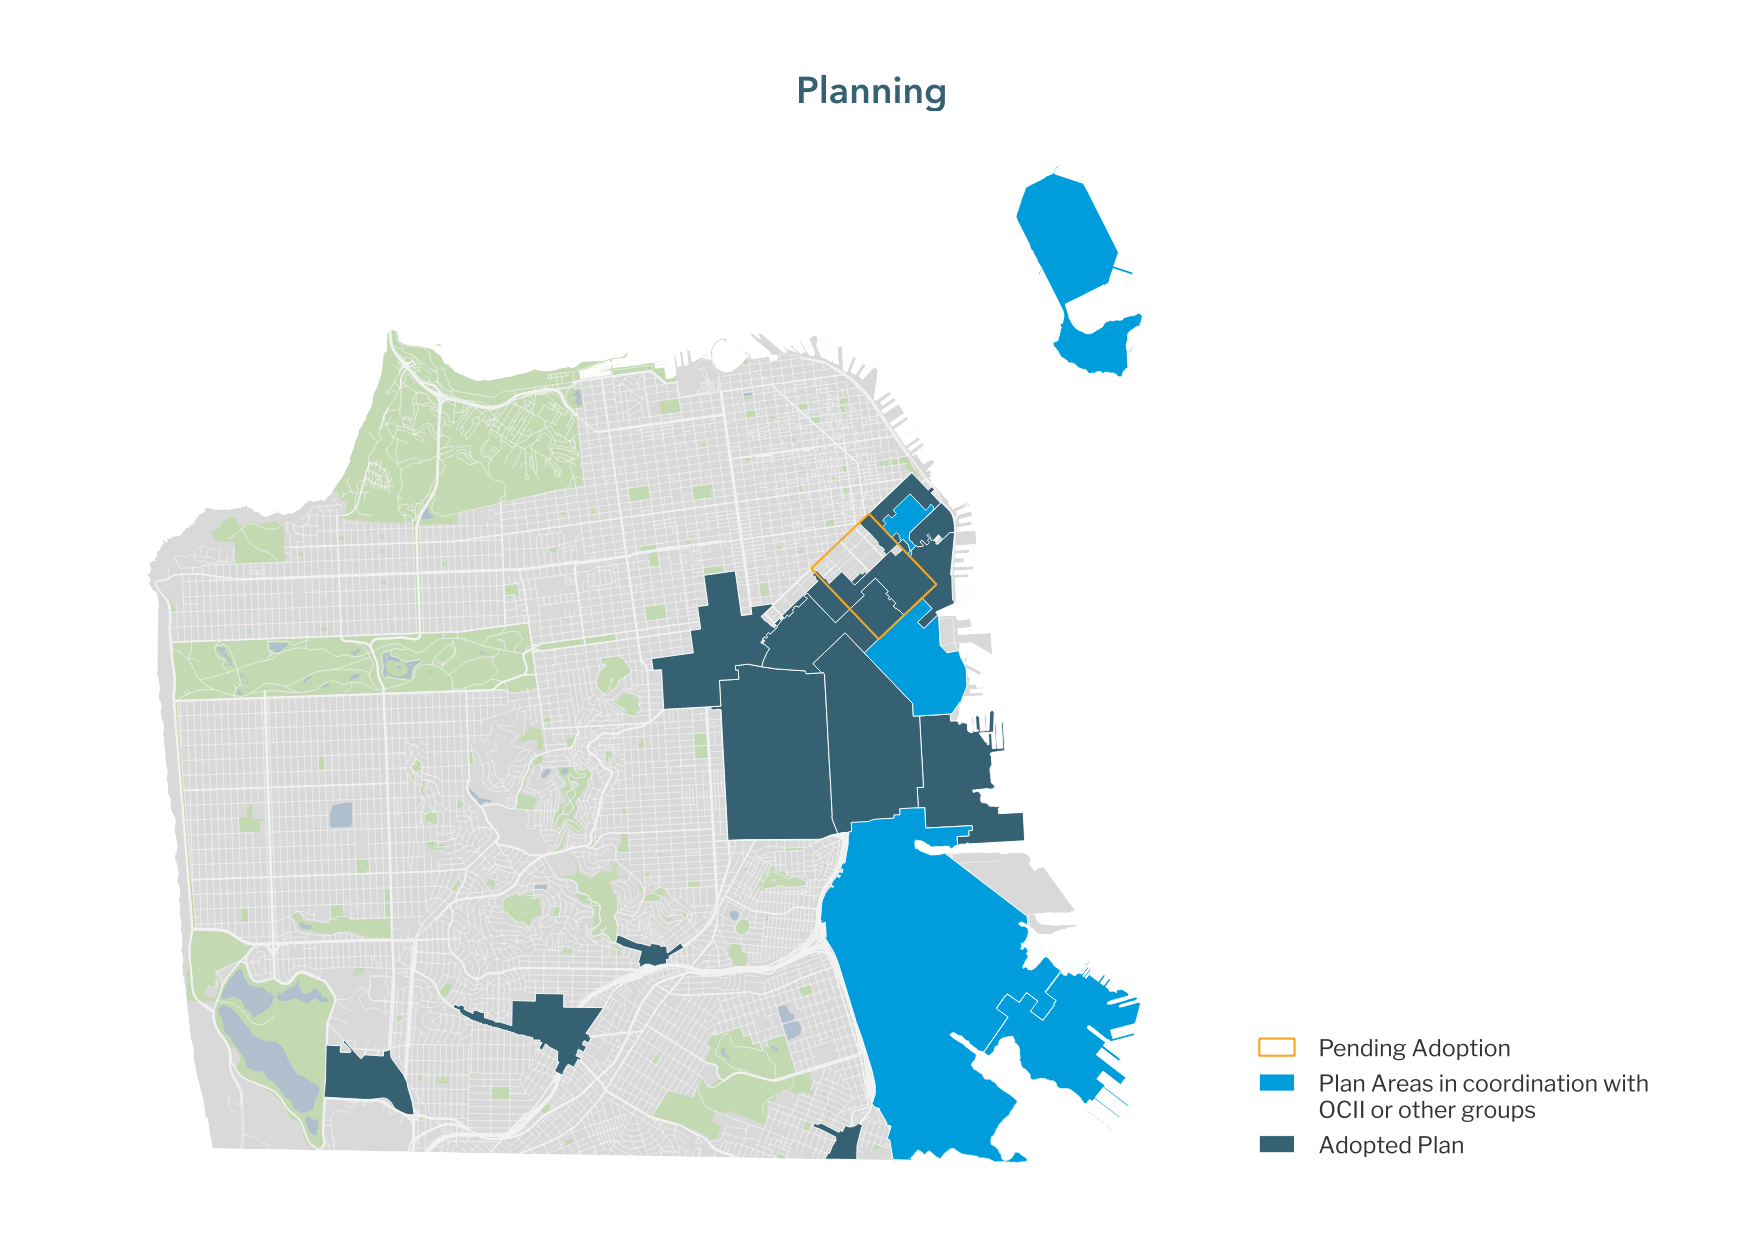
PLANNING: Impact Development Plan Areas
A place of unique neighborhoods, progressive values, and innovative industry, San Francisco is growing. The city’s creative culture and dynamic economy continue to draw new residents; as of 2015 the population was 864,816, up 11% from 2000. Plan Bay Area, developed by the Association of Bay Area Governments, projects San Francisco to grow by 90,000 housing units and 190,000 jobs by 2040. As the city’s density increases, having sufficient infrastructure to support all residents in all neighborhoods becomes more challenging but also more important.
Real estate developments along the city’s waterfront, the creation of new neighborhoods, and preparing existing neighborhoods for anticipated growth will increase the City’s infrastructure portfolio along with its tax base. Eastern Neighborhoods, Mission Bay, Candlestick Point, and Hunters Point Shipyards are just a few of the high-growth areas changing the face of San Francisco. Many of these developments and projects have distinctive funding mechanisms, including dedicated development fees and developer agreements that target improvements in areas of especially high growth. These projects seek to create well-planned, safe places to live, travel, work, and play.
While many things contribute to the local economy, this chapter includes departments and programs whose primary objectives are to improve San Francisco’s wide-ranging economic base and plan for its future growth.
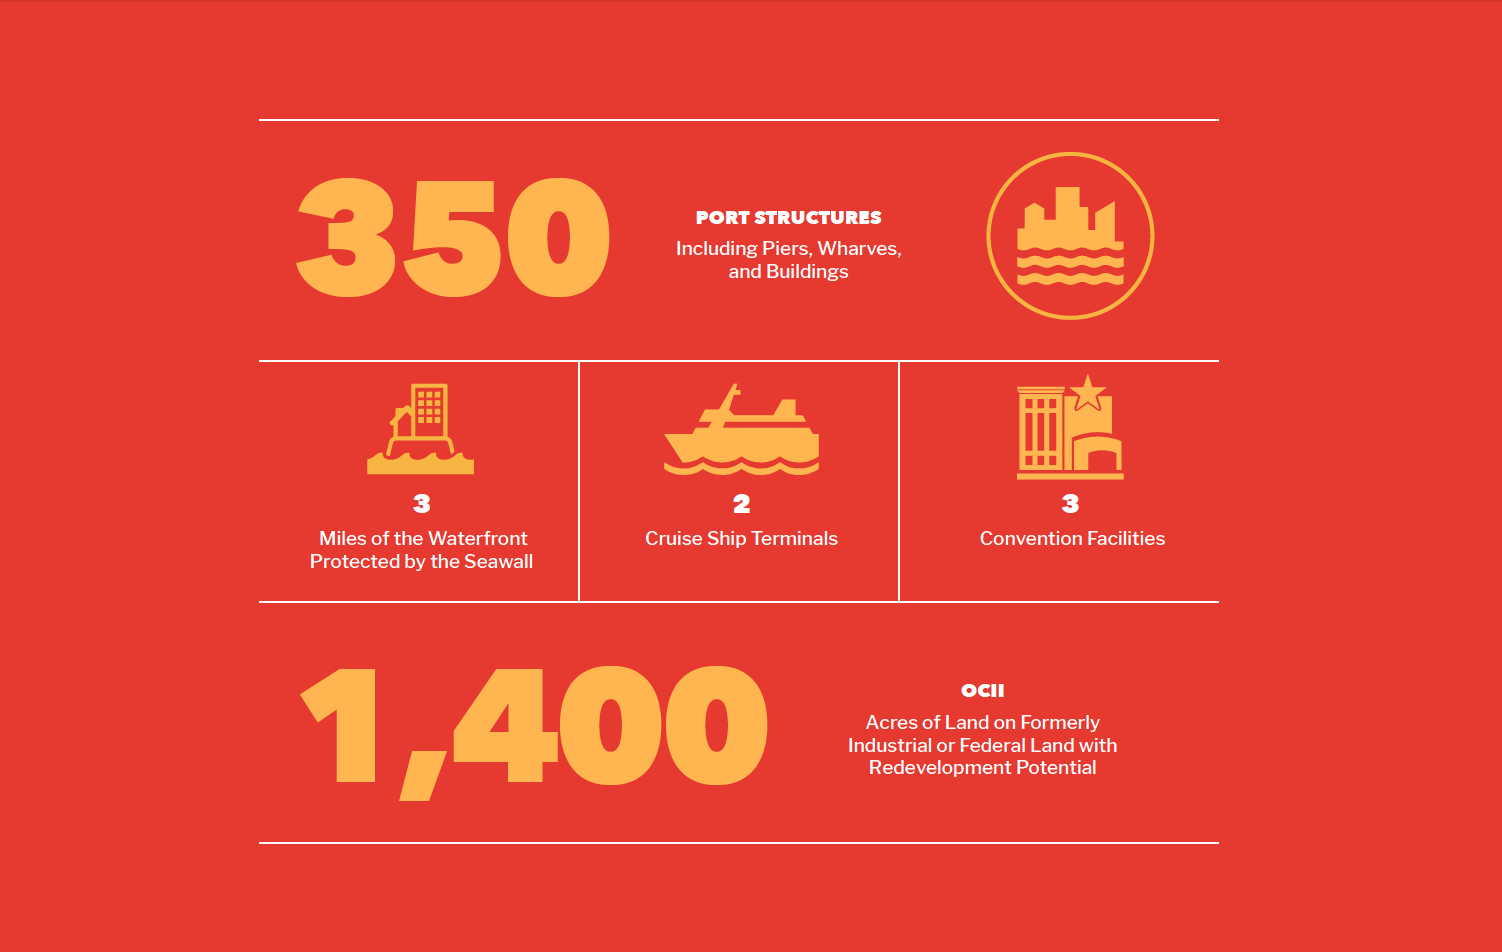
Port of San Francisco
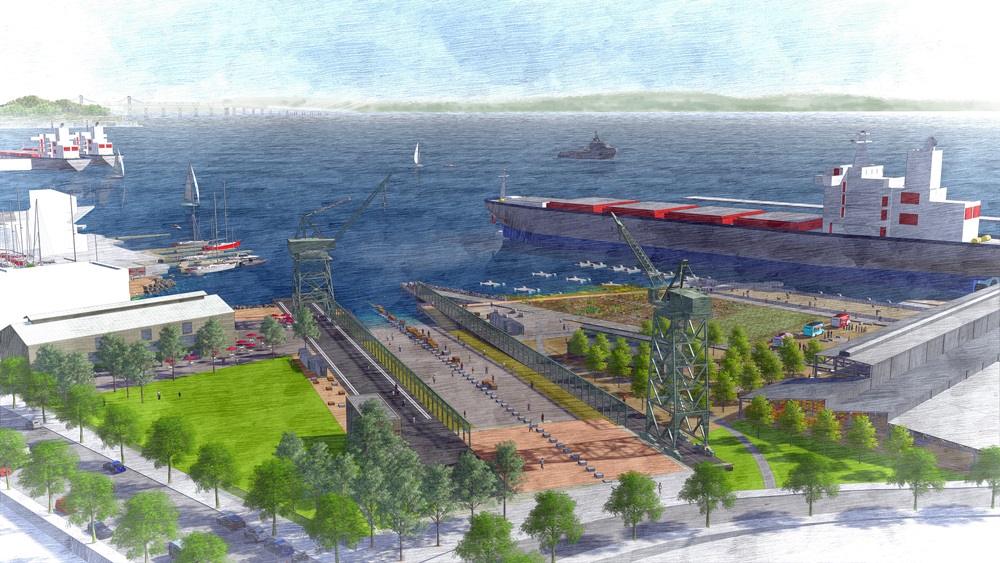
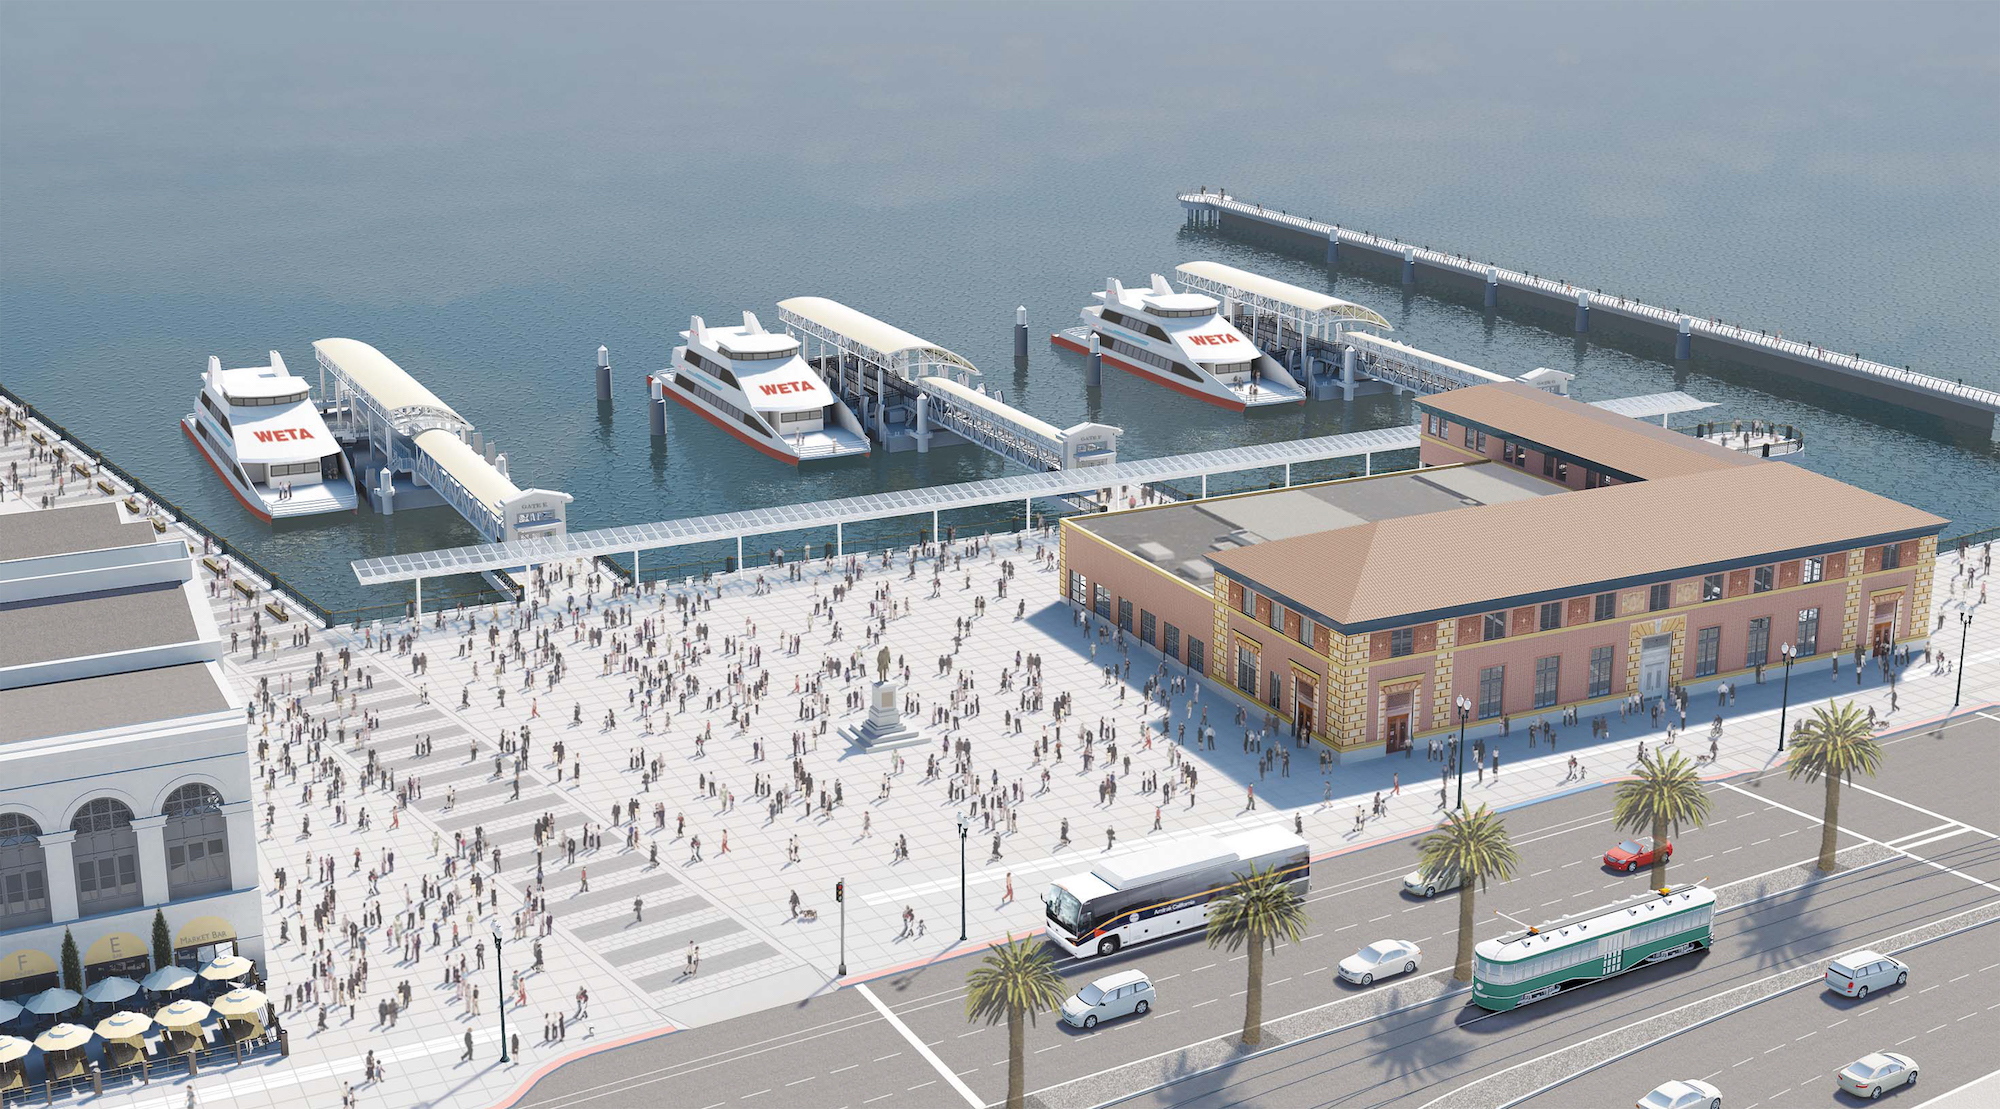
The Port of San Francisco is responsible for the 7.5 miles of San Francisco waterfront adjacent to San Francisco Bay. The Port manages, maintains, develops, markets, and leases all of the property in this area. The Port’s operating portfolio is composed of approximately 580 ground, commercial, retail, office, industrial, and maritime leases, including leases of many internationally recognized landmarks such as Fisherman’s Wharf, Pier 39, the Ferry Building, and AT&T Park, home of the San Francisco Giants baseball team.
Port lands must be used consistently with public trust principles for the benefit of all California citizens, to further navigation and maritime commerce, fisheries, public access and recreation, environmental restoration, and commercial activities that attract the public to the waterfront. Urban waterfront developments, including the new Southern Bayfront neighborhood developments proposed in the Mission Rock, Orton, and Forest City projects require detailed coordination, review, and approval of many government agencies. In recent years, the Port has also secured State legislation to allow non-trust uses of specified Port lands and created Infrastructure Financing Districts to support waterfront improvements. Such advances were made possible by developing a common understanding with partner agencies of project objectives and implementation requirements to restore historic structures and improve the waterfront for maritime and public use and enjoyment.
The Port’s Waterfront Land Use Plan guides the integration of public and private investment to improve the waterfront for broad public use and enjoyment. It includes a comprehensive public access and open space plan that integrates with the Port's varied maritime industries, and offers opportunities for new public-private partnership projects.
Office of Community Investment and Infrastructure
The Office of Community Investment and Infrastructure (OCII) is the successor agency to the San Francisco Redevelopment Agency, which was dissolved in 2012 by order of the California Supreme Court. OCII is authorized to continue to implement the Major Approved Development Projects, which include the Mission Bay North and South Redevelopment Project Areas (Mission Bay), the Hunters Point Shipyard Redevelopment Project Area and Zone 1 of the Bayview Redevelopment Project Area (Shipyard/Candlestick Point), and the Transbay Redevelopment Project Area (Transbay). In addition, OCII continues to manage Yerba Buena Gardens before its formal transfer to the Real Estate Division in 2017.
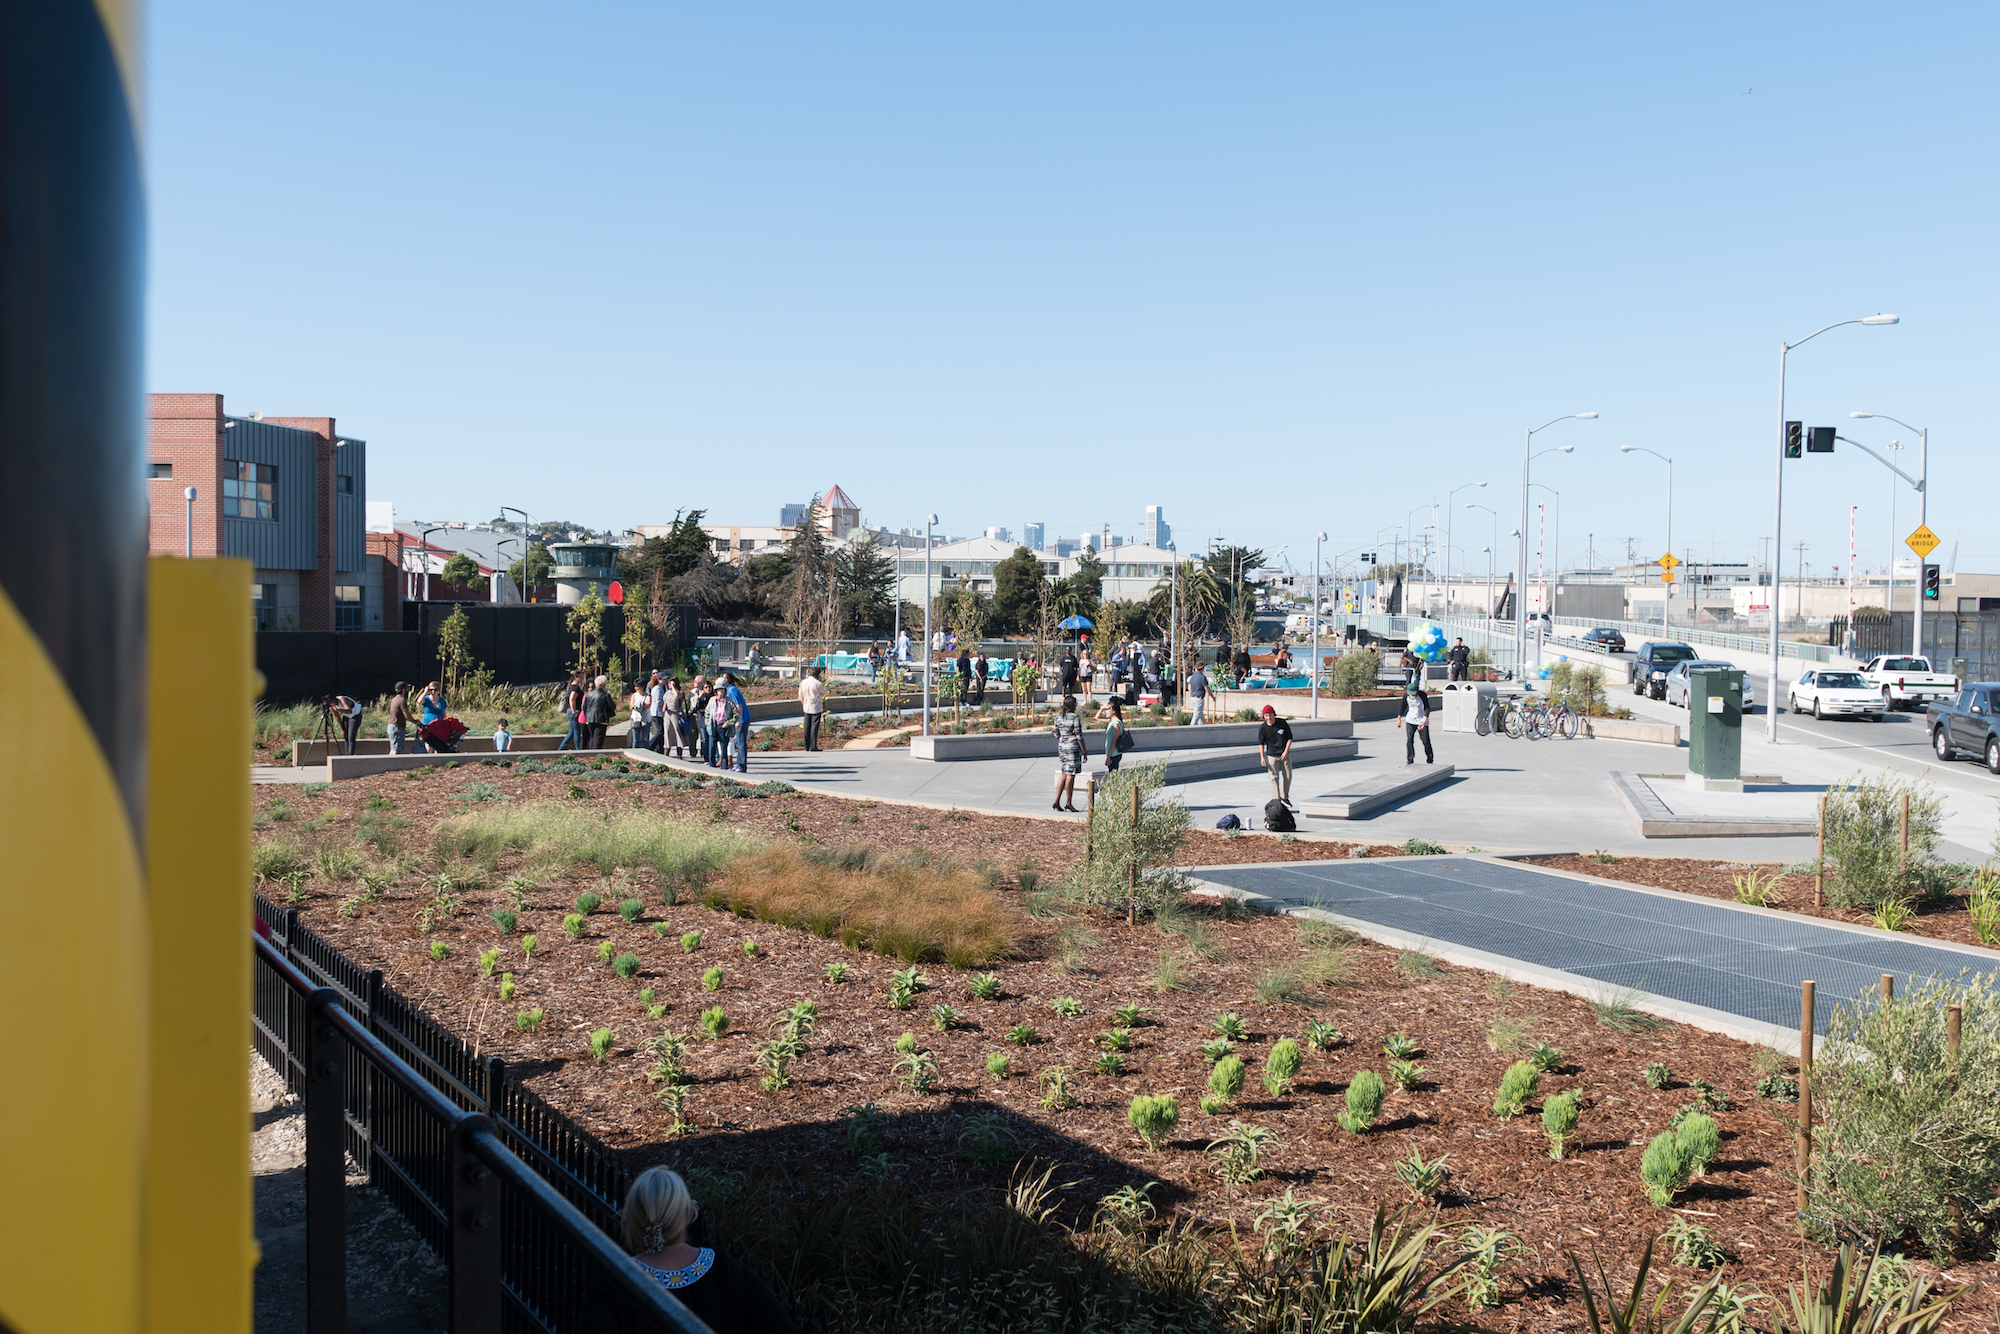
The Mission Bay development covers 303 acres of land between the San Francisco Bay and Interstate-280. The development program for Mission Bay includes market-rate and affordable housing; new commercial space; a new UCSF research campus and medical center; neighborhood-serving retail space; a 250-room hotel; new public open space; and myriad community facilities.
The Shipyard/Candlestick Point comprises of nearly 780 acres of abandoned and underutilized land along San Francisco’s southeastern Bayfront. These long-abandoned waterfront lands will be transformed into areas for jobs, parks, and housing. The development will feature up to 12,100 homes, of which nearly one-third will be affordable; nearly 900,000 square feet of neighborhood retail; and three million square feet of commercial space; and 26 acres of parks and open space.
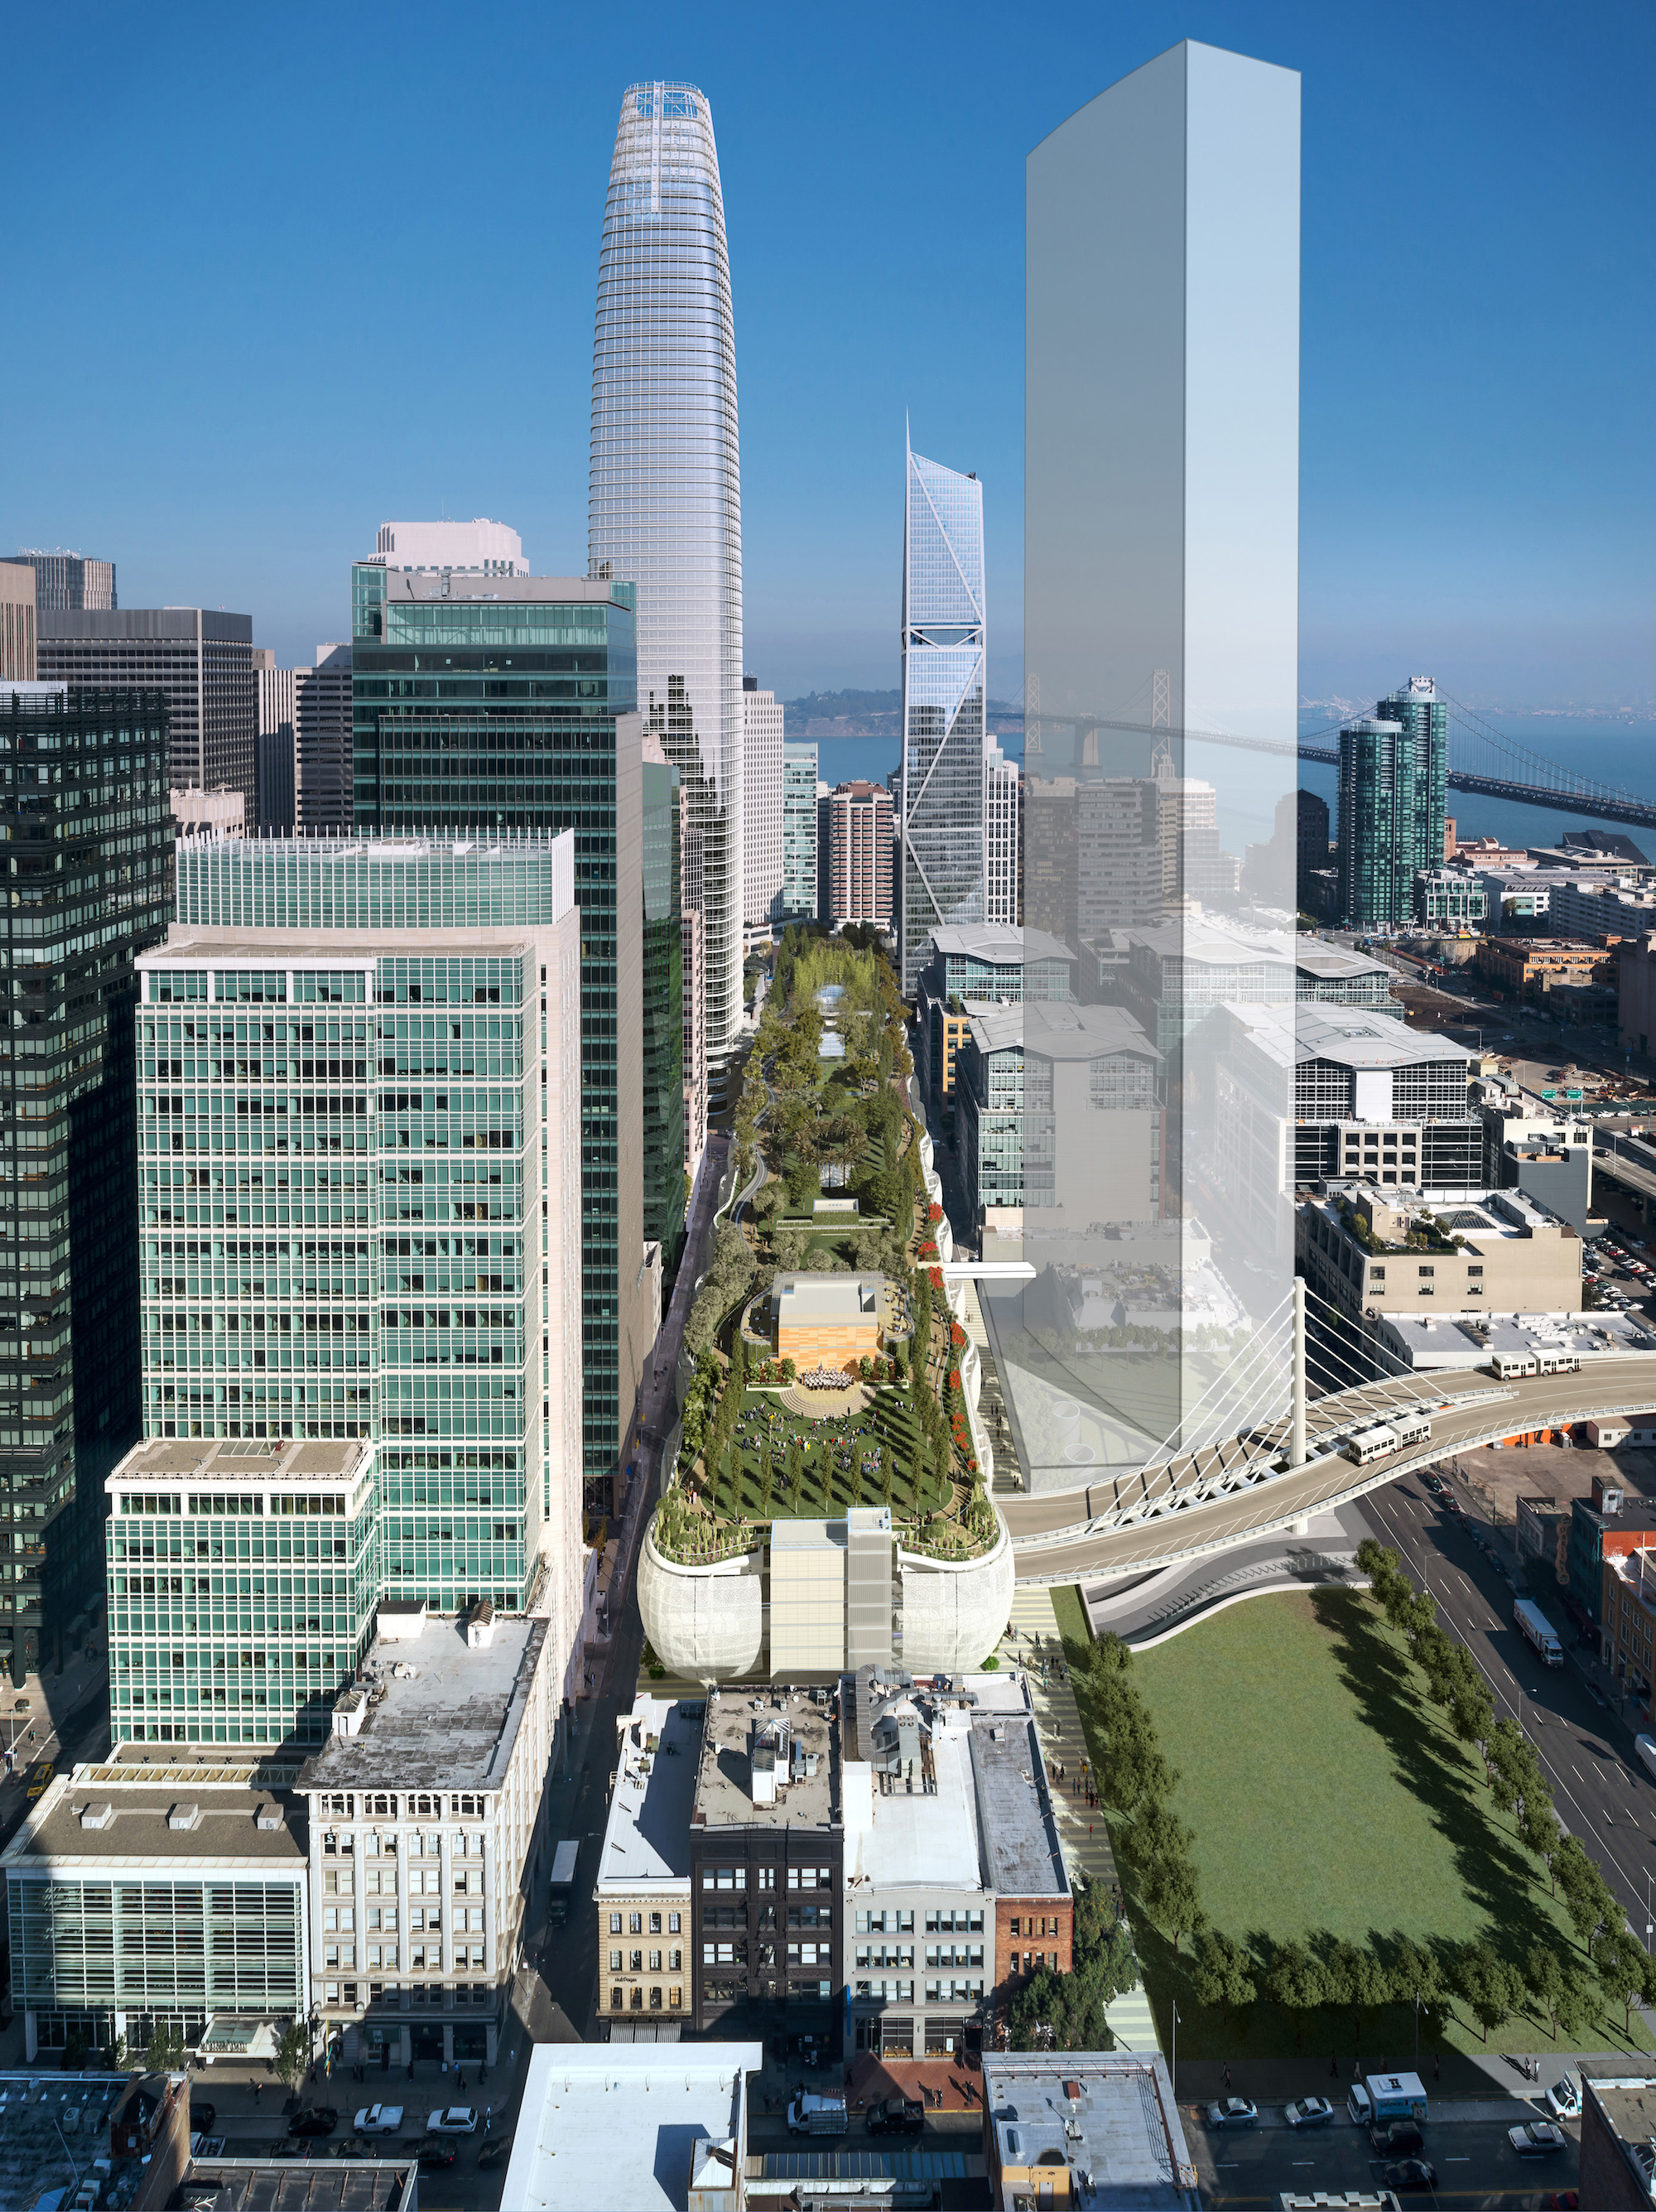
Transbay development includes the new Transbay Transit Center (TTC) and 10 acres of former freeway infrastructure, which OCII and the Transbay Joint Powers Authority (TJPA) are developing into a new, mixed-use neighborhood surrounding a state-of-the-art, multi-modal transit station. The TJPA is responsible for constructing, owning and operating the new TTC, and OCII is responsible for the development of the surrounding neighborhood. At full build-out, these publicly-owned parcels will be transformed into approximately 3,300 new housing units, including nearly 1,400 affordable units, three million square feet of new commercial development, and 3.6 acres of parks and open space.
In 2017 several assets will transfer from OCII to the Real Estate Division, consistent with OCII’s recently state-approved Property Management Plan. These assets include open space in Mission Bay, Yerba Buena Gardens, commercial and parking facilities in the Fillmore, and other properties. The transfer of Yerba Buena Gardens will be accompanied by a master operating lease with a newly formed non-profit (Yerba Buena Gardens Conservancy or YBGC) who will be responsible for maintenance and operations under a Board of Directors that will include appointments from the City & County of San Francisco and work with Real Estate staff to ensure proper management.
Treasure Island Development Authority
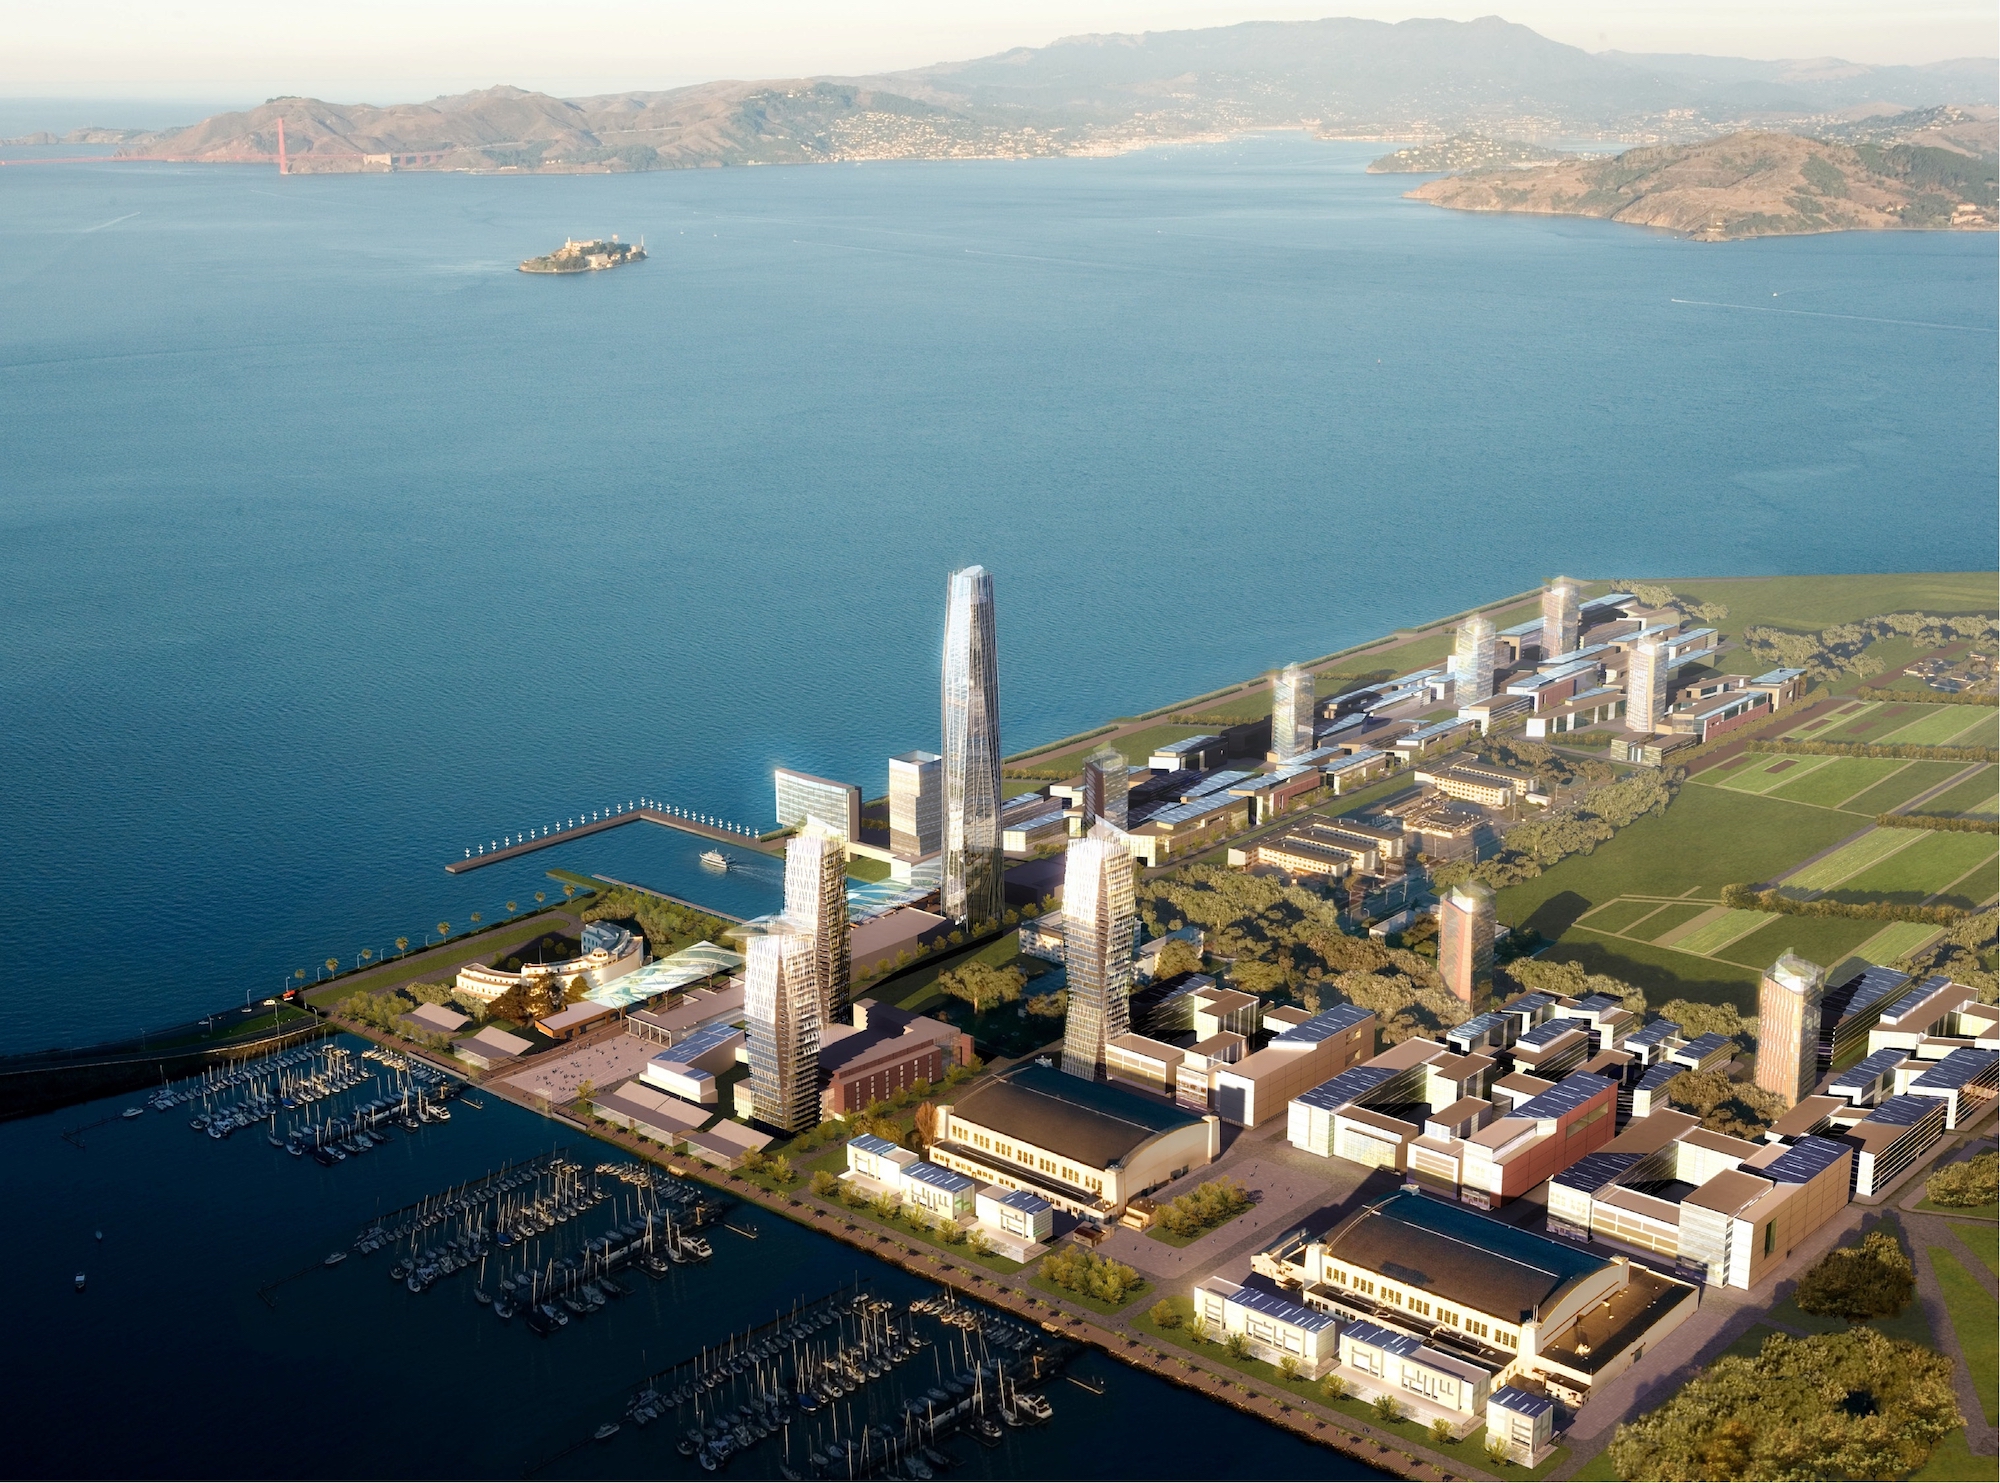
Treasure Island and Yerba Buena Island (“TI” and “YBI”; collectively, “the Islands”) are in San Francisco Bay, about halfway between the San Francisco mainland and Oakland. Treasure Island contains approximately 404 acres of land, and Yerba Buena Island, approximately 150 acres. In early 2003, the Treasure Island Development Authority (TIDA) and the Treasure Island Community Development, LLC (TICD) entered into an Exclusive Negotiating Agreement and began work on a Development Plan for the Islands.
The Treasure Island/Yerba Buena Island Development Project will create a new San Francisco neighborhood consisting of up to 8,000 new residential housing units, as well as new commercial and retail space. The Project will also feature new hotel accommodations and 300 acres of parks and public open space, including shoreline access and cultural uses. Transportation amenities being built for the project will enhance mobility on the Islands as well as link the Islands to San Francisco. These amenities will include new and upgraded streets and public byways; bicycle, transit, and pedestrian facilities; landside and waterside facilities for the existing Treasure Island Sailing Center; an expanded marina; and a new Ferry Terminal.
Planning Department – Neighborhood Development
Through various planning efforts, such as Community Plans, Redevelopment Plans, and Development Agreements, the Planning Department helps San Francisco to create a built environment that will support our own growth. The City has developed specific Area Plans where current development is concentrated. These Plan Areas are Balboa Park, Eastern Neighborhoods, Market Octavia, Rincon Hill, Transit Center, and Visitacion Valley. New infrastructure projects planned in these areas include improvements to transportation networks, streetscape enhancements to create inviting pedestrian corridors, new open space areas that provide access to recreation and sporting activities, and other categories of projects that will improve quality of life in these areas.