2022 - Affordable Housing - Services Area Facility Maps
06. Affordable Housing
Service Area Facility Maps
| Programs / Projects (Dollars in Thousands) |
FY 2022 | FY 2023 | FY 2024 | FY 2025 | FY 2026 | FY 2027 - 2031 | Plan Total | |
| SPENDING PLAN | 4 | 5 | 6 | 7 | 8 | 14 | 15 | DEFERRED |
| Mayor's Office of Housing and Community Development | 256,003 | 484,469 | 247,145 | 254,529 | 51,210 | 351,900 | 1,645,256 | 9,343,671 |
| Office of Community Investment and Infrastructure | 117,440 | 227,110 | - | 121,768 | 3,520 | 209,400 | 679,238 | |
| Treasure Island | 93,500 | 193,000 | - | 162,000 | - | 397,000 | 845,500 | |
| Total | 466,943 | 904,579 | 247,145 | 538,297 | 54,730 | 958,300 | 3,169,994 | |
| REVENUES | ||||||||
| 2019 Affordable Housing G.O. Bond | 175,000 | - | 175,000 | - | - | - | 350,000 | |
| 2024 Affordable Housing G.O. Bond | - | - | - | 160,000 | - | - | 160,000 | |
| Federal | 4,137 | 7,350 | 6,350 | 7,350 | 6,350 | 34,750 | 66,287 | |
| HOPE SF Certificates of Participation | - | - | - | 34,000 | - | 34,000 | 68,000 | |
| Housing Trust Fund | 63,563 | 28,089 | 29,589 | 31,589 | 32,000 | 160,000 | 344,830 | |
| OCII Bonds | 25,680 | 226,148 | - | 103,377 | 3,520 | 209,400 | 568,125 | |
| Other Local | 365,422 | 147,287 | 16,386 | 158,893 | 27,504 | 233,624 | 949,116 | |
| State | 12,000 | 17,000 | - | 12,000 | - | 36,000 | 77,000 | |
| Treasure Island Debt | 7,000 | - | - | 8,000 | - | 24,000 | 39,000 | |
| Total | 652,802 | 425,874 | 227,325 | 515,209 | 69,374 | 731,774 | 2,622,358 | |
| Total San Francisco Jobs/Year | 2,924 | 1,907 | 1,018 | 2,308 | 311 | 3,278 | 11,746 | |
| Annual Surplus (Deficit) | 185,859 | (478,705) | (19,820) | (23,088) | 14,644 | (226,526) | (547,636) | |
| Cumulative Surplus (Deficit) | 185,859 | (292,846) | (312,666) | (335,754) | (321,110) | (547,636) |
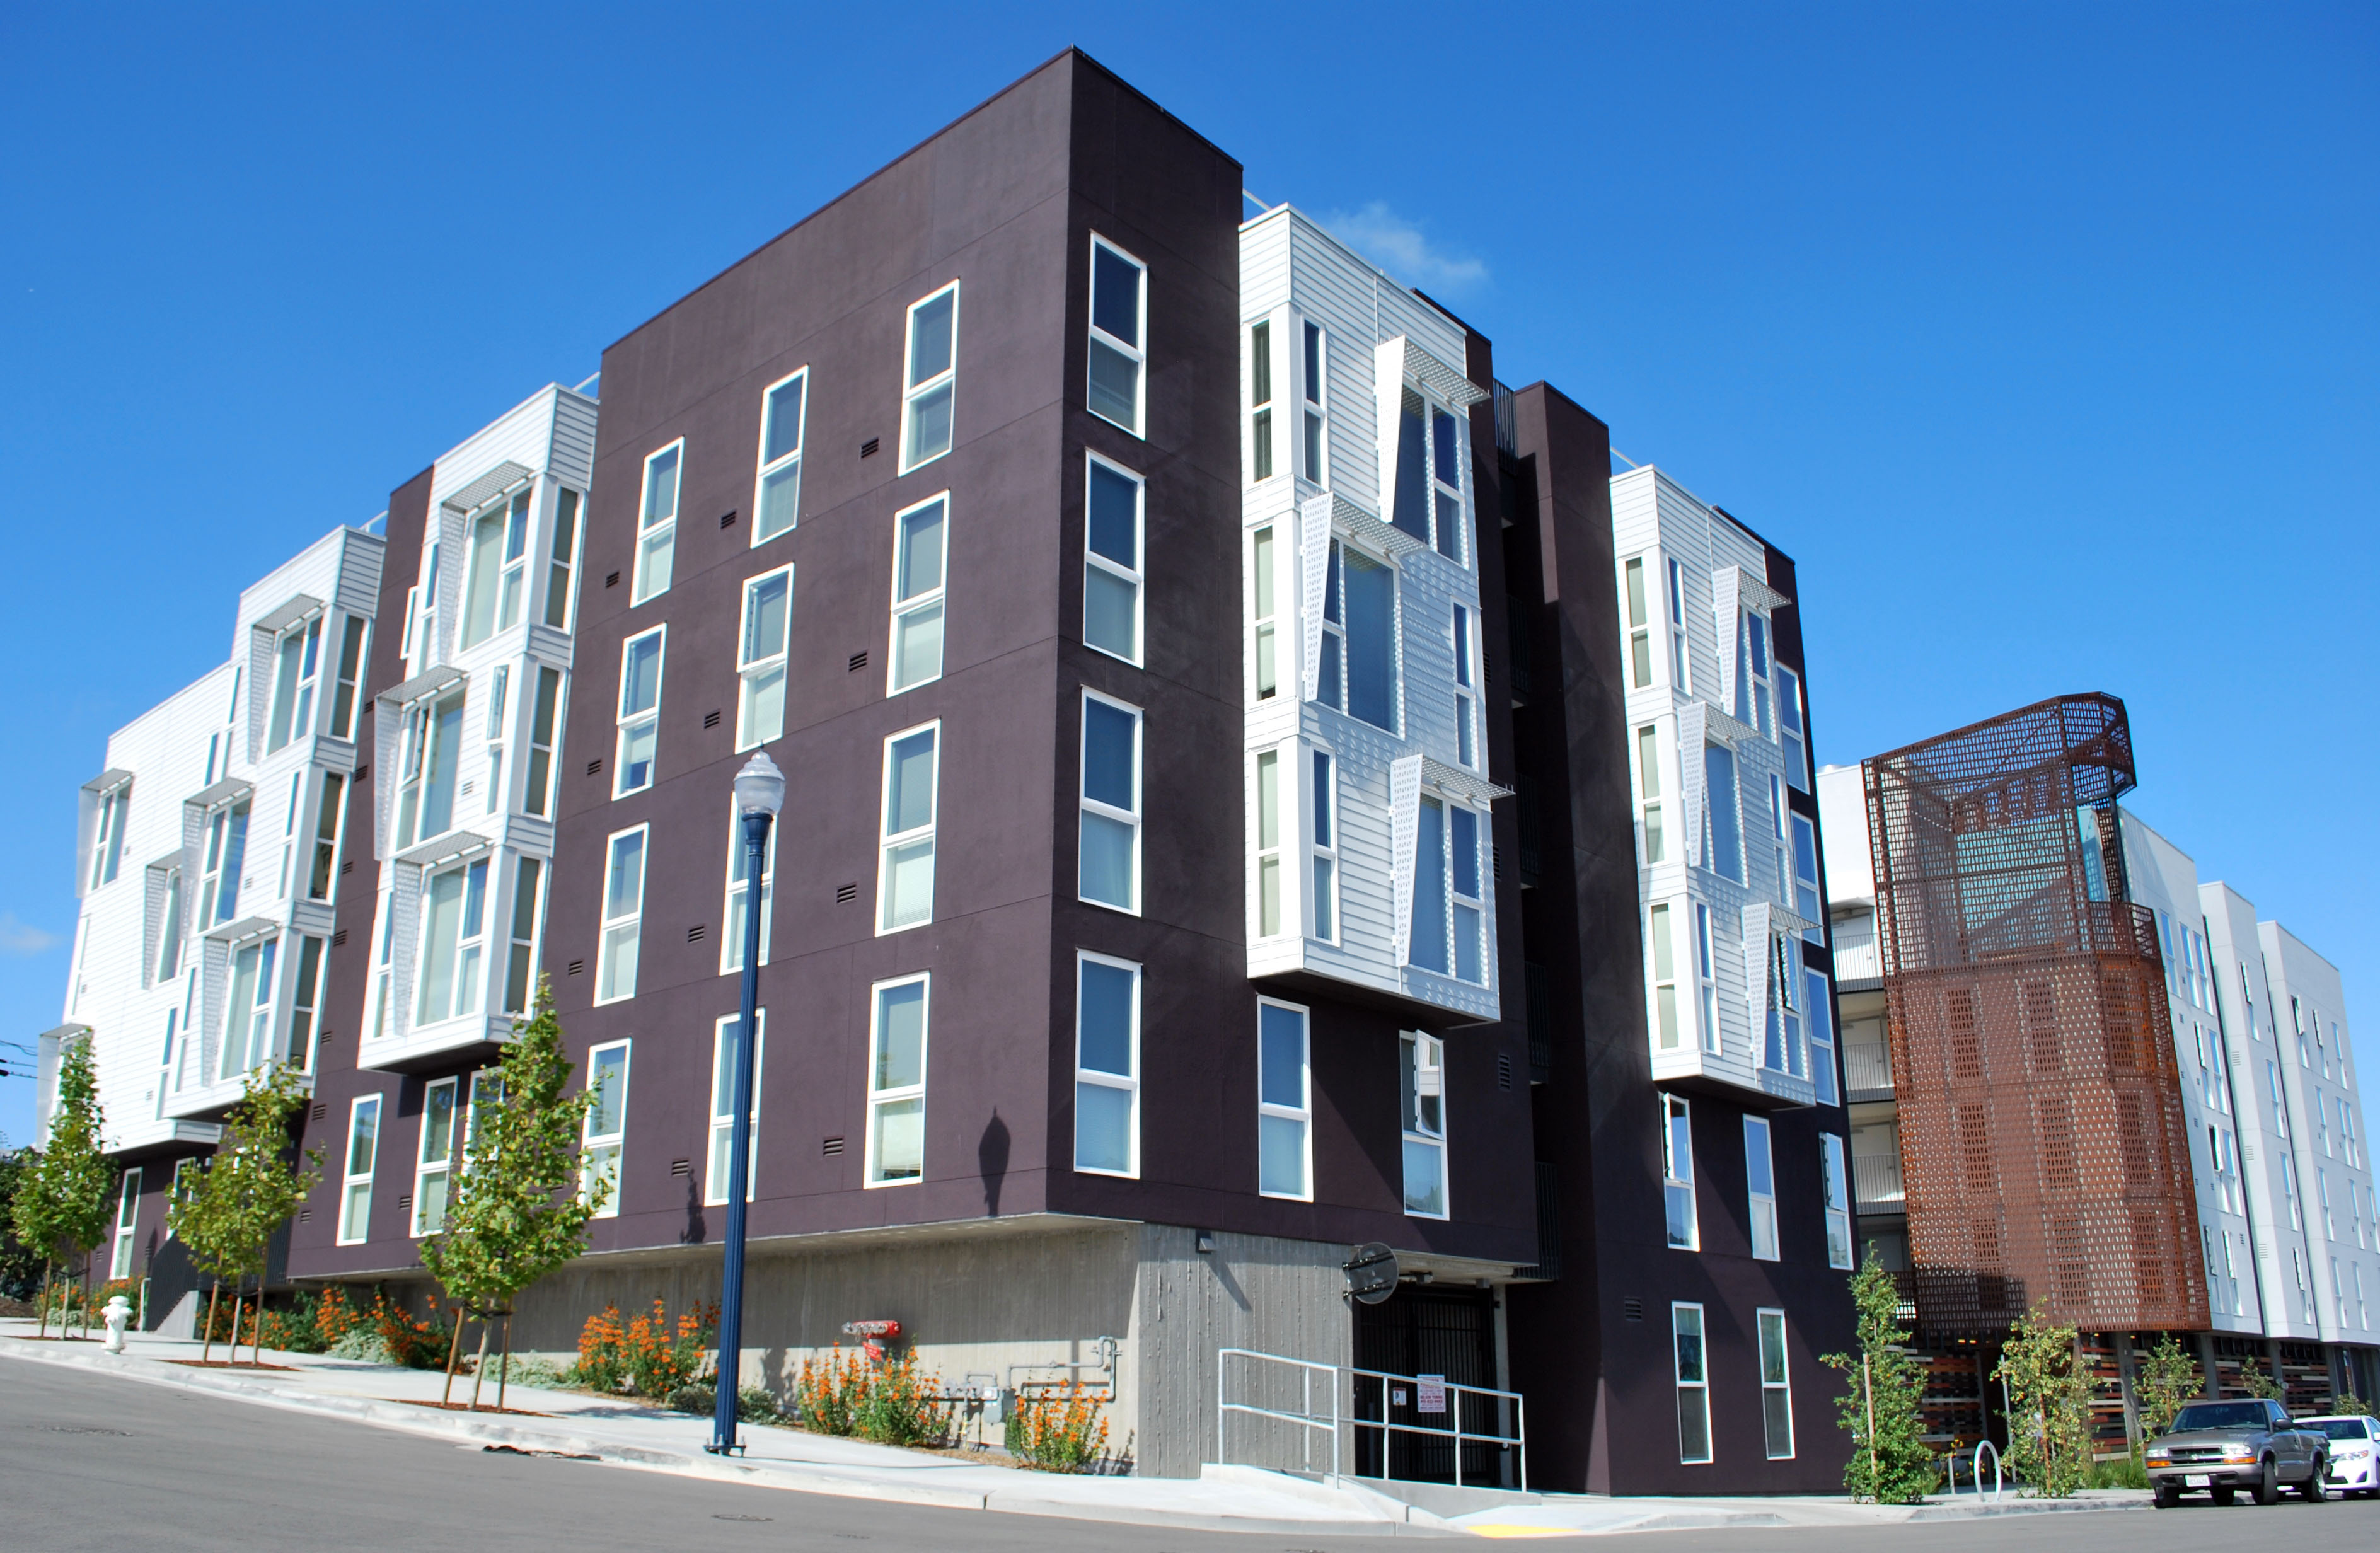
OCII Hunters Point Shipyard Block 49, Photo Credit: Maximilian Barnes
| Project Name | Description |
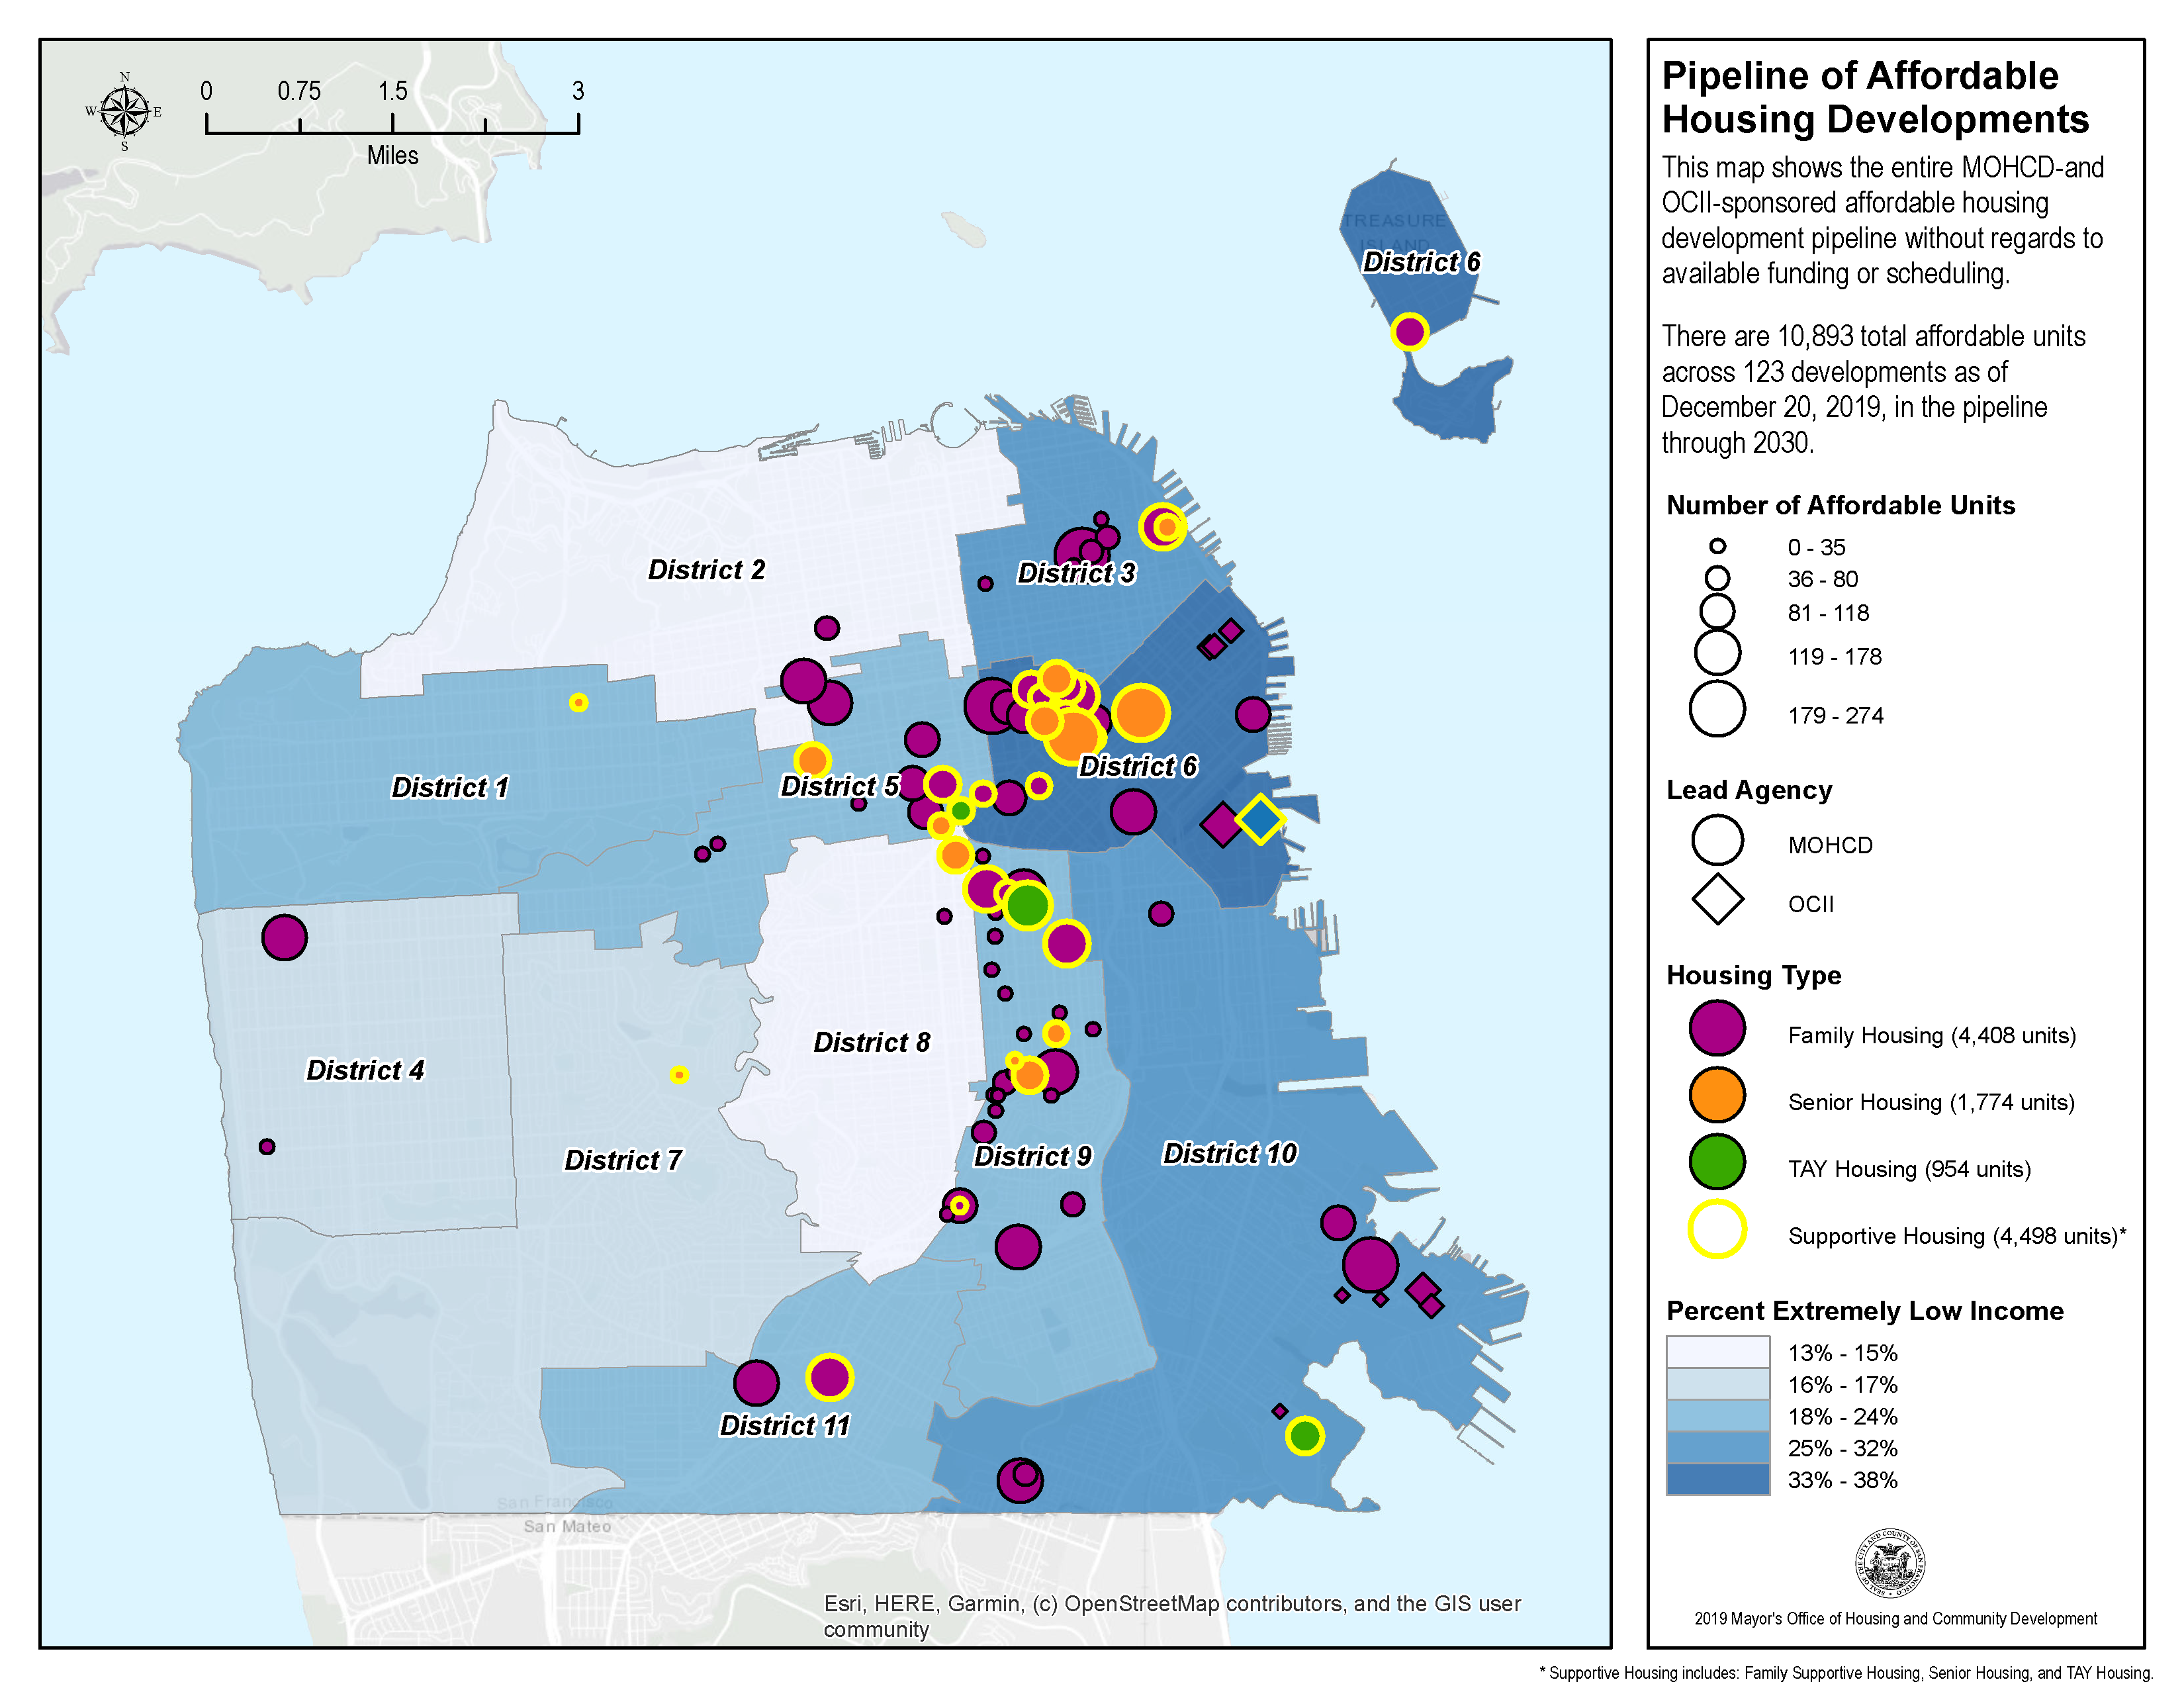
| MOHCD – Future Pipeline Projects | MOHCD’s planned projects meet key criteria for investment, including scale, readiness, proximity to public transit, ability to leverage non-City sources of funding, and location in neighborhoods that have low production and/or high displacement. Phased projects are multi-year, multi-phase projects in a development area that include housing and infrastructure development. Together the pipeline for these projects represents an ambitious and significant commitment to producing more affordable housing in San Francisco. However, more units beyond these are needed, and the City will need to pursue opportunities and continue to prioritize affordability into the future. Emerging projects are opportunities to expand MOHCD’s pipeline that are not currently accounted for in MOHCD’s pipeline and allocations budget. MOHCD must be nimble and opportunistic in acquisition of properties that come on the market, as funding is available, and especially if the acquisition is below market value. It is important to note that the Housing Need targets represented in this chapter's financial tables represent a continuation of the City's level of effort during 2015-2019, where City subsidies have supported 82% of very low income, 54% of low income, and 23% of moderate income deed-restricted production. Based on these spending levels, the City is projected to meet approximately 50% of the very low income, 82% of the low income, and 42% of the moderate income targets in the current 2014-2022 RHNA cycle. Non deed-restricted moderate income housing is produced primarily through the City’s ADU program. To meet 100% of the current RHNA targets, excluding the portion that is projected to be met through Inclusionary units, the total housing expenditure plan would need to increase by approximately $5.1 billion. Meeting this full RHNA allocation would likely require policy decisions outside the purview of the Capital Plan and would also depend on the contribution of Inclusionary units delivered through market rate production, which is extremely difficult to model, especially given the economic impact of the COVID-19 pandemic. Still, San Francisco acknowledges the full need and strives to deliver as much affordability as possible while meeting other urgent challenges in its public capital portfolio and other service obligations. |
| OCII – Phase II Hunters Point Shipyard | The work at Phase II of the Shipyard project is delayed due to the environmental testing and remediation work being done by the U.S. Navy. As a result, OCII funded affordable housing projects are similarly delayed. |
| TIDA – Mercy Housing & Catholic Charities Project | The second 100% affordable housing project on Treasure Island, developed by Mercy Housing in partnership with Catholic Charities, is in planning and building permit review. Project financing is expected to close in Q2 of CY 2021 with construction following in Q3. The 135-unit building will provide replacement housing for existing Catholic Charities and market rate residents on Treasure Island as required by program transition plans. |
| TIDA – Community Housing Partnership & Health RIGHT 360 Projects |
The third and fourth 100% affordable housing developments are planned to be constructed in partnership with Community Housing Partnership and HealthRIGHT360 and to transition residents of those agencies’ facilities and programs to permanent locations on Treasure Island. The sequence and schedule for these developments will be determined by the availability of funding. Because HealthRIGHT360 operates treatment and transitional housing programs, many funding sources for the construction of permanent affordable housing will not be available to finance the construction of the HealthRIGHT360 building. |
| TIDA – Inclusionary Affordable Developments | TICD has multiple rental and condominium projects in the second subphase area on Treasure Island in various stages of planning and building permit review and are expected to start construction between 2021-2023. These buildings will include for-rent and for-sale inclusionary affordable units. Street Improvement Permit (SIP) documentation and subdivision maps for the third subphase area are under review by City agencies. With the expectation that the SIP will be issued and subdivision map approved in Q1 2021, TICD has begun the demolition of structures within the subphase area. This subphase area will include four additional TIDA parcels for the development of affordable housing. |
| OCII – Mission Bay South Block 9 & Hunters Point Shipyard Blocks 52/54 |
OCII has several projects in various stages of predevelopment and early construction. Mission Bay South Block 9 started construction in summer 2020 and will included 141 units for formerly homeless individuals. Hunters Point Shipyard Blocks 52/54 is one family rental project on two nearby sites will total 112 units and is expected to start construction in 2022. Mission Bay South Block 9a will be a 148 units affordable homeownership project and is in schematic design and will start construction in mid-2022. Hunters Point Shipyard Phase 1 Block 56 is a 73- unit family rental project, and will start construction in mid-2022. Transbay Blocks 2 East and 2 West will include approximately 169 senior units and 80 family rental units; developer selection and predevelopment funding is expected early in calendar year 2021. |
| Project Name | Description |
| Balboa Reservoir | The City identified the Balboa Reservoir site as a priority for housing development under the Public Lands for Housing program. The Public Utilities Commission has jurisdiction of the site and has entered into an Exclusive Negotiation Agreement with the selected development team. The project will consist of approximately 1,100 units of housing, of which 50% would be market-rate. The developer will fund and construct 66.7% of the affordable units with the City providing financing for the remaining 33.3% of the affordable units. The populations that will be served include very low and low income households up to 80% AMI and moderate income households, including educator households, up to 130% AMI. All of MOHCD’s local sources of funding are eligible for new production like that planned for Balboa Reservoir, with the exceptions noted in the planned very low and low income and moderate income housing program description. |
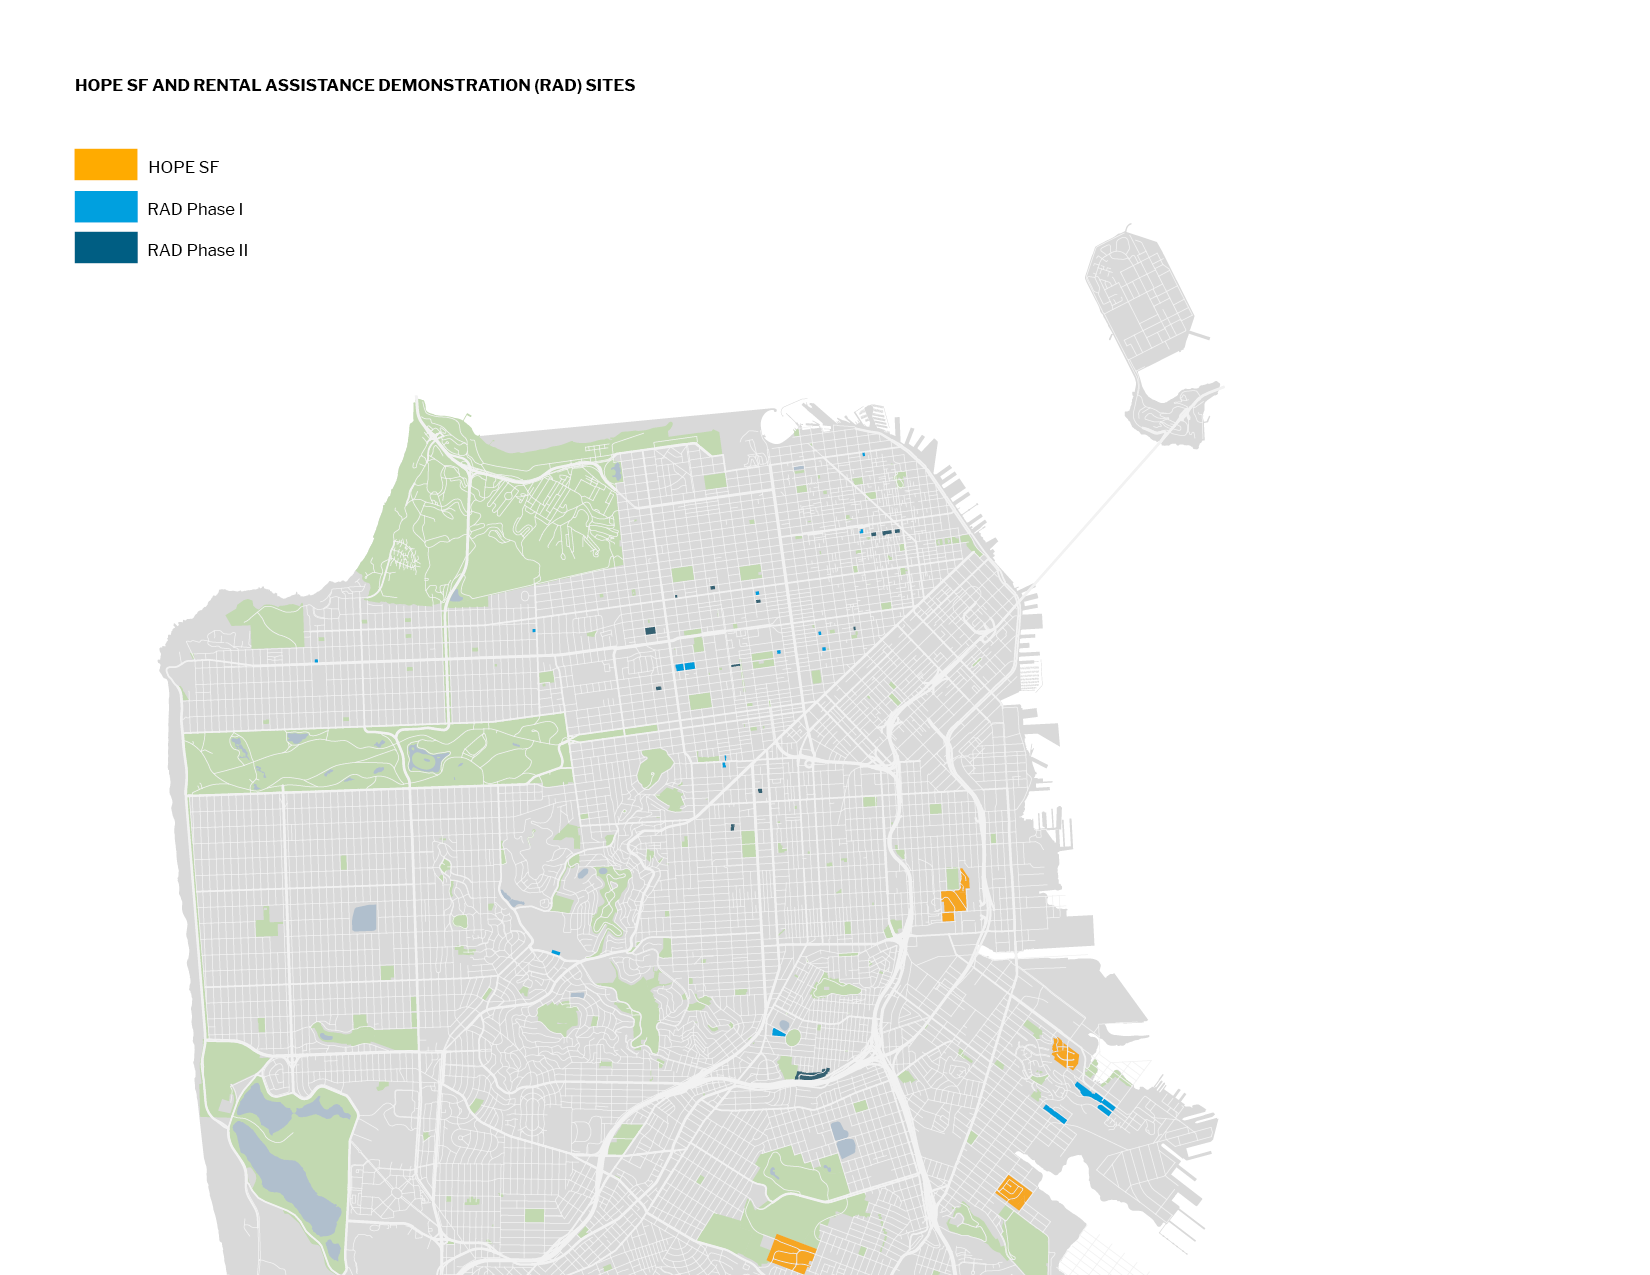
| HOPE SF | The City has made a commitment to rebuild four public housing developments in the southeast region that have physically deteriorated: Alice Griffith, Hunters View, Potrero, and Sunnydale (see discussion in Economic and Neighborhood Development chapter). HOPE SF will replace the existing 1,900 units one-for-one and add another 5,300 units to transform long underserved communities into vibrant, mixed income neighborhoods. The populations served include existing public housing households, who are guaranteed a right to return to the rebuilt housing, and new very low and low income households up to 60% AMI. An example of a HOPE SF project in the pipeline is Sunnydale Block 3. This project will include approximately 170 units, of which 127 will be set aside for existing public housing residents with a right to return, and 52 will be set aside for new low income households up to 60% AMI. The project includes a mix of 1-bedrooms, 2-bedroom, 3-bedroom, and 4-bedrooms. Construction will start in 2022 and is expected to be complete by 2024. The majority of MOHCD’s sources of funding are eligible for HOPE SF, with the exception that impact fees can only be used on new units and not replacement units. The total need for HOPE SF is estimated at $750 million over the next 10 years, in addition to the development costs that are already accounted for in the Economic and Neighborhood Development chapter. |
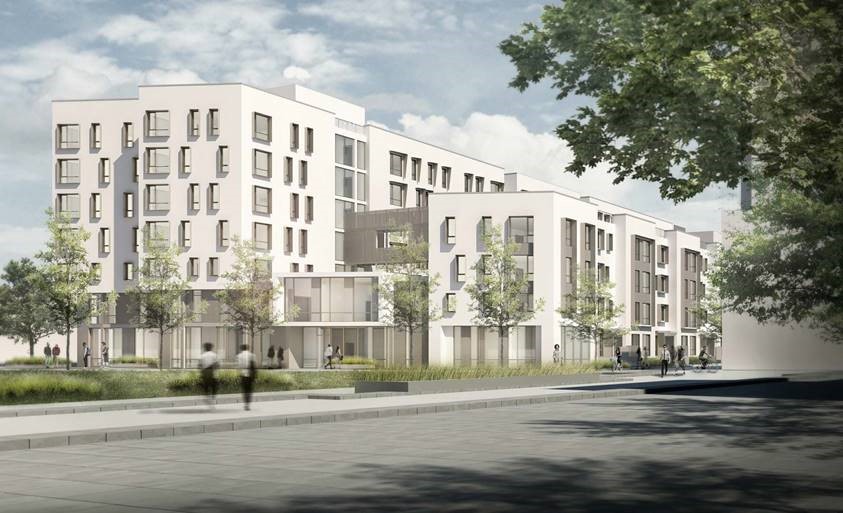
TIDA C3.1 Rendering (4), Photo Credit Paulett: Taggart Architects
Production needs for very low, low and moderate-income housing total approximately $7B. The Plan allocates $844M towards these needs.
| Project Name | Description |
| MOHCD – Very Low and Low Income Housing | MOHCD’s planned projects include very low and low income housing that serve households between 0-80% AMI. The vulnerable populations served include formerly homeless individuals and families, transitional age youth, seniors, and families. An example of a very low and low income project in the pipeline is 730 Stanyan Street. This project will include approximately 120 units for individuals and families earning from 30-80% AMI, including formerly homeless young adults. The building will include a mix of studios, 1-bedrooms, 2-bedrooms and 3-bedrooms, and a generous offering of neighborhood serving, ground floor uses. Construction is expected to begin in 2022 with completion in 2024. The majority of MOHCD’s sources of funding are eligible for new production for very low and low income households, although some impact or Area Plan fees are limited to use in specific geographies, No Place Like Home funds from the State are limited to use for chronically homeless individuals, and 60% of excess ERAF allocated to MOHCD could be used for new construction. The estimated need to continue the City's level of effort in these categories according to the draft 2022-2031 RHNA targets for the next cycle is approximately $6.6 billion through FY2031. |
| MOHCD – Moderate Income Housing | MOHCD’s planned projects include moderate income housing that serves households between 80-120% AMI. The populations served include moderate income individuals and families and educators. An example of a moderate income project in the pipeline is 921 Howard Street. This project will include 203 units for individuals and families earning from 50-120% AMI, and it will include a mix of studios 1-bedrooms, 2-bedrooms and 3-bedrooms. Construction is expected to begin in mid-2021 with completion in 2023. Certain MOHCD sources of funding are eligible for production of moderate-income rental housing, including 60% of excess ERAF allocated to MOHCD, portions of the 2015 and 2019 General Obligation bonds, and the Housing Trust Fund, which allow for the acquisition, rehabilitation and new construction of rental units serving households up to 120% AMI. Additionally, the G.O. bonds allow for first-time homeownership assistance programs serving households up to 175% AMI and educators up to 200% AMI, and the Housing Trust Fund allows for first-time homeownership assistance programs for households up to 120% AMI. The estimated need to continue the City's level of effort in these categories according to the draft 2023-2031 RHNA targets for the next cycle is approximately $353 million through FY2031. |
| TIDA - Treasure Island Development Authority | The Disposition and Development Agreement (DDA) Housing Plan and Financing Plan for Treasure Island set forth a strategic framework for funding 2,173 of the housing units to be affordable units. Of these, 1,866 units are to be developed by the City with the balance to be inclusionary units constructed by Treasure Island Community Development (TICD). Due to an escalation in costs since 2011, an increase in the number of affordable units to be delivered, and other changes, revised funding strategies will be required to close the resultant funding gap. TIDA’s current Capital Plan focuses on financing the initial six 100% affordable housing developments encompassing an estimated 776 units and the HealthRIGHT360 residential treatment facilities. These projects should transition current residents of the island eligible for replacement housing and several hundred net new affordable units. |
| TIDA – The Bristol Project | Treasure Island Community Development (TICD) is developing market rate housing in the first subphase of development on Yerba Buena Island. The Bristol, a five-story 124-unit building with 14 inclusionary affordable units, is currently in construction. Other market-rate flats and townhomes on Yerba Buena Island are beginning construction. |
| OCII – Hunters Point Shipyard/Candlestick Point | Through FY2031, 1,394 affordable housing units in 14 projects will be in various development stages (predevelopment, construction, completion and lease up). The individual projects will consist primarily of family rental affordable housing for households earning up to 60% AMI. Some of the projects will include ground floor retail space and other related uses such as child care. Funding from OCII for these units through FY2031 is approximately $490 million. |
| OCII – Mission Bay South | Through FY2031, 445 affordable housing units in three projects will be in various development stages (predevelopment, construction, completion, and lease up/sales). 291 units are under construction and were funded prior to FY2022. The individual projects will consist of permanent supportive housing for adults, family rental affordable housing, and moderate-income homeownership housing. These projects will serve households earning from 30% to 110% AMI. Funding from OCII for 445 of these units through FY2031 is approximately $66 million. |
| OCII – Transbay Transit Center | Through FY2031, 323 affordable housing units in three projects will be in various development stages (predevelopment, construction, completion, and lease up). The individual projects will consist of senior rental housing and family rental affordable housing. These projects will serve households earning from 30% to 80% AMI. Some of the projects will include ground floor retail space and other related uses such as child care. Funding from OCII for these units through FY2031 is approximately $103 million. |
| SFHA – Disposition Projects | The Housing Authority is an important partner in the HOPE SF projects described in the Economic and Neighborhood Development chapter. To better support low-income residents in San Francisco, SFHA plans to convert the sites to Project-Based Vouchers, then transfer ownership and management to a non-profit developer entity. The increased rent subsidies from the vouchers will enable the private owners to secure the additional resources needed to complete full rehabilitations of the sites. A combination of this financing with a public land trust in the form of a long-term ground lease and local developers is a public-private partnership consistent with SFHA’s re-envisioning. This structure ensures long-term affordability and oversight through the lend-lease structure, access to new funds not available to SFHA, and improved housing conditions. SFHA is also working on dispositions of other properties: scattered sites, and Plaza East. Disposing of these properties will allow the flow of funding needed to enhance the quality of life for the residents. The Housing Authority is committed to protecting the rights of the current residents in these units and meeting all requirements pursuant to HUD’s public housing regulations. |
| SFHA – Rental Assistance Demonstration (RAD) Program |
On Phases 1 and 2, conversion of 3,480 public housing units to Project Based Vouchers (PBV) under RAD addressed critical immediate and long-term rehabilitation needs and preserving affordability for very low-income residents by increasing revenue and by attracting new capital. In addition to RAD, the financing strategy as contemplated by the Plan relies upon HUD’s Section 18 Disposition/Demolition program which has permitted the Authority to obtain additional Housing Choice Voucher/Section 8 vouchers to supplement the RAD program. On a third phase of RAD conversions for the HOPE VI sites, an additional 425 units were transferred to the new program by December 2020. All 39 RAD projects utilize private debt, equity generated by the Low-Income Housing Tax Credit program, and soft debt from the Authority and the City and County of San Francisco. This approach has resulted in a $2.3 billion conversion project and generated $830 million in construction and rehabilitation work that benefits the tenants of Authority sites while preserving existing affordability. |
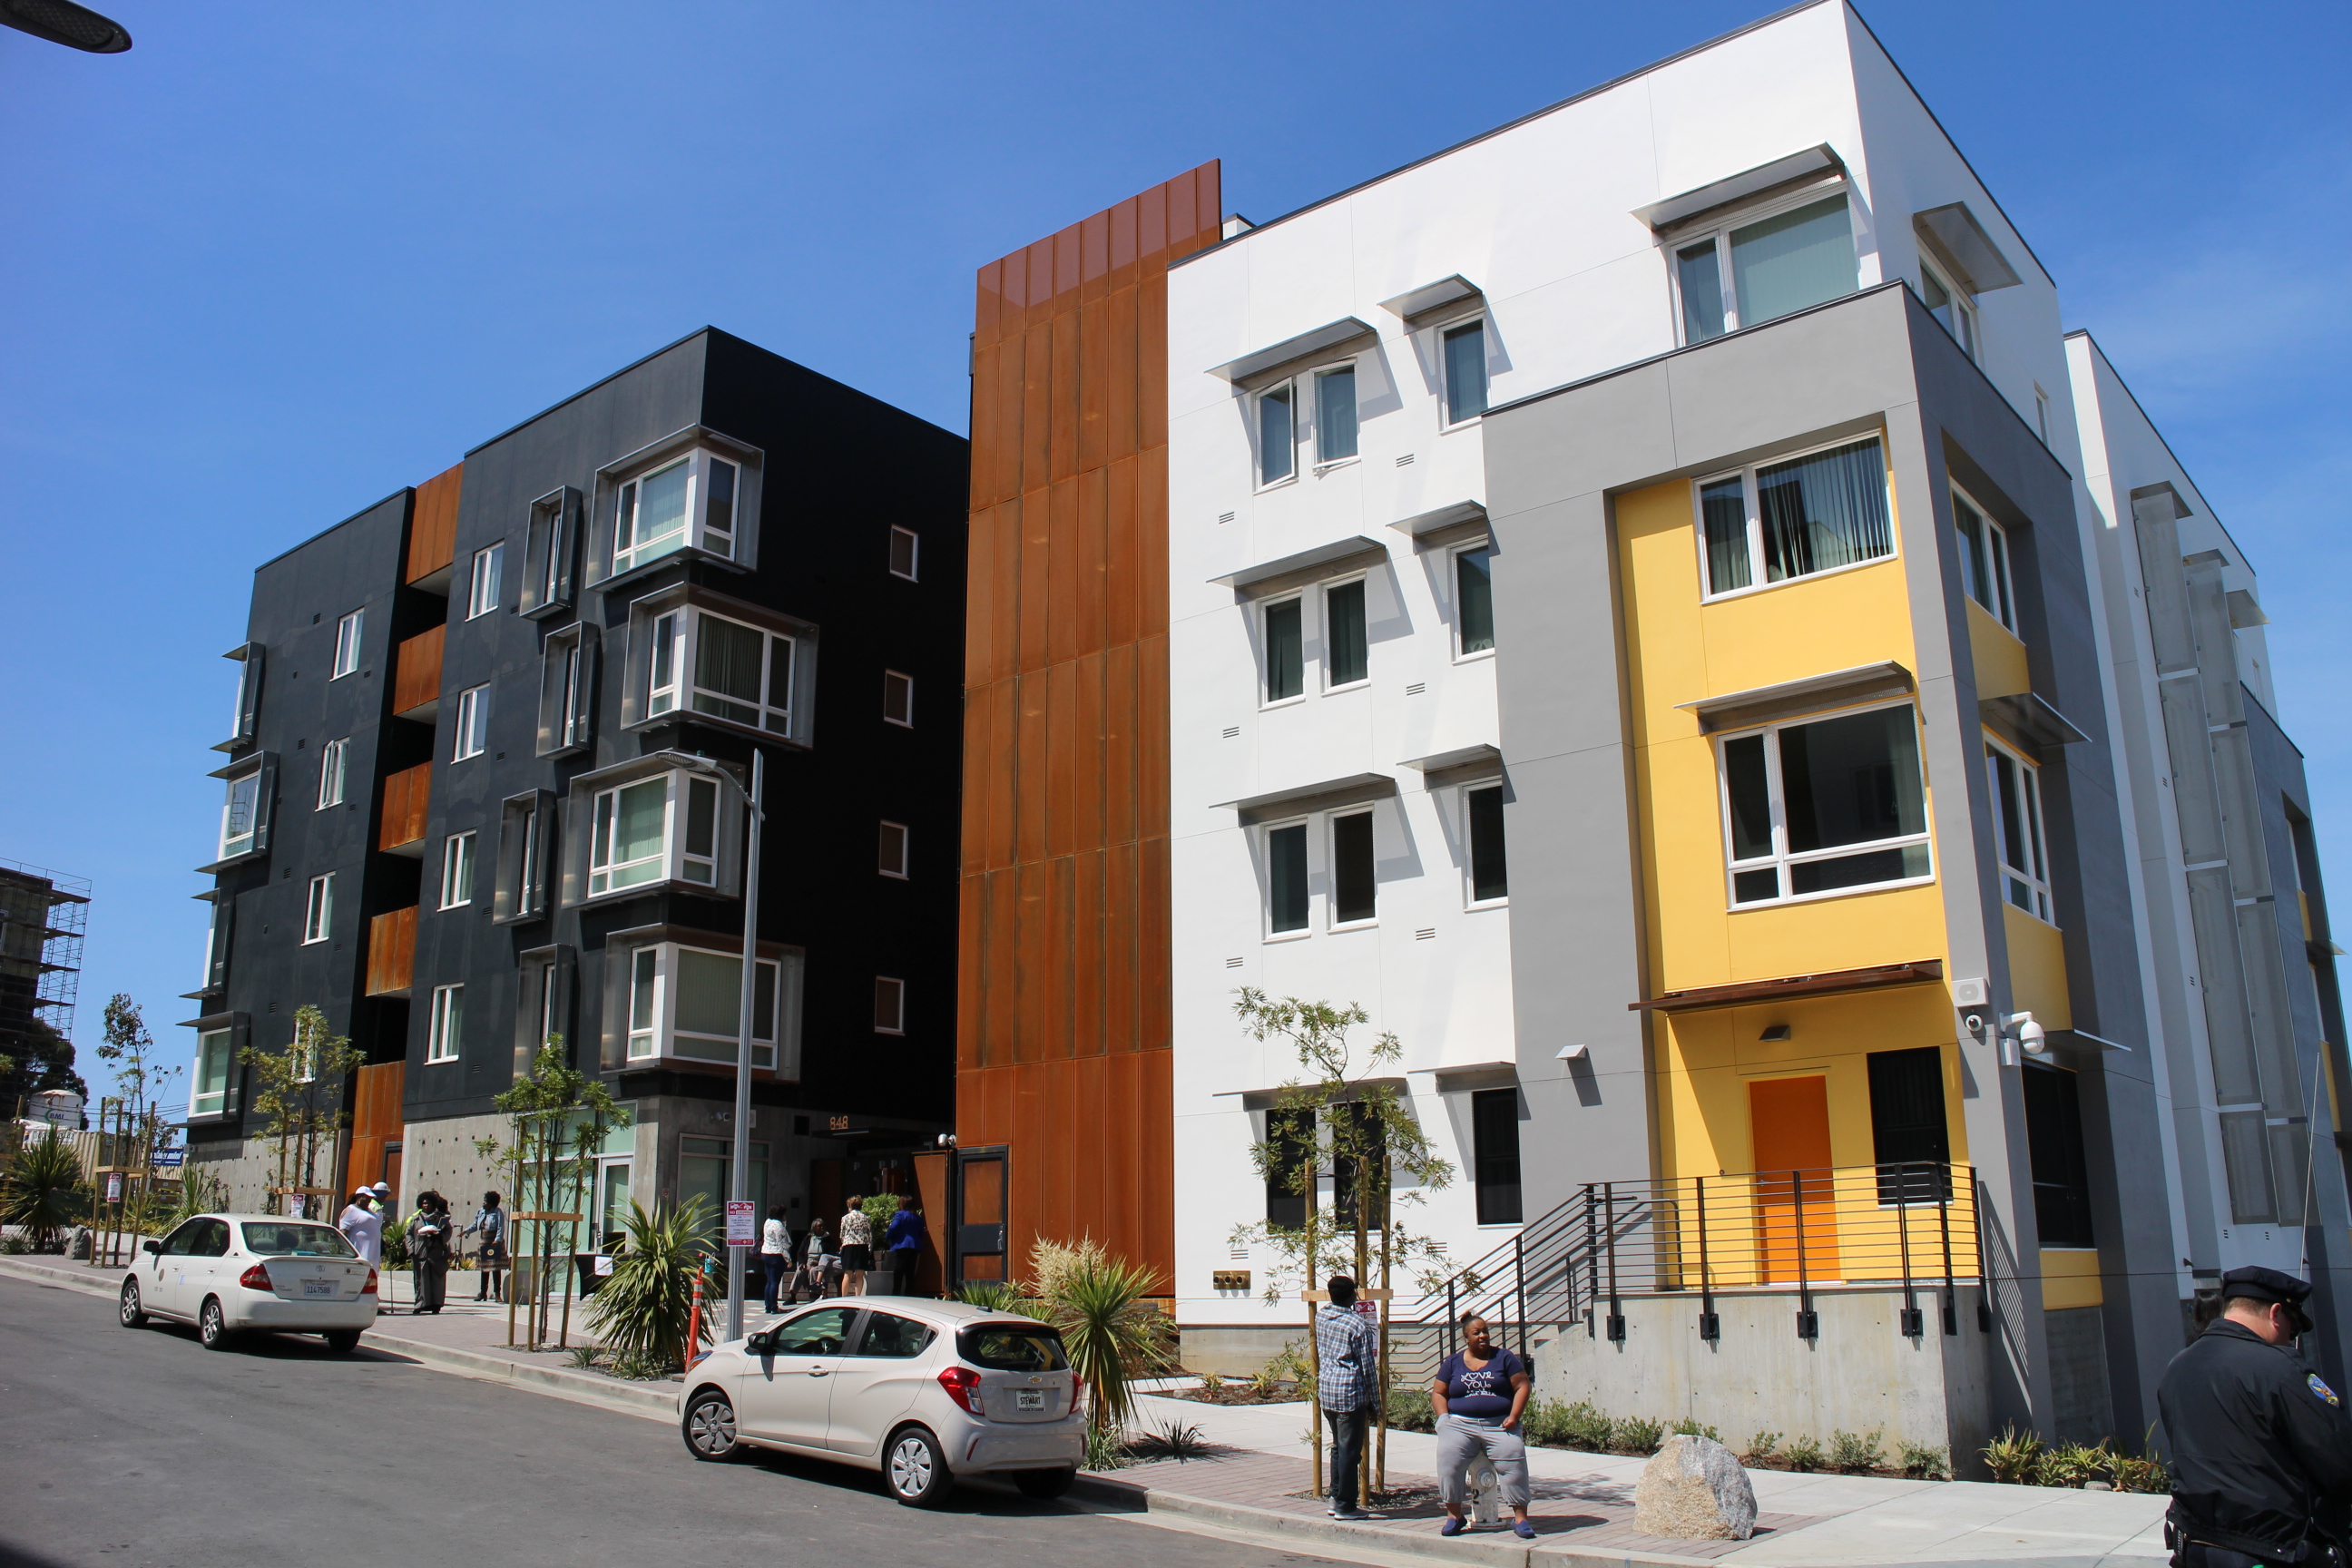
OCII Hunters View Phase 2a, Photo Credit: John Stewart Company
| Project Name | Description |
| SFHA – San Francisco Housing Authority | With extensive support from the City, over 4,000 public housing and HOPE VI units have been preserved and rehabilitated under the Rental Assistance Demonstration (RAD) program. The remaining 1,500 public housing units are slated for rehabilitation, replacement, and/or conversion to the Section 8 platform. In the interim, funding for maintenance, including annual federal operating subsidies, have been and are expected to continue to be inadequate, making deterioration of these units a continual challenge. |
MOHCD's planned preservation includes the acquisition and rehabilitation of at-risk housing for households between 0-120% AMI to prevent the displacement of existing residents and loss of affordability from Ellis Act and Owner Move-In evictions, buyouts, condominium conversions, and demolitions. Based on the Housing Balance Report, an average of 400 units per year have been removed from protected status.
An example of an acquisition and rehabilitation project in the pipeline is 3254-3264 23rd Street. This project consists of 6 residential units serving households at an average of less than 80% AMI, and 5 commercial spaces. The sponsor acquired the site with conventional bridge financing in March 2020. The rehabilitation is expected to be completed in the Summer of 2021, when it will convert to permanent financing from the City through the PASS and SSP programs.
Sources eligible for this purpose include 10% of Inclusionary and Jobs/Housing Linkage Fees, 25% of condominium conversion fees, 40% of excess ERAF allocated to MOHCD, and the Housing Trust Fund. Additionally, the City makes below-market loans available for eligible projects through the Preservation and Seismic Safety (PASS) Program, which had capacity for up to $260 million in below-market loans when voters approved the modification of the Seismic Safety Loan Program in November 2016.
The estimated need to acquire and rehabilitate 400 units annually is approximately $1.9 billion through FY2031.
MOHCD's planned preservation includes the recapitalization of existing 100% affordable housing that is owned and managed by private developers and monitored by MOHCD. About 15,500 units in MOHCD’s portfolio do not have any project-based rental or building operating subsidies to leverage additional debt, so they will need City capital subsidy to recapitalize.
An example of an existing MOHCD subsidized project in the pipeline for recapitalization is Throughline Apartments. This scattered site project consists of three buildings totaling 88 units serving households at an average of less than 30% AMI. Pending an award of competitive financing sources, construction is expected to begin in 2021 with completion in 2022.
Sources eligible for this purpose include the Housing Trust Fund and 40% of excess ERAF allocated to MOHCD.
The estimated need to recapitalize 15,500 units of existing MOHCD-subsidized housing is approximately $1.2 billion through FY2031.
MOHCD's planned preservation includes the recapitalization of federally subsidized affordable housing that is owned and managed by non-profit or for-profit developers and monitored by the HUD. About 1,000 units of HUD subsidized housing are high-risk for loss of affordability over the next 10 years because these projects have either opted out of their HUD contracts or have year-to-year or soon-to-expire contracts and can convert to market-rate rents after the expiration of their affordability restrictions.
An example of a HUD-subsidized project in the pipeline for recapitalization is Frederick Douglas Haynes Apartments. This project consists of 104 units serving households at an average of less than 50% AMI. Construction began in August 2020 with an anticipated completion in January 2022.
Sources eligible for this purpose include the Housing Trust Fund and 40% of excess ERAF allocated to MOHCD.
The estimated need to recapitalize 1,000 units of existing HUD-subsidized housing is approximately $146 million through FY2031.
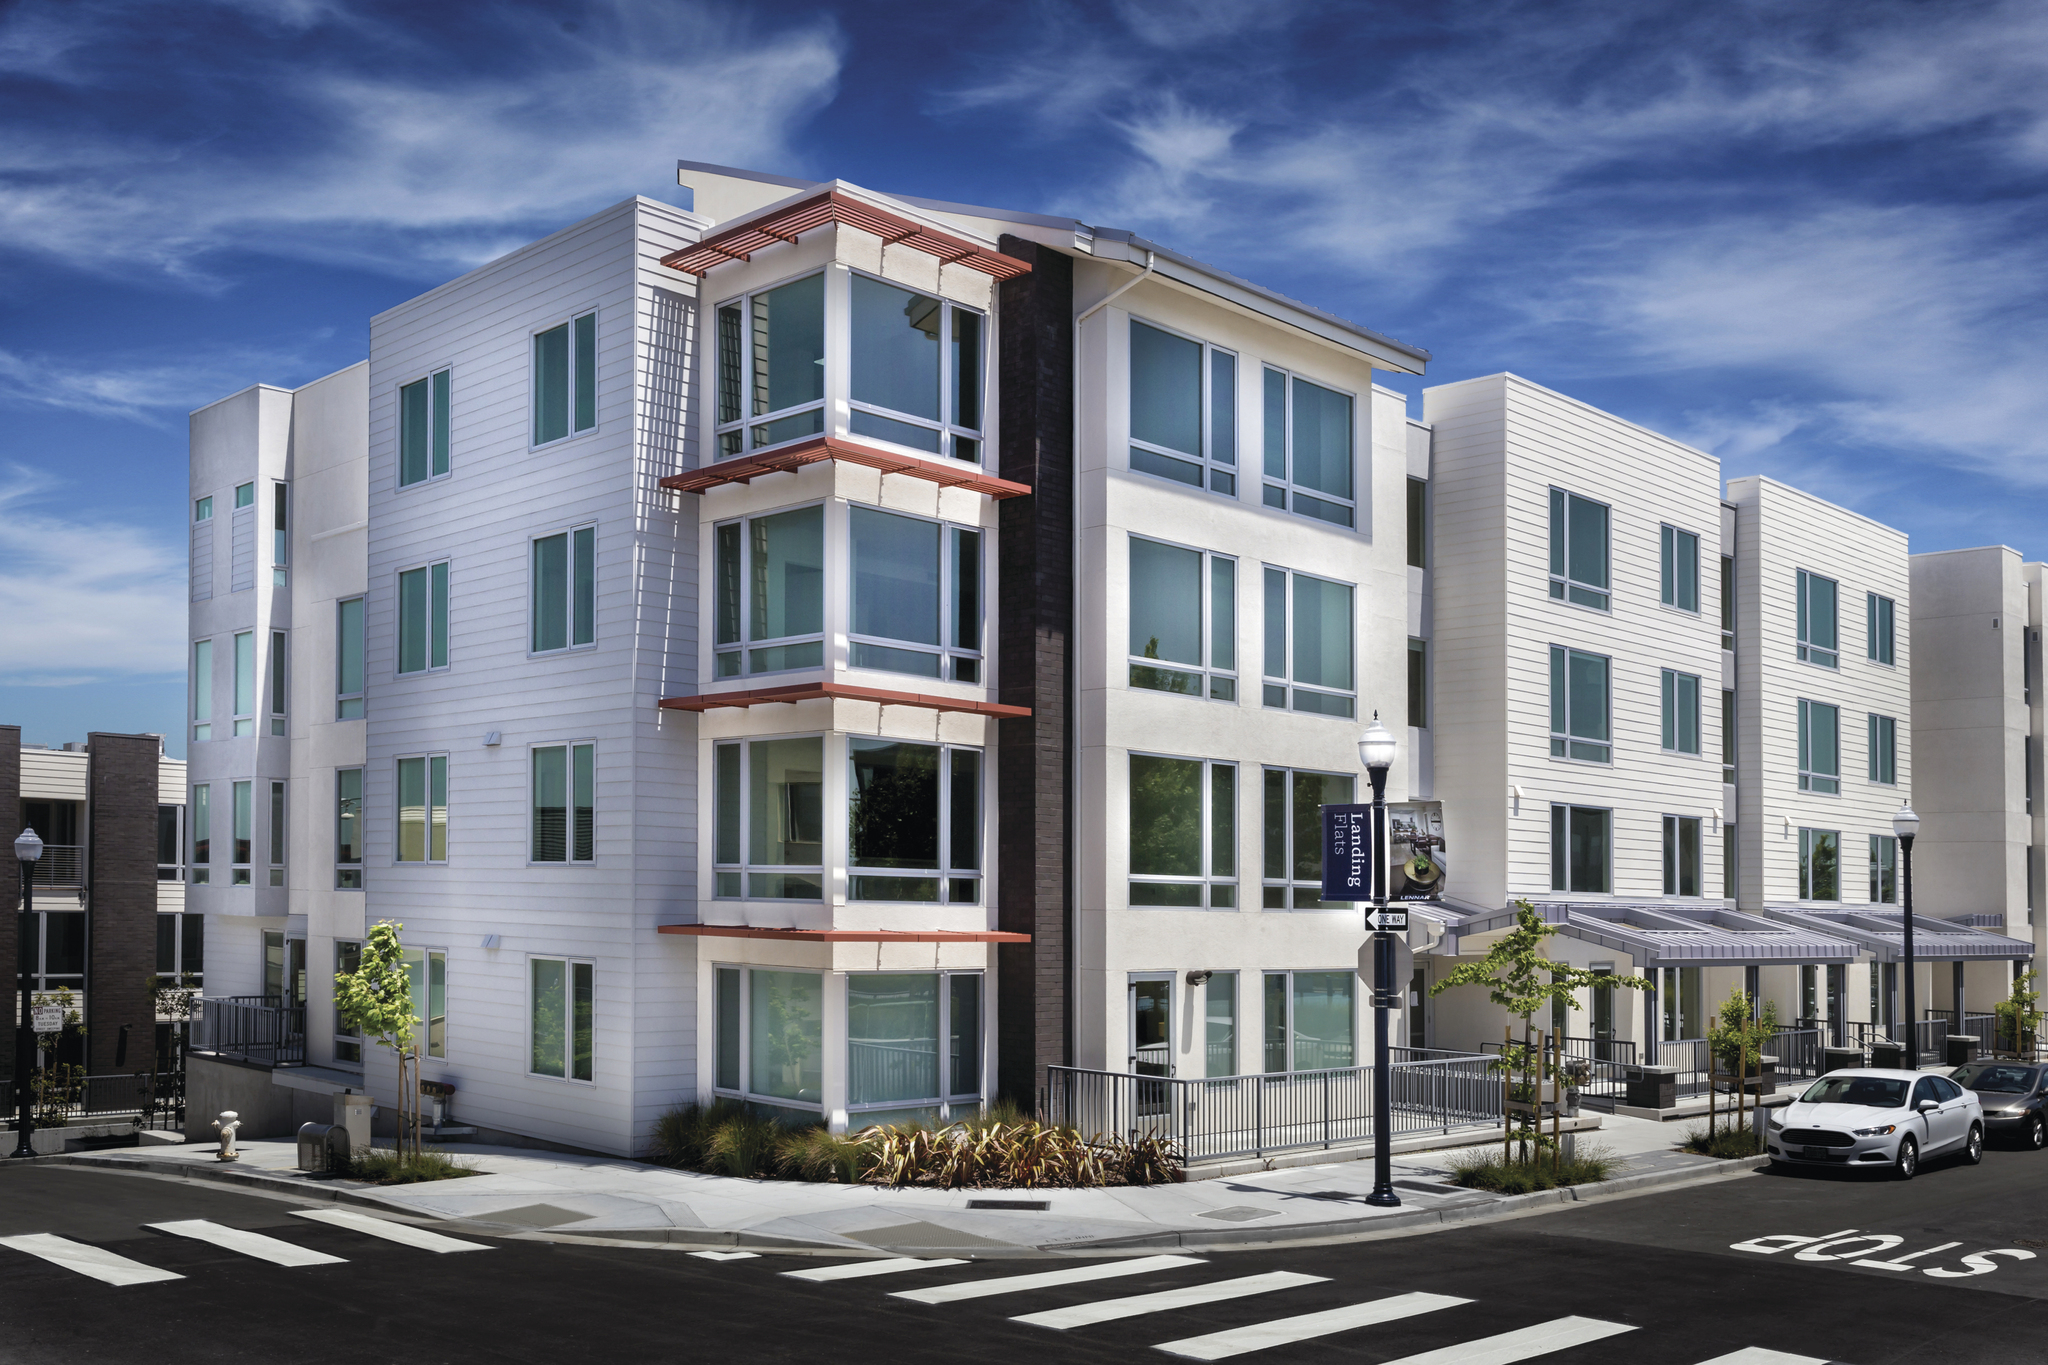
OCII Hunters Point Shipyard Phase 1 Block 57 Landing, Photo Credit: Innes Ken
San Francisco is fortunate to count on a number of capital sources of funding to provide as subsidy to support the production of affordable housing.
The Housing Trust Fund: Established in 2012 through the passage of Proposition C, the Housing Trust Fund is an annual set-aside in the General Fund. The Housing Trust Fund is a 30-year fund capped at $50 million per year, representing a total of $1.2 billion in funding for housing subsidies over the life of the fund.
Local Operating Support Program (LOSP): These subsidies provide ongoing operating support to permanent supportive housing through 15-year contracts with affordable housing owners. LOSP subsidies cover the difference between tenant-paid rent (very low for formerly homeless households) and the operating cost of the units.
One-Time General Fund Appropriations: When San Francisco receives one-time sources, one-time capital uses such as affordable housing are the preferred use. In recent years, San Francisco has committed one half of excess property tax revenues received through the Education Revenue Augmentation Fund (ERAF) to affordable housing.
Inclusionary and Jobs/Housing Linkage Fees: Jobs Housing Linkage Fees apply to development projects that increase the amount of commercial uses by 25,000 or more gross square feet. As of January 11, 2021, the Jobs Housing Linkage Fee for office development is $72.04 per square foot for projects over 50,000 square feet and $64.83 for projects less than 50,000 square feet. Inclusionary Housing Program Fees are $210.47 per applicable square foot.
Area Plan Fees: Area Plan Fees are development impact fees in the areas of San Francisco’s most concentrated growth: Eastern Neighborhoods, Market & Octavia, Visitaction Valley, Balboa Park, Rincon Hill, Transit Center, and most recently, Central SoMa. These fees are paid by developers for infrastructure needs to meet growth-driven demand, including affordable housing.
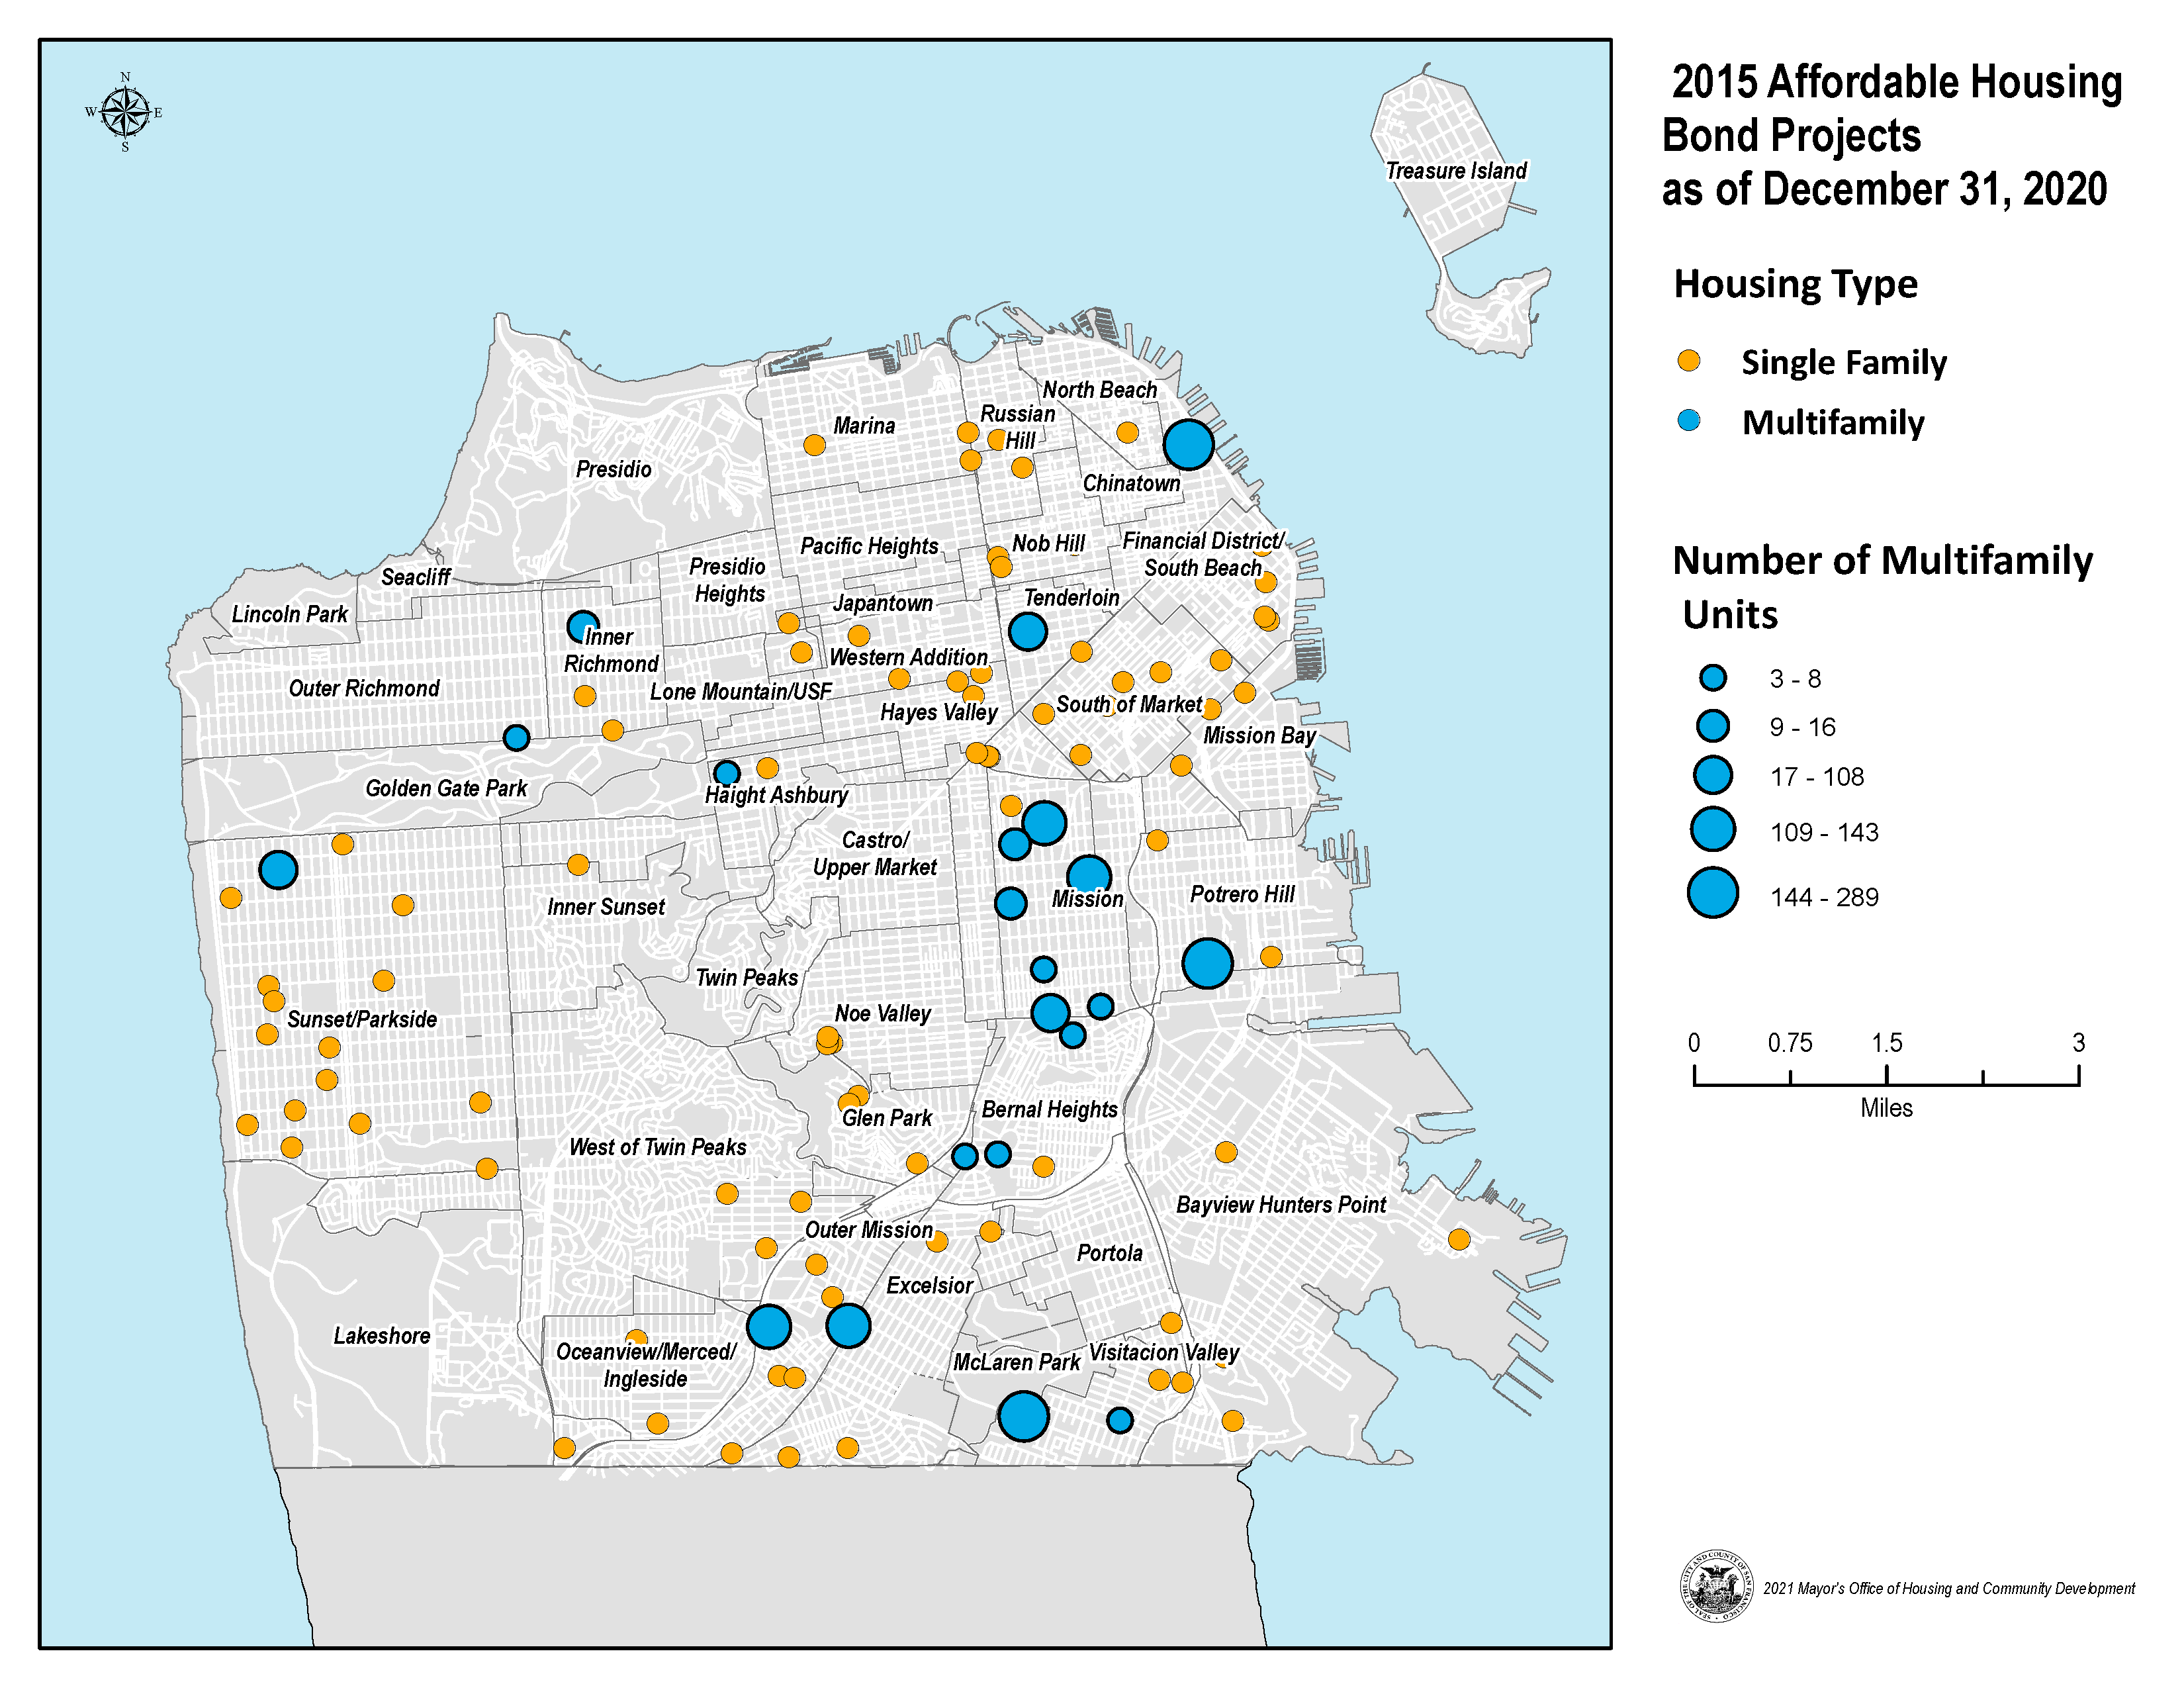
G.O. Bonds: In 2015 and 2019 San Francisco voters supported a $310 million and a $600 million G.O. Bond to support affordable housing. In 2020, voters approved the Health and Recovery G.O. Bond, including $147 million for permanent supportive housing. An affordable housing bond is planned for 2024, pending voter approval.
Certificates of Participation (COPs): This General Fund debt instrument is used to support public infrastructure needs and new construction at HOPE SF sites.
PASS Program: MOHCD manages one amortizing debt product called Preservation and Seismic Safety (PASS) Program that provides below-market rate debt to acquisition/preservation projects, thereby reducing the need for direct capital subsidy.
Tax Increment Financing: Tax Increment Financing (TIF) was historically the largest source of local financing for the San Francisco Redevelopment Agency. When California dissolved redevelopment agencies in 2012, this source of funding was discontinued for local governments. As the successor agency to the Redevelopment Agency, OCII can still make use of this source to meet its affordable housing production obligations.
Federal Funds: Federal funds come to San Francisco through formula grant programs, including HOME funds (for new production) and CDBG (for acquisition and preservation). Although the availability of federal funding has decreased over the years, HOME and CDBG continue to play a role in San Francisco’s housing production and preservation.
Leveraged Funds: For every dollar of City funding that is provided to produce affordable housing, additional funding from the project sponsor makes the project whole. These complementary funds may include federal or state tax credits, competitive state funding (MHP, AHSC, IIG, TOD, etc.), or federal rent subsidies (Section 8, Section 202/811).
Market Rate Production: Market rate production generates affordable units through inclusionary requirements and fees. Between 2006 through 2018, one third of all affordable housing built was through on-site or off-site inclusionary requirements of market rate production. In addition, market rate production reduces the competition for existing housing units by higher-income families who can afford new construction. The RHNA allocations do not guarantee State and regional public funding for the affordable housing portions, nor do they limit the production of market rate housing or the balance of affordable versus market rate units. As a result, San Francisco, like all other jurisdictions, has not been able to fully meet the allocations for units serving very low, low, and moderate income households while the private sector has been able to exceed the market rate allocations. Providing housing at market-rate satisfies some of the housing need, which reduces demand on existing housing. More directly, market rate production generates affordable units through inclusionary requirements and fees. Market rate residential developers must provide a portion of the units as below market rate (BMR) units, or they may opt to (a) pay an “in lieu” fee to be used by MOHCD to fund new production; (b) build affordable units on a separate site; or (c) dedicate land to the City for production of new affordable housing.
San Francisco has longstanding funding principles to prioritize our capital projects (see Introduction). The principles for affordable housing preservation and production are different but no less important for strategic planning and expedient project delivery.
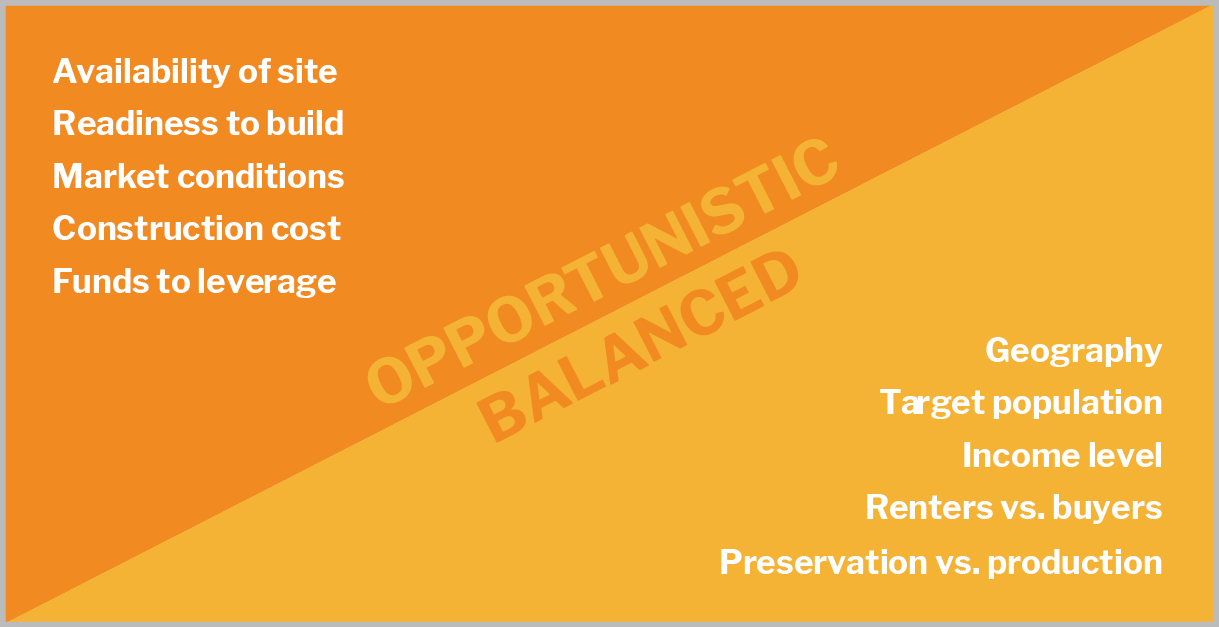
Whereas the standard capital planning funding principles are tiered, the principles for affordable housing prioritize feasibility, balanced across the many categories of need within the affordable housing sector.
To maximize the number of units delivered, and in order to deliver units across as broad a geography and as broad a spectrum of need as possible, San Francisco must be both opportunistic and balanced in its approach to housing production. The City, acting primarily through MOHCD, must respond to opportunities as they arise and support projects that are as cost efficient as possible. and address the needs of vulnerable populations. Project feasibility depends on the availability of City and non-City funds, cost and availability of development sites, and cost of construction. Without eligible funds in hand, a project cannot proceed. Affordable housing developers must compete on the open market for sites, or sites may come to the City through land dedication. Construction costs have jumped dramatically in recent years, and a project’s mix of uses and funds must be able to support those costs.
While focusing on cost efficiency and feasibility, the City prioritizes balancing the distribution of resources in an effort to address the range of need for affordable housing in San Francisco. The portfolio is inclusive of projects across neighborhoods, populations, and income levels. It must support renters and buyers through preservation and production strategies. With so many needs on so many fronts, public affordability supports multiple targets in consideration of the whole of San Francisco’s affordable housing needs.
