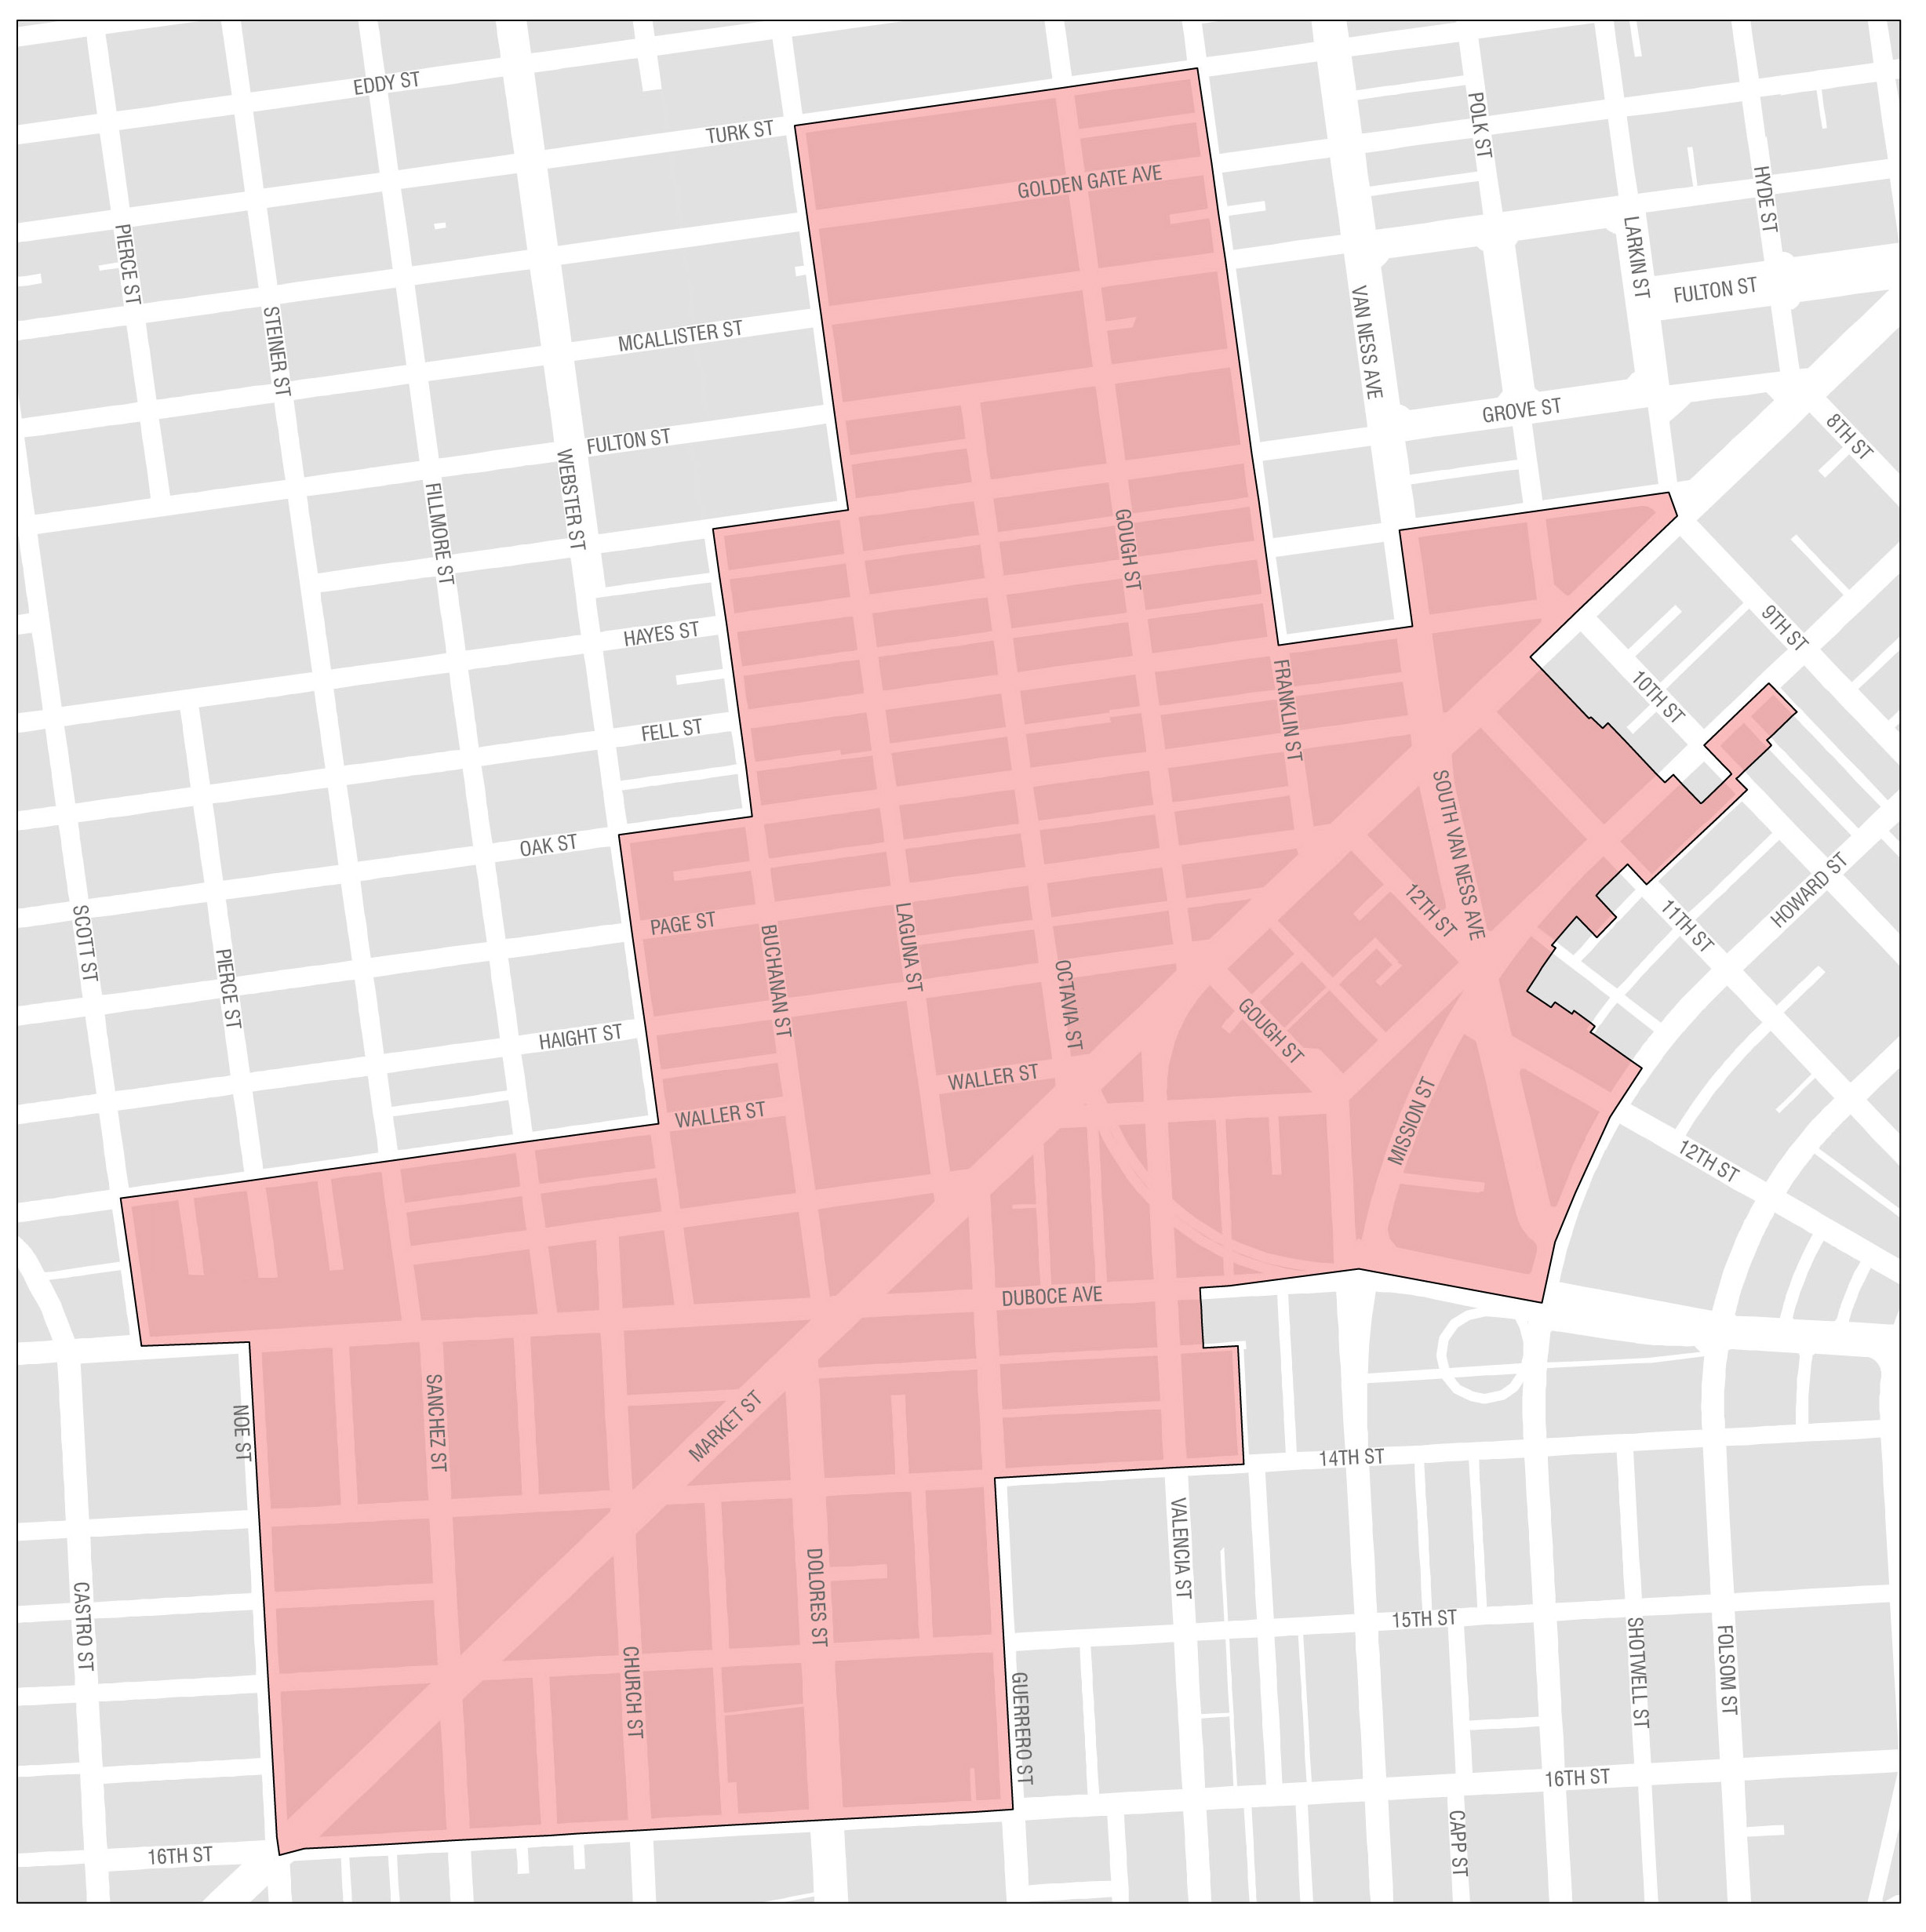
Market Octavia is located just west of the Civic Center, governmental, and cultural institutions there attract a wide range of people both day and night. Its pattern of streets and alleys make it very walkable and bikeable. More than a dozen transit lines cross the neighborhood, including all of the city’s core streetcar lines. It is accessible from the entire Bay Area by BART and the regional freeway system.
Market Octavia’s history as a crossroads also poses enormous challenges. Large redevelopment projects occurred in the 1960s and 1970s, and the Central Freeway bisected the neighborhood before it was demolished in 2003. Large flows of automobile traffic are channeled through the area creating hazardous conditions for pedestrians. However, its centralized location and transit accessibility make Market Octavia a key area to add new housing to the City.
The Market Octavia Area Plan identified many needs related to complete streets, transit, open space, and childcare that will provide the necessary services for new people living and working in the area. The total estimated revenues for proposed projects in Market Octavia is currently estimated at $173 million, including prior years. The following tables show the Market Octavia spending plan, sources of funds, and funding gap.
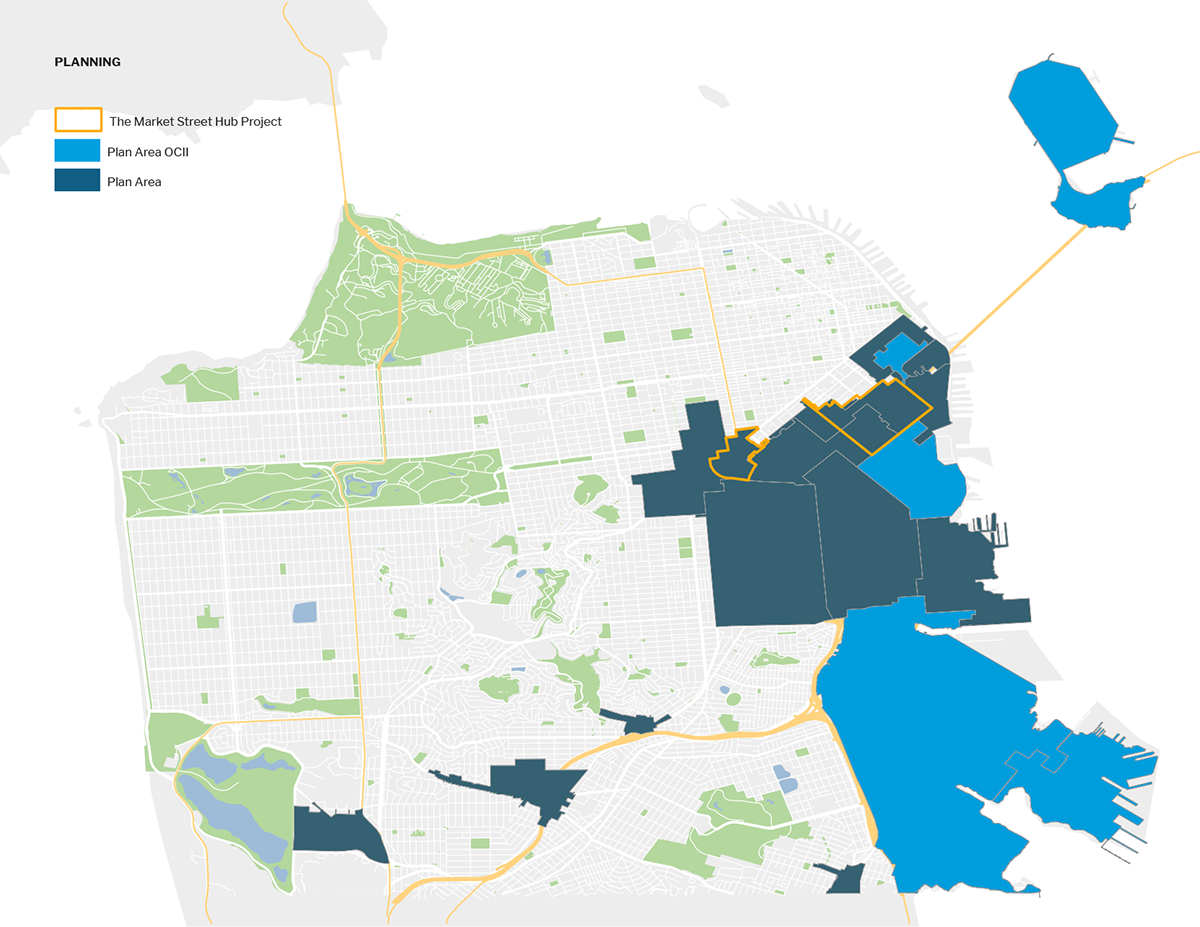
The Hub: The Planning Department is studying zoning and height limit changes in the Hub, a subset of Market Octavia, to increase housing capacity in the area by several thousand new units. An updated public realm plan was created by a multi-agency team to understand the needs of the people that live, work, and visit the area. Projects in the plan include transportation enhancements, open space improvements, and upgrades to streetscapes throughout the Hub. The Hub rezoning is expected to be approved in early 2020.
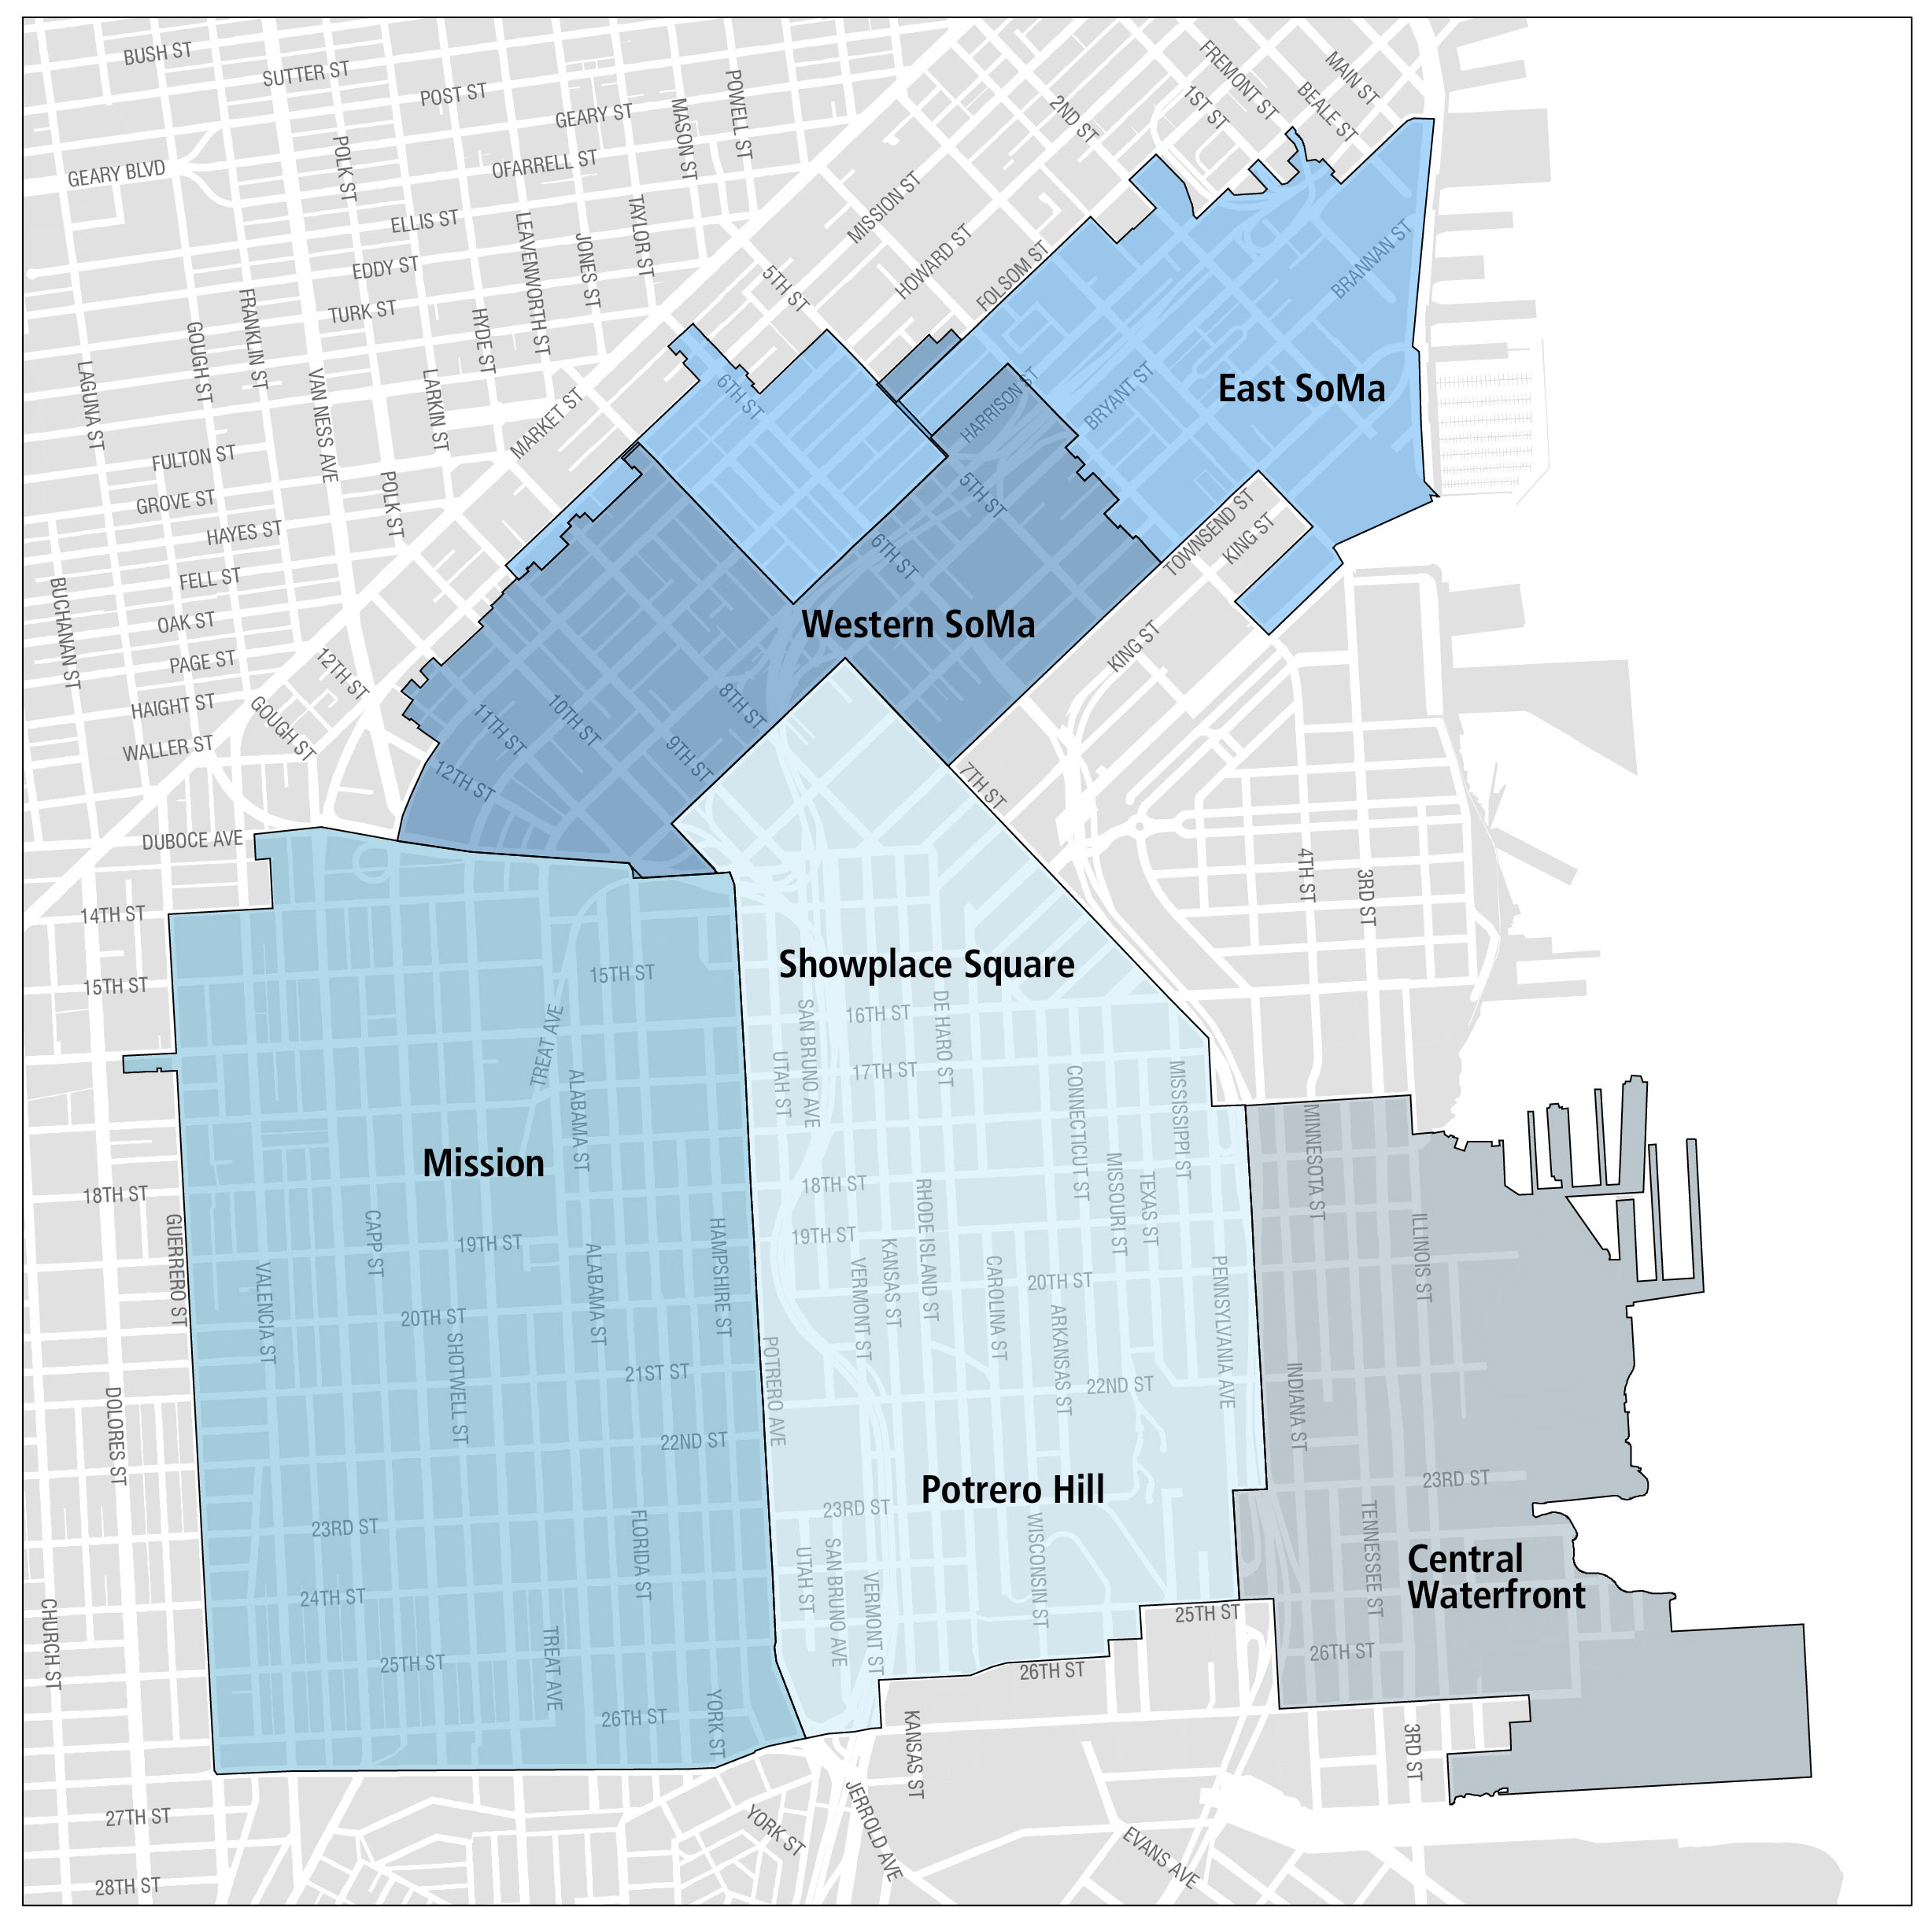
The Eastern Neighborhoods Area Plan consists of several smaller neighborhoods, including South of Market, the Mission, Showplace Square, Central Waterfront, and Potrero Hill. Much of the land use in the Eastern Neighborhoods was historically dedicated to industrial uses, and production, distribution, and repair. Over time, residential and commercial uses began to compete for space with the previous industrial uses.
In 2010, population in the Eastern Neighborhoods Plan Area was 83,930. The Planning Department projects the population to reach 149,570 by 2040, an increase of 78%. The demand for infrastructure related to complete streets, transportation, and open space increased as the population in the neighborhood began to grow. Since the Eastern Neighborhoods Area Plan was initiated in 2008, the City has worked with the community to identify priority projects for implementation. These priorities include a number of projects from the 2008 Area Plan as well as new projects identified through planning efforts that occurred since the Plan was adopted.
The revenues estimated for projects in Eastern Neighborhoods is approximately $431 million, including prior years. The tables on the following page show the Eastern Neighborhoods spending plan, sources of funds, and funding gap.
Central SOMA: The vision of the Central SoMa Plan is to create a social, economic, and environmentally sustainable neighborhood by 2040, with space for approximately 32,000 new jobs and 8,600 new housing units. The Plan will provide public benefits to serve the neighborhood, including affordable housing, transportation, streets improvements, parks and recreation, schools, environmental sustainability, and community services. Funding for these projects will come from new and existing impact fees, Community Facilities District special tax revenues, direct provision by developers, and various other sources.
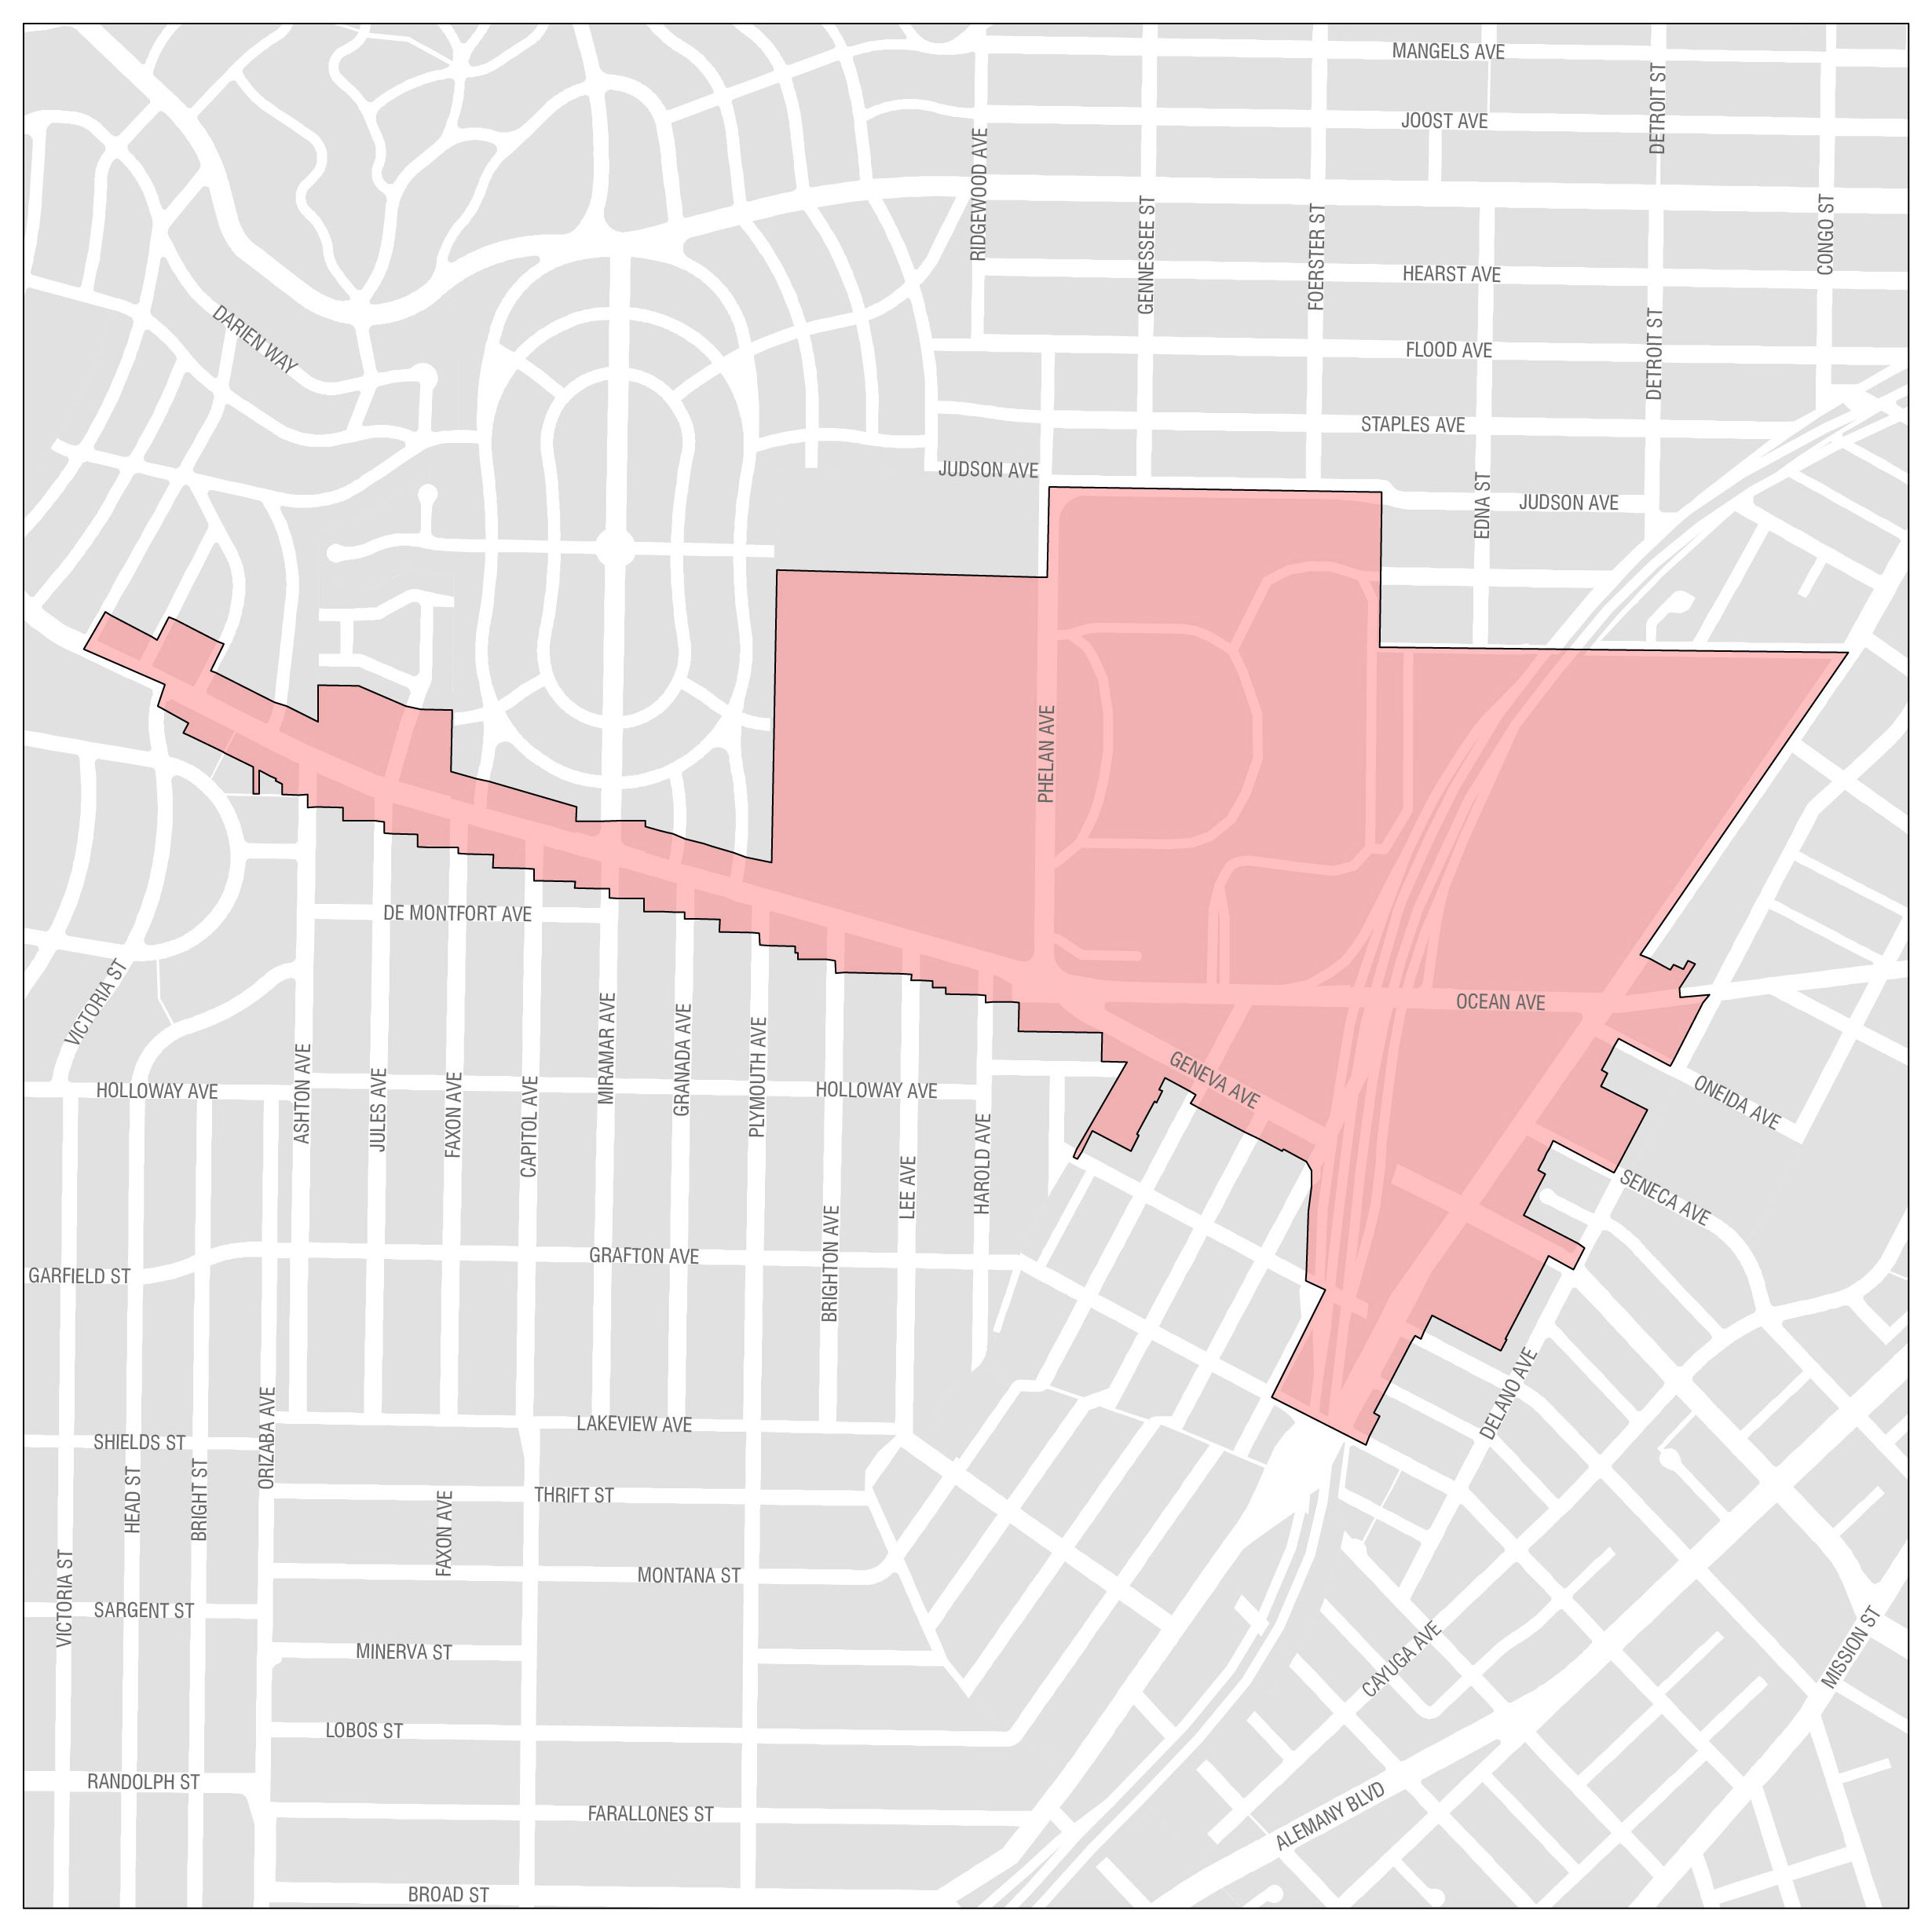
Balboa Park is located in southern San Francisco and provides several amenities that can be leveraged to promote a more livable neighborhood. The area includes the Ocean Avenue campus of the City College of San Francisco, the Ocean Avenue Neighborhood Commercial District, Balboa Park, and the Balboa Park BART station. The area is home to the Balboa Park Reservoir, which is currently slated to have 1,100 units of housing built there.
Key projects to be implemented in Balboa Park during the period of this Plan include streetscape projects along Geneva and Ocean Avenues, renovating Balboa Park Pool, and redeveloping the Geneva Car Barn into a cultural hub and neighborhood center. The Balboa Park spending plan is shown in the tables below.
The Fiscal Year FY2020-29 City and County of San Francisco Capital Plan (the Plan) is the City’s commitment to building a more resilient and vibrant future for the residents, workers, and visitors of San Francisco. Updated every odd-numbered year, the Plan is a fiscally constrained expenditure plan that lays out anticipated infrastructure investments over the next decade. This document is the product of input from Citywide stakeholders, who have put forth their best ideas and most realistic estimates of San Francisco’s future capital needs.
Through the application of consistent funding principles and fiscal policies, the Plan prioritizes departmental capital needs within defined fiscal constraints. The result is a road map for investments in San Francisco’s streets, facilities, utilities, parks, waterfront, and transportation systems.
Developed on the centennial of the 1906 earthquake, San Francisco’s first Capital Plan described the City’s renewed dedication to investing in public facilities and infrastructure for FY2007- 2016. Since that first Plan, the City’s commitment to our capital portfolio has grown substantially. The first Plan called for $15.7 billion to address earthquake safety, modernization, and maintenance needs for City buildings and infrastructure. The level of recommended funding steadily grew as better capital planning practices were employed, infrastructure systems and facilities reached the end of their useful life, and the City dug out of extremely low levels of investment from the mid-1970s to 2008.
The current Plan recommends a record $39 billion in critical infrastructure improvements over the next 10 years. This is $4 billion more than the previous Plan.
Drivers of this increase include (1) large investments in and fees from developing areas in the southeastern part of the city and at Treasure Island; (2) continued use of G.O. Bonds against growing assessed value to address the transportation network, parks and open space, sewers, and critical facilities; (3) strong capital programs from San Francisco’s enterprise departments; and (4) year-over-year growth to keep existing City assets in a state of good repair.
This growth reflects increased confidence in the City’s capacity to administer our capital program in a responsible and transparent manner that employs best practices in financial management. This includes establishing constraints around each funding program to promote long-term viability, listing what is unfunded or deferred, and establishing funding principles, among others. It also recognizes an appreciation for the long-term benefits of investing in public infrastructure.
The planned growth reflects confidence in the City’s capacity to administer capital projects and programs in a responsible, transparent manner using best practices in financial management. Such practices include establishing constraints around each funding program to promote long-term viability, listing what is unfunded or deferred, and establishing funding principles, among others. It also recognizes San Francisco’s appreciation for the long-term benefits of investing in public infrastructure.
San Francisco's voters have approved nearly $4 billion in G.O. Bonds since 2008, more than the previous 50 years of G.O. Bonds combined.
The Fiscal Year (FY) 2018-2027 City and County of San Francisco Capital Plan (the Plan) is the City’s commitment to building a more resilient and vibrant future for the residents, workers, and visitors of San Francisco. Updated every odd-numbered year, the Plan is a fiscally constrained expenditure plan that lays out infrastructure investments over the next decade. This document is the product of input from Citywide stakeholders, who have put forth their best ideas and most realistic estimates of San Francisco’s future needs.
Through the application of consistent funding principles and fiscal policies, the Plan prioritizes departmental capital needs against clearly defined fiscal constraints. The result is a road map for investments in San Francisco’s streets facilities, utilities, parks, waterfront, and transportation systems.
Developed on the centennial of the 1906 earthquake, San Francisco’s first Capital Plan described the City’s renewed dedication to investing in public facilities and infrastructure for FY2007- 2016. Since that first Plan, the City’s commitment to our capital portfolio has grown substantially. The first Plan called for $15.7 billion to address earthquake safety, modernization, and maintenance needs for City buildings and infrastructure. The level of recommended funding steadily grew as better capital planning practices were employed, infrastructure systems and facilities reached the end of their useful life, and the City dug out of extremely low levels of investment from the mid-1970s to 2008.
The current Plan recommends a record $35 billion in critical infrastructure improvements over the next 10 years. This is $3 billion more than the previous Plan.
The primary drivers of this increase are (1) large investments in newly developing areas along the waterfront and at Treasure Island; (2) continued use of G.O. Bonds and other forms of debt to address the transportation network, parks and open space, sewers, and key facilities that improve services and resilience for current and future generations; and (3) year-over-year growth to keep existing City assets in a state of good repair.
This growth reflects increased confidence in the City’s capacity to administer our capital program in a responsible and transparent manner that employs best practices in financial management. This includes establishing constraints around each funding program to promote long-term viability, listing what is unfunded or deferred, and establishing funding principles, among others. It also recognizes an appreciation for the long-term benefits of investing in public infrastructure.
Ignoring the needs of our existing assets results in greater costs down the road as they become less efficient and more costly to repair or replace.
San Francisco has received voter approval for nearly $3.5 billion in G.O. Bonds since 2008, more than the previous 50 years of G.O. Bonds combined.
Table 2.1
G.O. Bond Program
Amount
(Dollars in Millions)
2008
Neighborhood Parks and Open Space
180
2008
Public Health Seismic
Facilities (SFGH rebuild)
887
2010
Earthquake Safety and
Emergency Response
412
2011
Road Resurfacing and Street Safety
248
2012
Neighborhood Parks and Open Space
195
2014
Earthquake Safety and Emergency Response
400
2014
Transportation
500
2015
Affordable Housing
310
2016
Public Health and Safety
350
Total
3,482
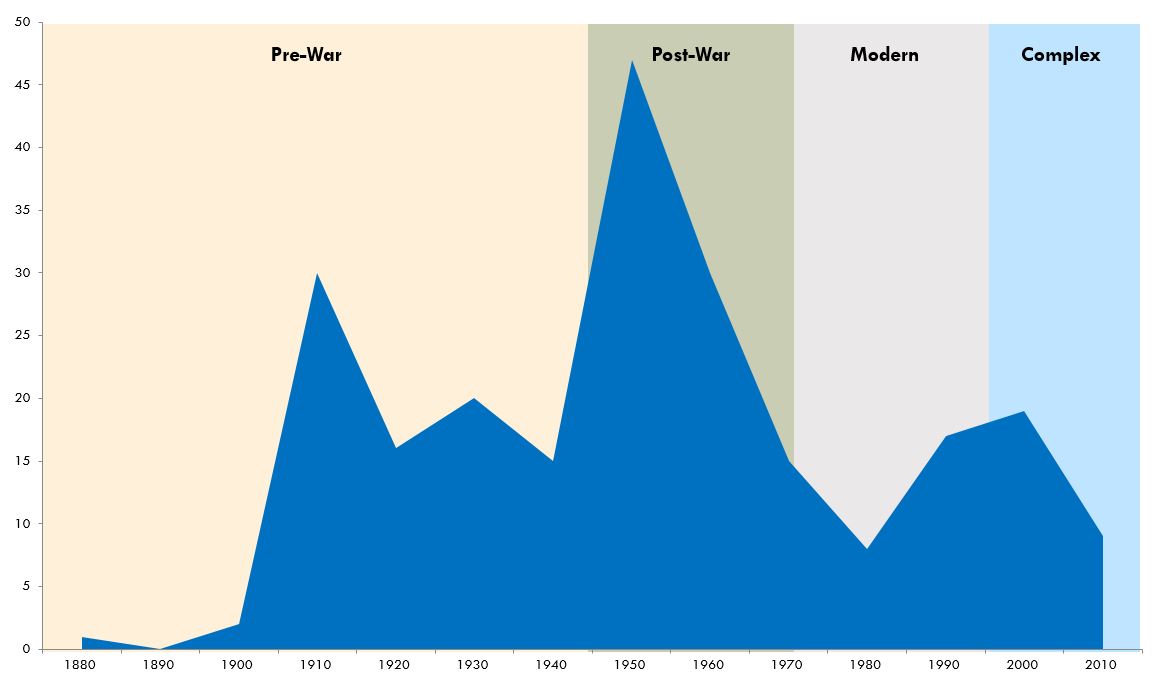
Number of General Plan Facilities Constructed by Decade
The Fiscal Year 2022-31 City and County of San Francisco Capital Plan (the Plan) is the City’s commitment to building a more resilient, equitable, and vibrant future for the residents, workers, and visitors of San Francisco. Updated every odd-numbered year, the Plan is a fiscally constrained expenditure road map that lays out anticipated infrastructure investments over the next decade. This document is the product of input from Citywide stakeholders, who have put forth their best ideas and most realistic estimates of San Francisco’s future needs.
Projects in the Plan are divided into eight Service Areas: Affordable Housing; Economic and Neighborhood Development; General Government; Health and Human Services; Infrastructure and Streets; Public Safety; Recreation, Culture, and Education; and Transportation. Each Service Area chapter describes the associated Renewal Program, Enhancement Projects, Deferred Projects, and Emerging Needs. General Fund, Enterprise, and external agencies are all represented to give as full a picture of San Francisco’s capital needs as possible. This Plan is the first to include a dedicated Affordable Housing service area, recognizing affordability as a critical public need that can be supported by the City’s capital sources.
Before the COVID-19 pandemic, San Francisco reached historic levels of capital investment. Spurred by a growing tax base, increases in General Fund revenues and debt issuance capacity allowed San Francisco to advance important investments to address our major resilience challenges, including racial and social inequity, earthquakes, sea level rise, and aging infrastructure. Now in the midst of the public health and economic crisis wrought by the COVID-19 pandemic, the future looks very different, but San Francisco is well positioned to deliver critical capital improvements. In the two years since the last Capital Plan, San Francisco voters have approved $1.7 billion in General Obligation (G.O.) Bonds that will continue to support construction, public infrastructure, and the local economy. This Plan puts forward a slate of investments that create jobs and serve as economic stimulus in the years ahead. Above all, San Francisco remains committed to good stewardship of public assets and investing in the infrastructure that residents, workers, and visitors will rely upon for generations to come.
Planned Project Highlights
San Francisco has many competing needs, and the capital program is no exception. Major projects with funding identified in this Plan include:
General Fund Departments
Permanent supportive housing and facilities for mental health needs
Replacement of the seismically unsafe Hall of Justice
Park system renovations, including Portsmouth Square and India Basin
Fiber to affordable housing
Neighborhood Fire Stations program
District Police Stations program
Replacement fire training facility
ADA facilities and right-of-way barrier removal
Zuckerberg San Francisco General and Laguna Honda Hospital campus improvements
Enterprise Departments
Seawall strengthening
Pier 70 Waterfront Site
Mission Bay Ferry Landing
Better Market Street
Van Ness and Geary Bus
Rapid Transit
SFO Harvey Milk Terminal 1, and Terminal 3 Redevelopment
The Fiscal Year FY2020-29 City and County of San Francisco Capital Plan (the Plan) is the City’s commitment to building a more resilient and vibrant future for the residents, workers, and visitors of San Francisco. Updated every odd-numbered year, the Plan is a fiscally constrained expenditure plan that lays out anticipated infrastructure investments over the next decade. This document is the product of input from Citywide stakeholders, who have put forth their best ideas and most realistic estimates of San Francisco’s future needs.
Projects in the Plan are divided into seven Service Areas: Economic and Neighborhood Development; General Government; Health and Human Services; Infrastructure and Streets; Public Safety; Recreation, Culture, and Education; and Transportation. Each Service Area chapter describes the associated Renewal Program, Enhancement Projects, Deferred Projects, and Emerging Needs. General Fund, Enterprise, and external agencies are all represented to give as full a picture of San Francisco’s capital needs as possible.
A growing Bay Area economy has given rise to historic levels of capital investment in recent years. Spurred by a growing tax base, increases in General Fund revenues and debt issuance capacity have allowed San Francisco to fund a record level of capital projects over the last 10 years. As a result, San Francisco is now better positioned to build a healthy infrastructure program and meet the challenges ahead.
Planned Project Highlights
San Francisco has many competing needs, and the capital program is no exception. Major projects with funding identified in this Plan include:
General Fund Departments
New homelessness services and health center
Closure and demolition of the unsafe Hall of Justice
Park system renovations, including Portsmouth Square
Neighborhood Fire Stations program
District Police Stations program
Replacement fire training facility
Department of Emergency Management 911 floor expansion
ADA facilities and right-of-way barrier removal
Zuckerberg San Francisco General and Laguna Honda Hospital campus improvements
The Fiscal Year (FY) 2018-2027 City and County of San Francisco Capital Plan (the Plan) is the City’s commitment to building a more resilient and vibrant future for the residents, workers, and visitors of San Francisco. Updated every odd-numbered year, the Plan is a fiscally constrained expenditure plan that lays out infrastructure investments over the next decade. This document is the product of input from Citywide stakeholders, who have put forth their best ideas and most realistic estimates of San Francisco’s future needs.
Projects in the Plan are divided into seven Service Areas: Economic and Neighborhood Development; General Government; Health and Human Services; Infrastructure and Streets; Public Safety; Recreation, Culture, and Education; and Transportation. Each Service Area chapter describes the associated Renewal Program, Enhancement Projects, Deferred Projects, and Emerging Needs. General Fund, Enterprise, and external agencies are all represented to give as full a picture of San Francisco’s capital needs as possible.
A growing Bay Area economy has given rise to historic levels of capital investment in recent years. Spurred by a growing tax base, increases in General Fund revenues and debt issuance capacity have allowed San Francisco to fund a record level of capital projects over the last eight years. As a result, San Francisco is now better positioned to build a healthy infrastructure program and meet the challenges ahead.
Planned Project Highlights
San Francisco has many competing needs, and the capital program is no exception. Major projects with funding identified in this Plan include:
General Fund Departments
Zuckerberg San Francisco General Hospital campus improvements
Southeast Health Center expansion
Closure and demolition of the unsafe Hall of Justice
Neighborhood Fire Stations program
District Police Stations program
Department of Emergency Management expansion
Animal Care & Control Shelter replacement
SFFD Ambulance Deployment Center modernization
Park system renovations, including Margaret S. Hayward Playground
MOHCD: Mayor’s Office of Housing and Community Development
OCII: Office of Community Investment and Infrastructure
PLANNING: Impact Development Plan Areas
PORT: Port of San Francisco
TIDA: Treasure Island Development Authority
While the COVID-19 pandemic has created short-term uncertainty, the expectation is that San Francisco will continue growing as our neighborhoods, values, and economy draw new residents. As of December 2020, the population was 890,772, up 14.6% from 2000. Plan Bay Area, developed by the Association of Bay Area Governments, projects San Francisco will grow by over 300,000 people, nearly 190,000 housing units, and 300,000 jobs by 2040. As the city’s density increases, having sufficient infrastructure to support all residents in all neighborhoods becomes more challenging but also more important.
The majority of the new developments are in the more industrial eastern areas of the city that are not only vulnerable to sea level rise, flooding, and liquefaction, but have historically been home to San Francisco’s Black and Latinx communities and offer fewer services and amenities as a result of systemic racism. Major planned developments in these areas must not only support future increases in population without displacing current residents, but also address historic disinvestment and environmental injustices. Central SoMa, the Hub, Mission Bay, Candlestick Point, and Hunters Point Shipyards are just a few of the high-growth areas tackling these challenges and growing the tax base that supports City services. Many of these developments and projects have distinctive funding mechanisms, including dedicated development fees and developer agreements that target improvements in areas of especially high growth. These projects seek to create well-planned, equitable, and safe places to live, travel, work, and play.
Overview
This chapter includes capital projects from departments, agencies, and programs whose primary objectives are to improve San Francisco’s wide-ranging economic base and plan for its future growth. The projects for this service area are estimated to create over 24,000 jobs over the next 10 years.
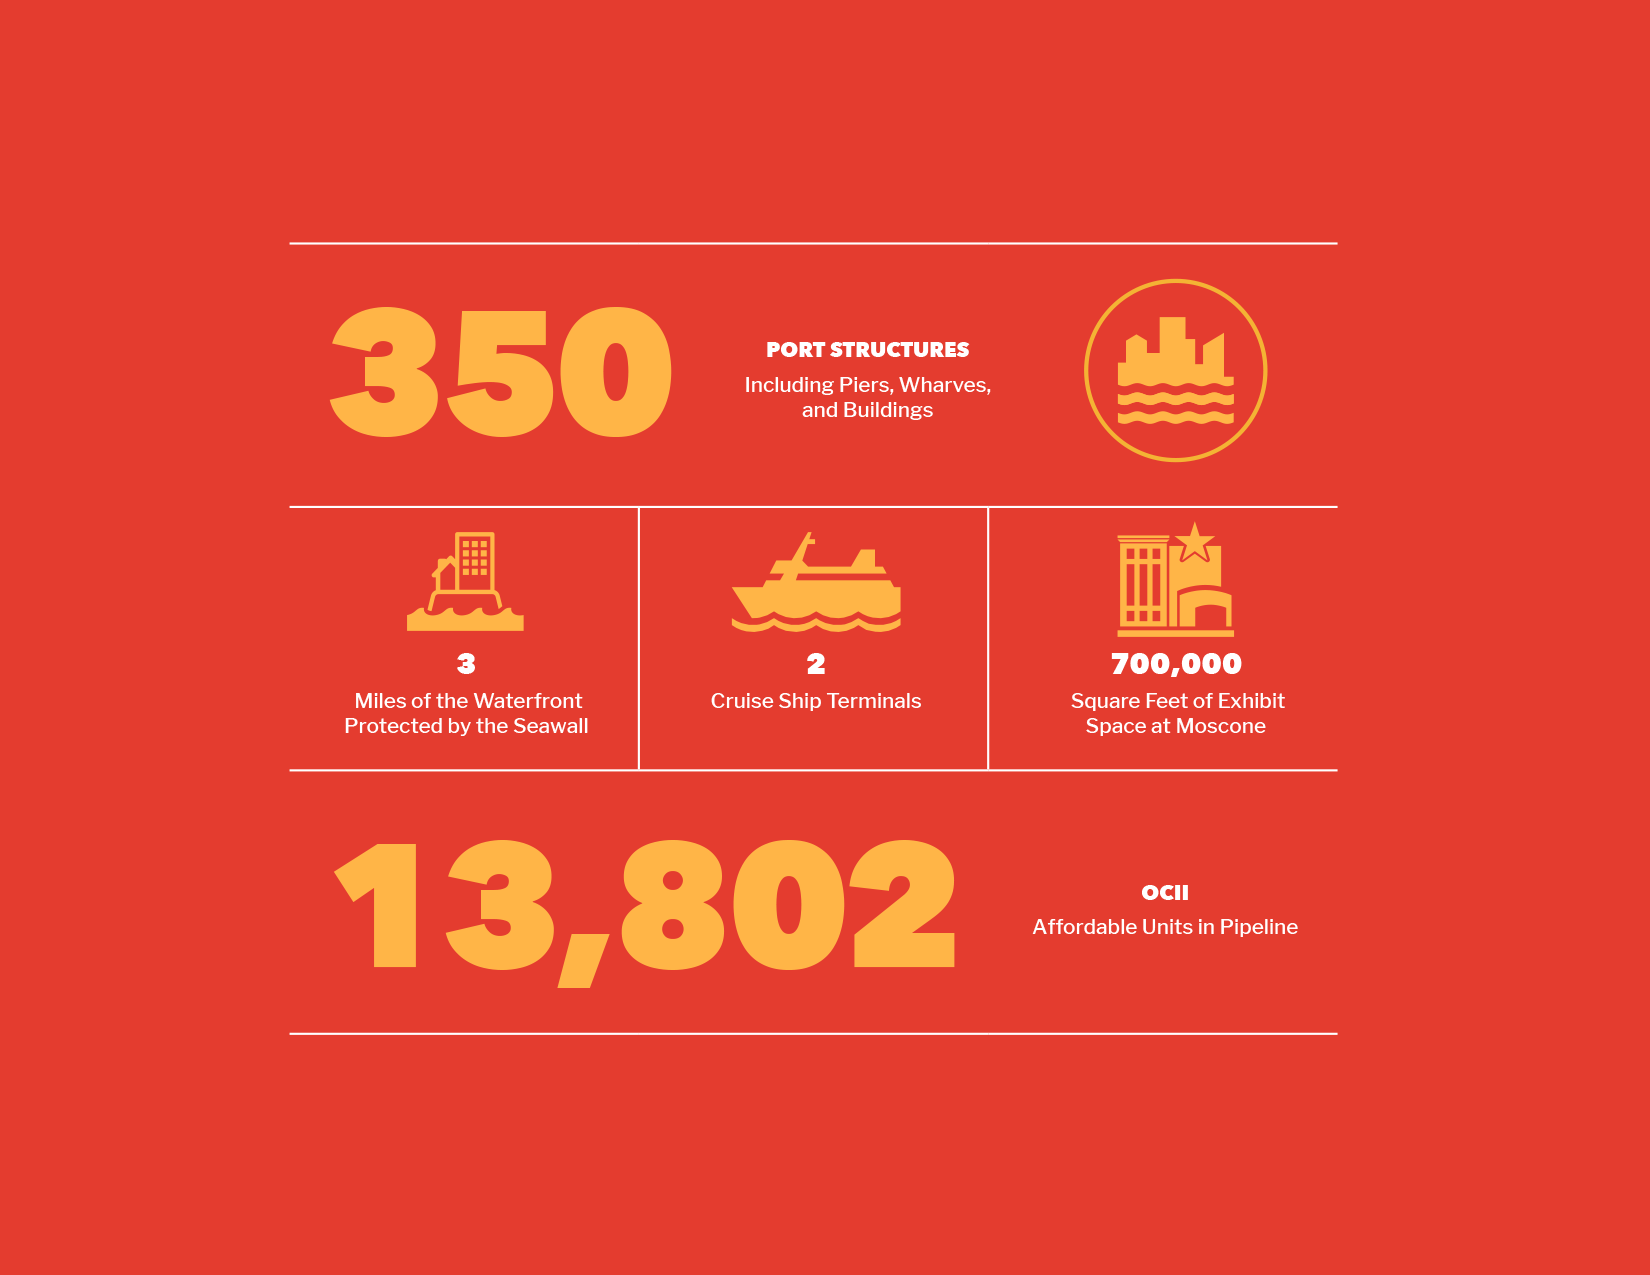
Port of San Francisco
The Port of San Francisco is responsible for the 7.5 miles of San Francisco waterfront adjacent to San Francisco Bay. The Port manages, maintains, develops, markets, and leases all of the property in this area. The Port’s operating portfolio is composed of approximately 580 ground, commercial, retail, office, industrial, and maritime leases, including leases of many internationally recognized landmarks such as Fisherman’s Wharf, Pier 39, the Ferry Building, and Oracle Park, home of the San Francisco Giants baseball team.
Port lands must be used consistently with public trust principles for the benefit of all California citizens, to further navigation and maritime commerce, fisheries, public access and recreation, environmental restoration, and commercial activities that attract the public to the waterfront. Urban waterfront developments, including the new Southern Bayfront neighborhood developments proposed in the Mission Rock, Orton, and Brookfield Properties (formerly Forest City Realty Trust) projects, require detailed coordination, review, and approval of many government agencies. The Port has also secured State legislation to allow non-trust uses of specified Port lands and created special financing districts to support waterfront improvements. Such advances were made possible by developing a common understanding with partner agencies of project objectives and requirements to restore historic structures and improve the waterfront for maritime and public use and enjoyment.
Caring for the Port’s many aging, historic structures while staying true to its public trust mission is a challenge. The Port’s need for capital investments has historically outpaced available funding, leaving a substantial backlog and requiring strategic decisions about how to best manage the Port’s aging assets. The Port has confronted this challenge with dedicated funds, pursuit of new external sources, and strategic prioritization.
Office of Community Investment and Infrastructure
The Office of Community Investment and Infrastructure is the successor agency to the San Francisco Redevelopment Agency, which was dissolved in 2012 by order of the California Supreme Court. OCII is authorized to continue to implement the Major Approved Development Projects, which include the Mission Bay North and South Redevelopment Project Areas (Mission Bay), the Hunters Point Shipyard Redevelopment Project Area and Zone 1 of the Bayview Redevelopment Project Area (Shipyard/Candlestick Point), and the Transbay Redevelopment Project Area (Transbay).
The Mission Bay development covers 303 acres of land between the San Francisco Bay and Interstate-280. The development program for Mission Bay includes market-rate and affordable housing; new commercial space; a new UCSF research campus and medical center; neighborhood-serving retail space; a 250-room hotel; new public open space; and myriad community facilities.
The Shipyard/Candlestick Point is comprised of nearly 780 acres of abandoned and underutilized land along San Francisco’s southeastern Bayfront. These long-abandoned waterfront lands will be transformed into areas for jobs, parks, and housing. The development will feature up to 12,100 homes, of which nearly one-third will be affordable; nearly 900,000 square feet of neighborhood retail; and three million square feet of commercial space; and 26 acres of parks and open space.
The Transbay development includes the new Salesforce Transit Center and 10 acres of former freeway parcels, which OCII and the Transbay Joint Powers Authority (TJPA) are developing into a new, mixed-use neighborhood surrounding a state-of-the-art, multi-modal transit station. The TJPA is responsible for constructing, owning and operating the new Transit Center, and OCII is responsible for the development of the surrounding neighborhood. At full build-out, these publicly-owned parcels will be transformed into approximately 3,300 new housing units, including nearly 1,400 affordable units, three million square feet of new commercial development, and 3.6 acres of parks and open space.
Treasure Island Development Authority
Treasure Island and Yerba Buena Island are in San Francisco Bay, about halfway between the San Francisco mainland and Oakland. Treasure Island contains approximately 404 acres of land, and Yerba Buena Island, approximately 150 acres. In early 2003, the Treasure Island Development Authority and the Treasure Island Community Development, LLC (TICD) entered into an Exclusive Negotiating Agreement and began work on a Development Plan for the Islands.
The Treasure Island/Yerba Buena Island Development Project will create a new San Francisco neighborhood consisting of up to 8,000 new residential housing units, as well as new commercial and retail space. The Project will also feature new hotel accommodations and 300 acres of parks and public open space, including shoreline access and cultural uses. Transportation amenities being built for the project will enhance mobility on the Islands as well as link the Islands to San Francisco. These amenities will include new and upgraded streets and public byways; bicycle, transit, and pedestrian facilities; landside and waterside facilities for the existing Treasure Island Sailing Center; an expanded marina; and a new Ferry Terminal.
HOPE SF
HOPE SF is an anti-poverty initiative that works to revitalize San Francisco’s largest and most distressed public housing sites as mixed-income developments. The HOPE SF public housing sites are Hunters View, Alice Griffith, Potrero Terrace and Annex, and Sunnydale and Velasco. All of these projects are former San Francisco Housing Authority sites, now being converted to private management. The real estate and infrastructure component of HOPE SF requires the complete demolition and rebuilding of the four sites along with the creation of new streets, parks and open spaces, and community space that will physically reconnect these sites to their surrounding neighborhoods. These projects also replace and generate new affordable housing units, which is discussed in further detail in the Affordable Housing chapter.
Planning Department-Neighborhood Development
The San Francisco Planning Department helps to create a built environment that supports growth by providing guidance on land use and zoning policy, urban design, public realm enhancements, and environmental planning. As San Francisco’s economy continues to expand, the City has adopted specific Area Plans to channel new development and to provide a framework for adding housing and jobs that move San Francisco forward. These Plan Areas are Balboa Park, Eastern Neighborhoods, Market Octavia, Rincon Hill, Transit Center, and Visitacion Valley. The City recently adopted a new area plan for Central SoMa and is developing another for the Hub. New infrastructure projects planned in these areas include improvements to transportation networks, streetscape enhancements to create inviting pedestrian corridors, new open spaces, and other quality of life improvements.
MOHCD: Mayor’s Office of Housing and Community Development
OCII: Office of Community Investment and Infrastructure
PLANNING: Impact Development Plan Areas
PORT: Port of San Francisco
TIDA: Treasure Island Development Authority
San Francisco is growing as our neighborhoods, values, and economy continue to draw new residents. As of 2017 the population was 884,363, up 14% from 2000. Plan Bay Area, developed by the Association of Bay Area Governments, projects San Francisco will grow by 90,000 housing units and 190,000 jobs by 2040. As the city’s density increases, having sufficient infrastructure to support all residents in all neighborhoods becomes more challenging but also more important.
Real estate developments along the waterfront, the creation of new neighborhoods, and preparing existing neighborhoods for anticipated growth will increase the City’s infrastructure portfolio along with its tax base. Central SoMa, the Hub, Mission Bay, Candlestick Point, and Hunters Point Shipyards are just a few of the high-growth areas changing the face of San Francisco. Many of these developments and projects have distinctive funding mechanisms, including dedicated development fees and developer agreements that target improvements in areas of especially high growth. These projects seek to create well-planned, safe places to live, travel, work, and play.
This chapter includes capital projects from departments, agencies, and programs whose primary objectives are to improve San Francisco’s wide-ranging economic base and plan for its future growth.
Port of San Francisco
The Port of San Francisco is responsible for the 7.5 miles of San Francisco waterfront adjacent to San Francisco Bay. The Port manages, maintains, develops, markets, and leases all of the property in this area. The Port’s operating portfolio is composed of approximately 580 ground, commercial, retail, office, industrial, and maritime leases, including leases of many internationally recognized landmarks such as Fisherman’s Wharf, Pier 39, the Ferry Building, and AT&T Park, home of the San Francisco Giants baseball team.
Port lands must be used consistently with public trust principles for the benefit of all California citizens, to further navigation and maritime commerce, fisheries, public access and recreation, environmental restoration, and commercial activities that attract the public to the waterfront. Urban waterfront developments, including the new Southern Bayfront neighborhood developments proposed in the Mission Rock, Orton, and Forest City projects, require detailed coordination, review, and approval of many government agencies. The Port has also secured State legislation to allow non-trust uses of specified Port lands and created special financing districts to support waterfront improvements. Such advances were made possible by developing a common understanding with partner agencies of project objectives and requirements to restore historic structures and improve the waterfront for maritime and public use and enjoyment.
Caring for the Port’s many aging, historic structures while staying true to its public trust mission is a challenge. The Port’s need for capital investments has historically outpaced available funding, leaving a substantial backlog and requiring strategic decisions about how to best manage the Port’s aging assets. The Port has confronted this challenge with dedicated funds, pursuit of new external sources, and strategic prioritization.
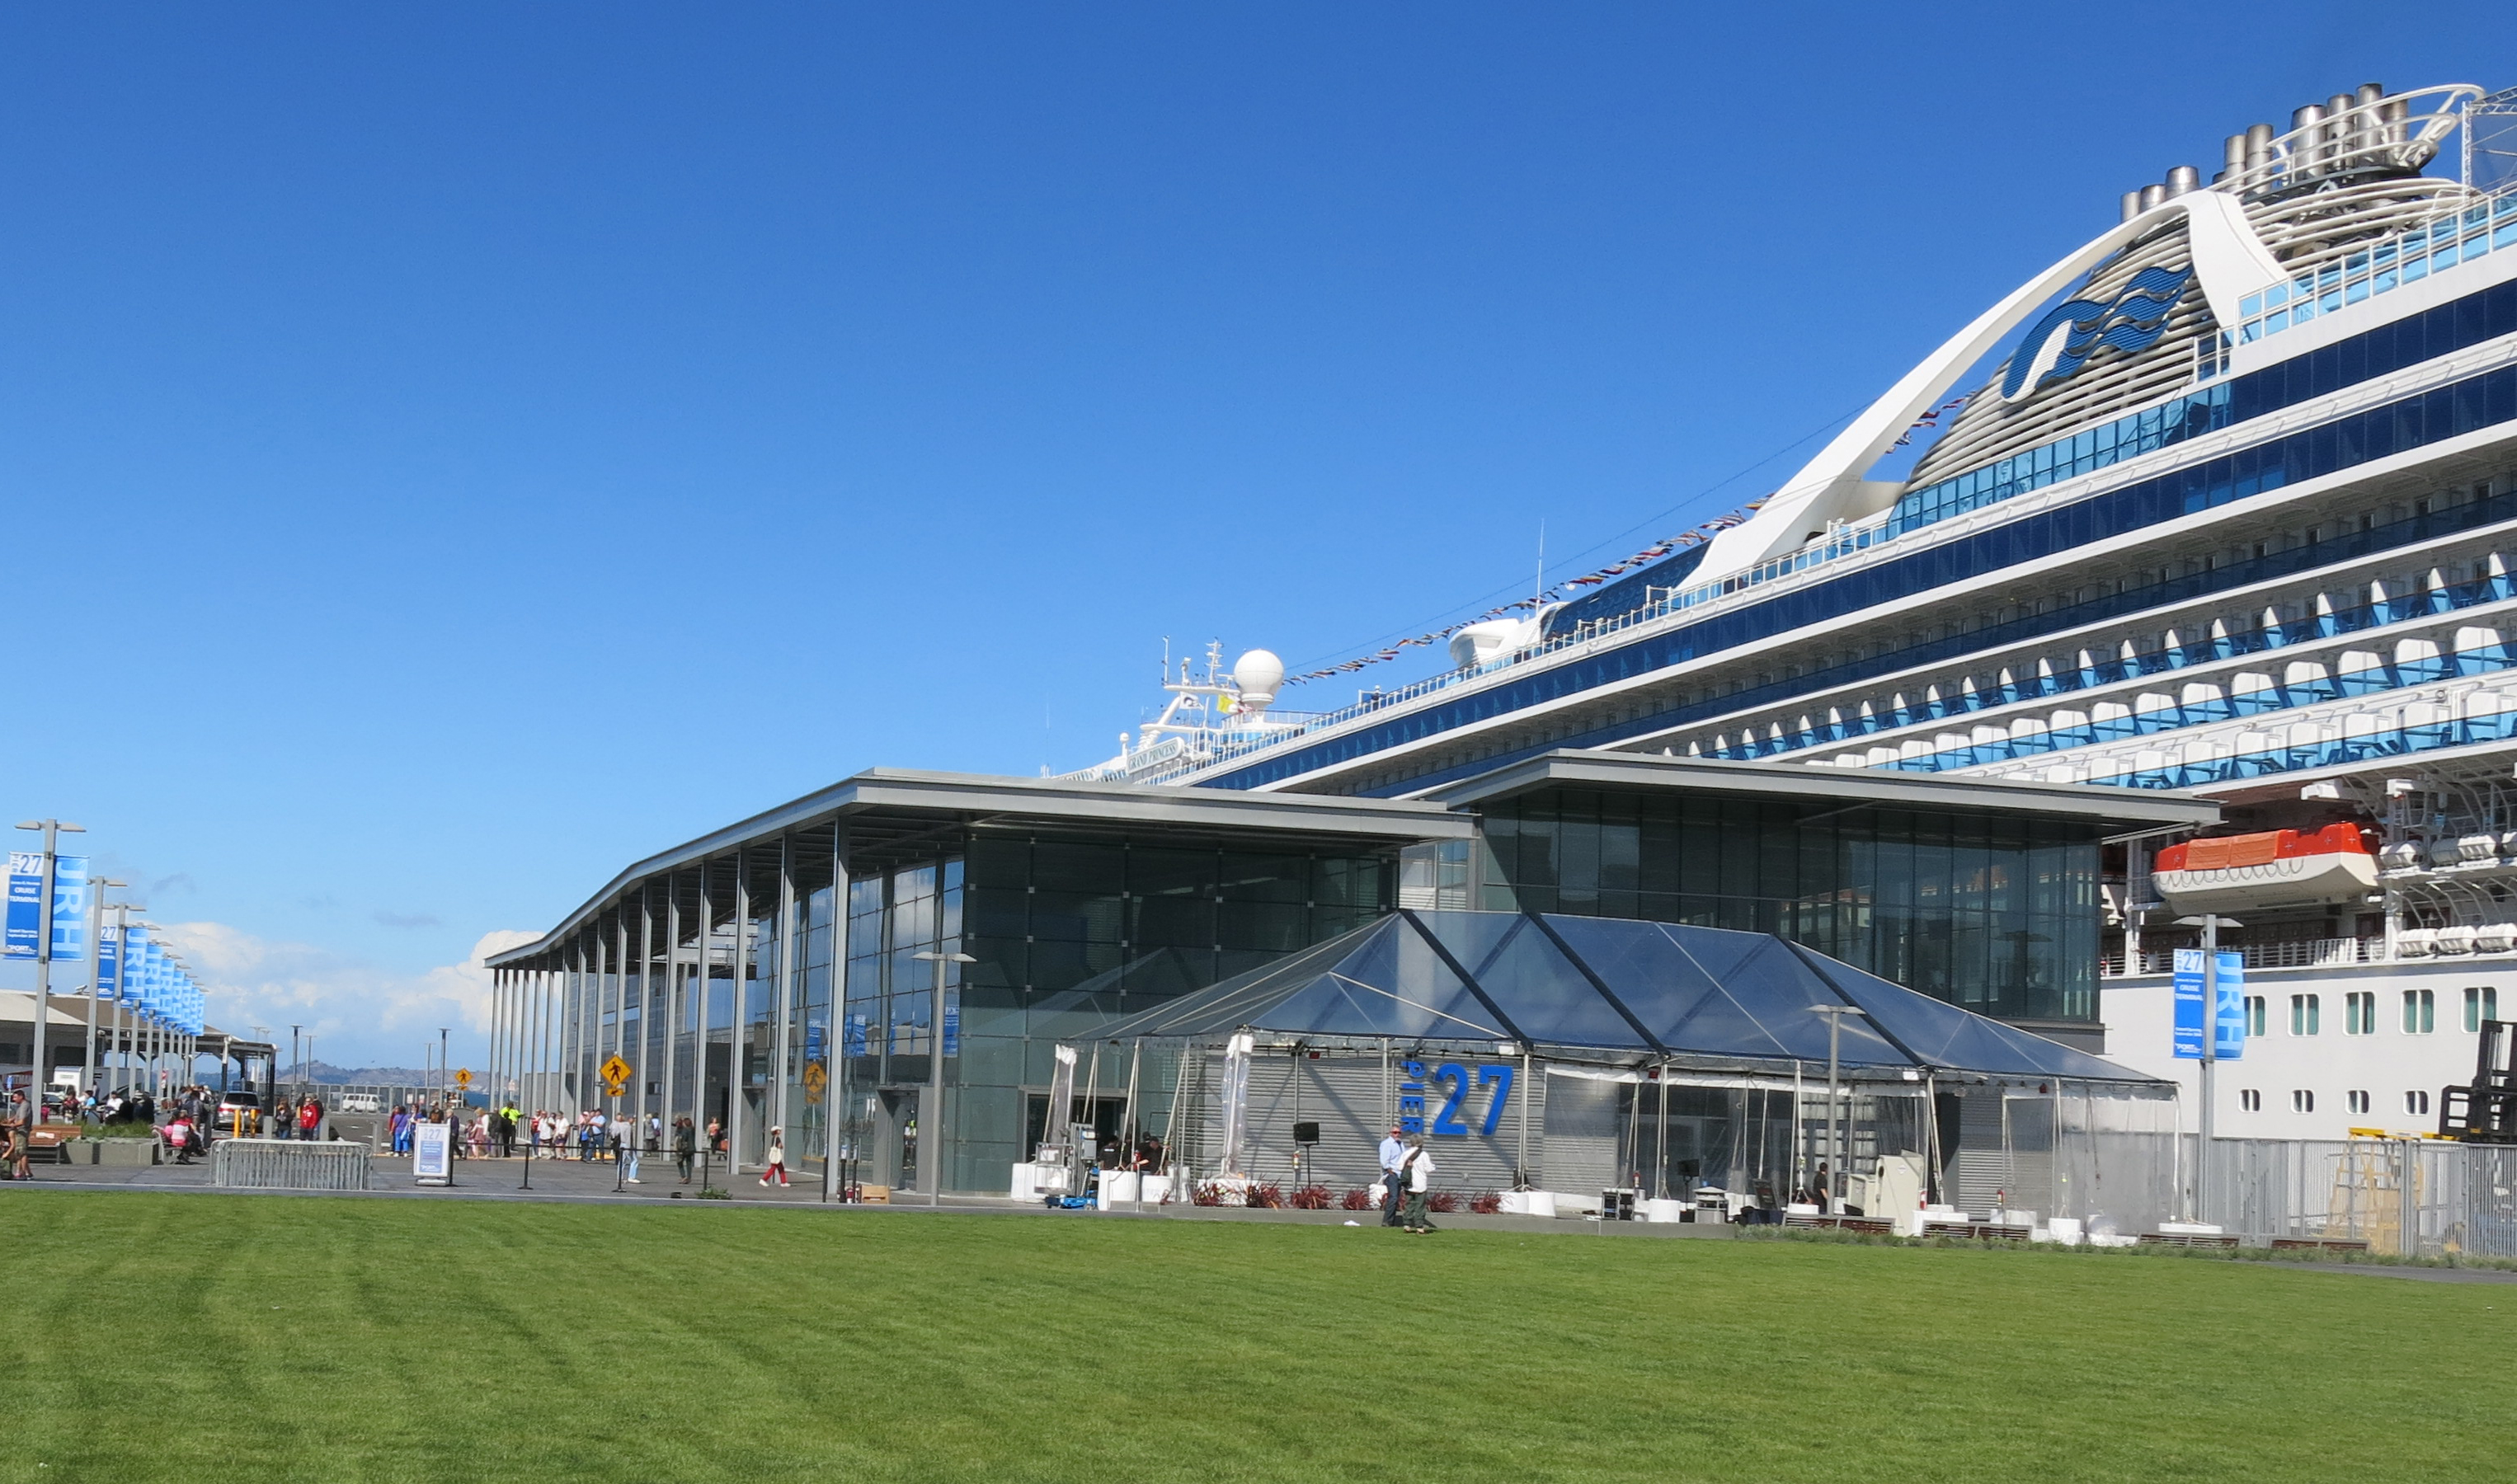
Cruise Terminal, Pier 27
Office of Community Investment and Infrastructure
The Office of Community Investment and Infrastructure is the successor agency to the San Francisco Redevelopment Agency, which was dissolved in 2012 by order of the California Supreme Court. OCII is authorized to continue to implement the Major Approved Development Projects, which include the Mission Bay North and South Redevelopment Project Areas (Mission Bay), the Hunters Point Shipyard Redevelopment Project Area and Zone 1 of the Bayview Redevelopment Project Area (Shipyard/Candlestick Point), and the Transbay Redevelopment Project Area (Transbay).
The Mission Bay development covers 303 acres of land between the San Francisco Bay and Interstate-280. The development program for Mission Bay includes market-rate and affordable housing; new commercial space; a new UCSF research campus and medical center; neighborhood-serving retail space; a 250-room hotel; new public open space; and myriad community facilities.
The Shipyard/Candlestick Point is comprised of nearly 780 acres of abandoned and underutilized land along San Francisco’s southeastern Bayfront. These long-abandoned waterfront lands will be transformed into areas for jobs, parks, and housing. The development will feature up to 12,100 homes, of which nearly one-third will be affordable; nearly 900,000 square feet of neighborhood retail; and three million square feet of commercial space; and 26 acres of parks and open space.
The Transbay development includes the new Salesforce Transit Center and 10 acres of former freeway parcels, which OCII and the Transbay Joint Powers Authority (TJPA) are developing into a new, mixed-use neighborhood surrounding a state-of-the-art, multi-modal transit station. The TJPA is responsible for constructing, owning and operating the new Transit Center, and OCII is responsible for the development of the surrounding neighborhood. At full build-out, these publicly-owned parcels will be transformed into approximately 3,300 new housing units, including nearly 1,400 affordable units, three million square feet of new commercial development, and 3.6 acres of parks and open space.
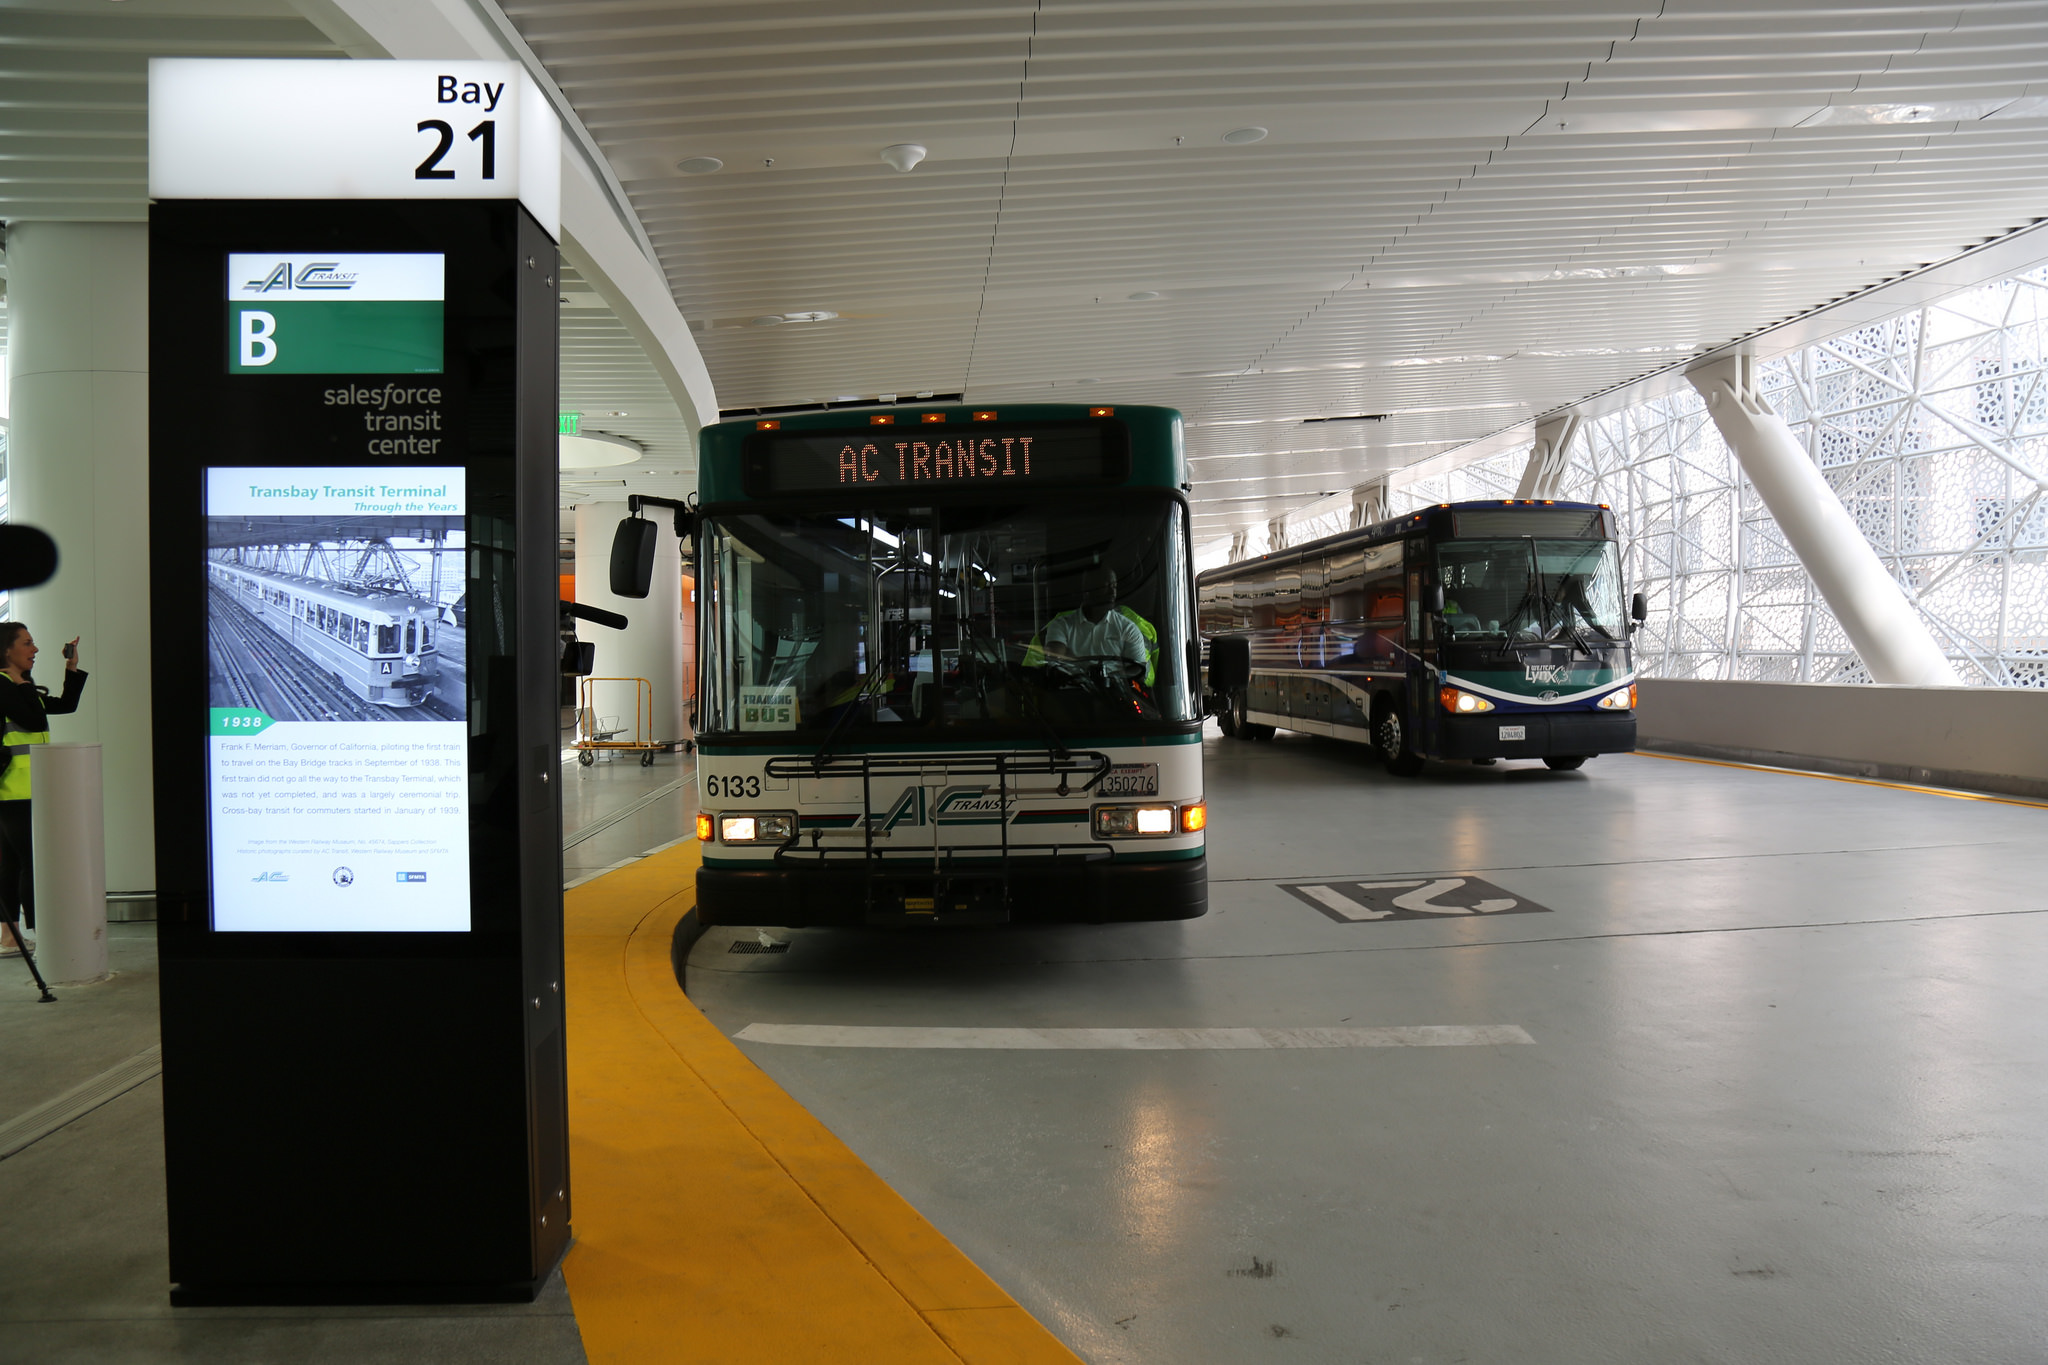
Transbay Bus Terminal
Treasure Island Development Authority
Treasure Island and Yerba Buena Island are in San Francisco Bay, about halfway between the San Francisco mainland and Oakland. Treasure Island contains approximately 404 acres of land, and Yerba Buena Island, approximately 150 acres. In early 2003, the Treasure Island Development Authority and the Treasure Island Community Development, LLC (TICD) entered into an Exclusive Negotiating Agreement and began work on a Development Plan for the Islands.
The Treasure Island/Yerba Buena Island Development Project will create a new San Francisco neighborhood consisting of up to 8,000 new residential housing units, as well as new commercial and retail space. The Project will also feature new hotel accommodations and 300 acres of parks and public open space, including shoreline access and cultural uses. Transportation amenities being built for the project will enhance mobility on the Islands as well as link the Islands to San Francisco. These amenities will include new and upgraded streets and public byways; bicycle, transit, and pedestrian facilities; landside and waterside facilities for the existing Treasure Island Sailing Center; an expanded marina; and a new Ferry Terminal.
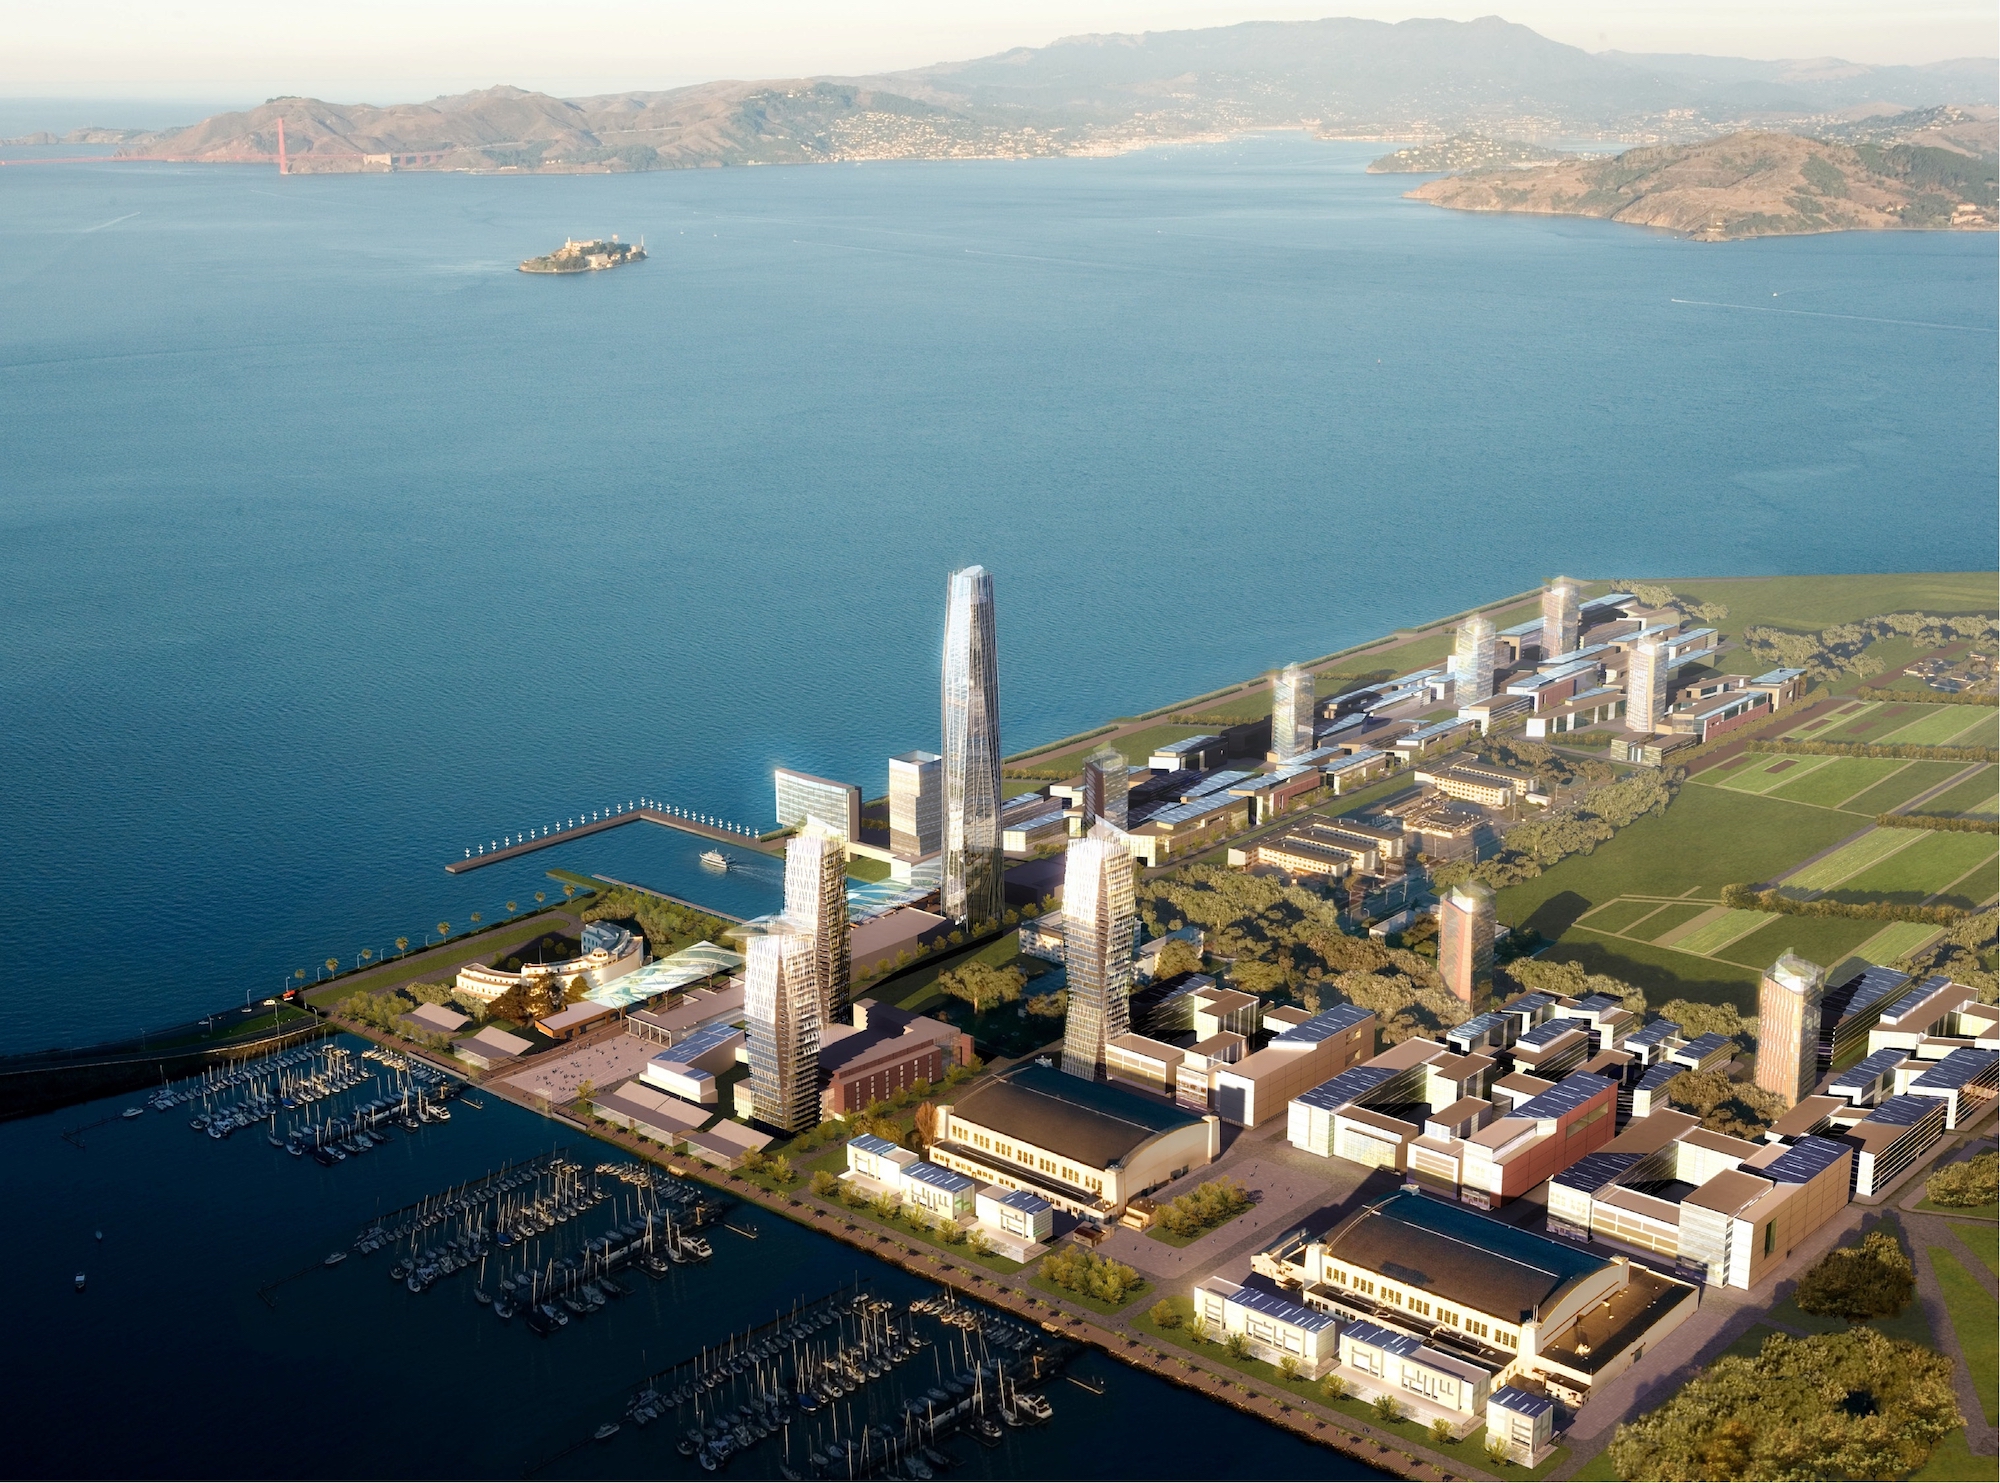
Planned Treasure Island Redevelopment
Planning Department – Neighborhood Development
The San Francisco Planning Department helps to create a built environment that supports our own growth by providing guidance on land use and zoning policy, urban design, public realm enhancements, and environmental planning. As San Francisco’s economy continues to expand, the City has adopted specific Area Plans to channel new development and to provide a framework for adding housing and jobs that move San Francisco forward. These Plan Areas are Balboa Park, Eastern Neighborhoods, Market Octavia, Rincon Hill, Transit Center, and Visitacion Valley. The City recently adopted a new area plan for Central SoMa and is developing another for the Hub. New infrastructure projects planned in these areas include improvements to transportation networks, streetscape enhancements to create inviting pedestrian corridors, new open spaces, and other quality of life improvements.
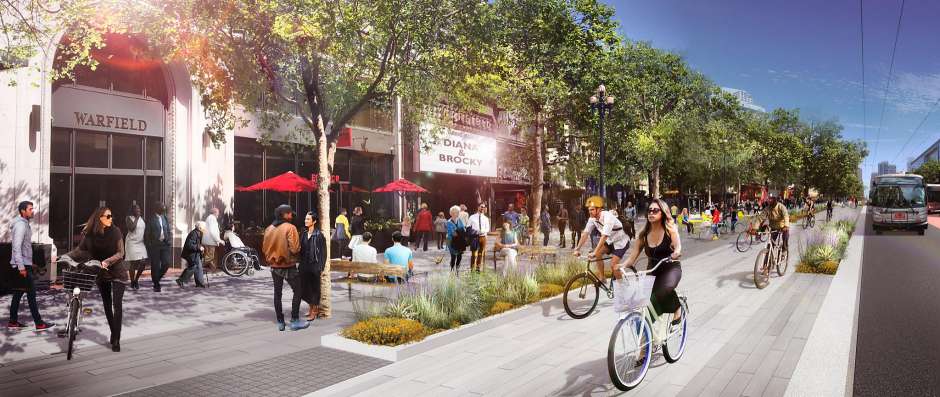
Better Market Street
Affordable Housing
The responsibilities of San Francisco’s housing agencies have been evolving in recent years. In 2012 staff from the City and the San Francisco Housing Authority (SFHA), along with representatives of 72 different community organizations, met over a four-month period to re-envision the roles and responsibilities of SFHA. One of the primary goals of that process was addressing the $270 million backlog of deferred maintenance needs in the public housing stock. The resulting strategy addressed critical immediate and long-term rehabilitation needs while preserving affordability and improving conditions for very low-income residents.
As part of this strategy, SFHA set out to convert the majority of its public housing units to private, non-profit-led ownership and management to enable the use of tax credits as a funding source for these properties. SFHA will continue to ensure compliance with eligibility and other programmatic requirements at these sites, but the management of the facilities will no longer be SFHA’s responsibility. It is expected that 4,575 housing units, including those at HOPE SF sites, will be converted through this process, leaving approximately 1,460 public housing units along with partnership interests in HOPE VI sites in the SFHA portfolio. SFHA capital is discussed in Chapter Eight: Health and Human Services.
The mission of MOHCD is to coordinate the City’s housing policy; provide financing for the development, rehabilitation, and purchase of affordable housing in San Francisco; and strengthen the social, physical, and economic infrastructure of San Francisco's low-income neighborhoods and communities in need. MOHCD administers the HOPE SF initiative, and it also manages the funding available through the 2015 Affordable Housing General Obligation Bond and the Housing Trust Fund. Additionally, MOHCD serves as the Successor Housing Agency, responsible for all former San Francisco Redevelopment Agency affordable housing assets.
HOPE SF is an anti-poverty initiative that works to revitalize San Francisco’s largest and most distressed public housing sites as mixed-income developments. This effort calls for a wide variety of capital improvements, beginning with horizontal infrastructure improvements that pave the way for new homes, community facilities, and open spaces. The HOPE SF public housing sites are Hunters View, Alice Griffith, Potrero Terrace and Annex, and Sunnydale and Velasco. All of these projects are former San Francisco Housing Authority sites, now being converted to private management.
The real estate and infrastructure component of HOPE SF requires the complete demolition and rebuilding of the four sites along with new streets, parks and open spaces, and community space that will physically reconnect these sites to their surrounding neighborhoods. HOPE SF also includes family-focused community building, neighborhood-based health and wellness supports, integrated neighborhood education supports, targeted early care supports, economic mobility pathways for youth, and community policing. In total, the City’s HOPE SF initiative replaces 1,904 public housing units, adds 1,026 new affordable housing units serving low- and very-low income households, and provides 2,357 workforce units for sale and for rent.
San Francisco needs to build more affordable housing in order to keep our communities stable. In 2015 voters approved a $310 million Affordable Housing G.O. Bond. This Plan proposes another for $500 million in November 2019 to address our continuing affordability crisis and the related underlying infrastructure needs. Should additional G.O. Bond Program capacity be identified in time, the Board of Supervisors has resolved unanimously to support the assignment of that increased capacity to the 2019 Affordable Housing Bond.
San Francisco's unaffordability crisis is wide-reaching, and vulnerable populations are especially affected. In particular there is an emerging need of housing stabilization for San Francisco's aging residents due to the fast-growing population of seniors who need a range of affordable housing solutions so that they can continue living in the city they call home.
Altogether MOHCD’s portfolio of affordable housing now includes more than 21,000 units for seniors, families, formerly homeless individuals, and people with disabilities. The affordable housing that MOHCD supports is developed, owned and, managed by private non-profit and for-profit entities that leverage City subsidies with state and federal resources to create permanent affordable housing opportunities.