New Capital Sources: Other Sources

Other Sources

The City has several sources of funding for capital projects that are derived from specific sources and designated for specific purposes. For example, the Marina Yacht Harbor Fund receives revenues generated by users of the Yacht Harbor and applies them to projects such as sediment remediation and security and lighting systems. The Open Space Fund sets aside funds from annual property tax revenues, outside private sources, and Recreation and Parks Department revenues, and applies those funds to open space expenditures. In the first year of the Capital Plan, these funds are expected to provide nearly $70 million, as shown in Table 5.6. These figures are pulled from Year 2 of the most recently completed budget cycle.

Table 5.6

Other Capital Funds and FY2020 Funding Amount

(Dollars in Millions)

Fund Name


Road Maintenance and Rehabilitation Fund

23.5
Library Fund 14.8
Laguna Honda Hospital 5.9
War Memorial Projects 4.9
Open Space Fund 4.2
Marina Yacht Harbor Fund 3.2
Special Gas Tax Street Improvement Fund 3.1
Convention & Facilities Fund 3.0
SF General Hospital 2.5
Other Special Revenue Fund 2.1
Road Fund 1.7
Golf Fund 0.4
Grand Total 69.4


New Capital Sources: Regional Ballot Measures

Regional Ballot Measures

Senate Bill 1 (SB1)

SB1, the Road Repair and Accountability Act of 2017, is a landmark transportation investment package that increases funding for transportation infrastructure across California by more than $50 billion over the next 10 years. SB1 investments, funded by a combination of gas taxes and vehicle registration fees, are split equally between state-maintained transportation infrastructure and local transportation priorities including local streets, transit, and pedestrian and bicycle projects.

SB1 provides San Francisco with over $60 million per year in formula-based funds that will be used to repave and maintain our roads as part of the Pay-Go Program, maintain and upgrade our rail infrastructure, and increase Muni service on our city’s most crowded lines. In addition, regional transit providers like BART, Caltrain, and the San Francisco Bay Ferry will receive over $25 million per year for much-needed improvements including escalator upgrades, hiring more police officers and station cleaners, improving safety and reliability, and enhancing ferry service.

Regional Measure 3 (RM3)

RM3 was passed by voters on the June 2018 ballot in the nine-county San Francisco Bay Area to build major roadway and public transit improvements with increased tolls on all Bay Area toll bridges except the Golden Gate Bridge. RM3 would implement toll increases of one dollar in 2019, one dollar in 2022, and one dollar in 2025. The revenue would be used to finance a $4.5 billion slate of highway and transit capital improvements along with $60 million annually to provide new bus and ferry service in congested bridge corridors and improved regional connectivity at the future Transbay Terminal. A legal challenge that was filed against the measure recently failed, but funds from this source have not been released to the City as of the time of publication.

Gross Receipts Tax for Homelessness

In November 2018 San Francisco voters approved Proposition C, a business tax measure to fund homelessness services. The measure applies a tax of 0.175% to 0.69% on gross receipts for businesses with over $50 million in gross annual receipts, or 1.5% of payroll expenses for certain businesses with over $1 billion in gross annual receipts and administrative offices in San Francisco.

The San Francisco Controller estimated that tax revenues under Proposition C would total between $250 million and $300 million annually. Tax revenues from Proposition C would be allocated to permanent housing, mental health services for homelessness individuals, homelessness preventions, and short-term shelters. Though the expected use for Prop C funds is primarily services, costs for shelter construction, supportive housing, or capital costs that could help end homelessness would be eligible uses for this source. As with RM3, Proposition C was approved by voters, but a legal challenge has been filed against the measure. The Treasurer’s Office will collect the tax, but the funds will be placed in reserve until the legal challenge has been resolved.

Hotel Tax for Arts and Culture

In November 2018 San Francisco voters approved Proposition E, which allocates 1.5% of the base hotel tax to arts and cultural purposes through the Hotel Room Tax Fund. Proposition E will provide a set-aside for various arts and cultural services including grants and a cultural equity endowment. Arts-related capital projects such as those at the City’s cultural centers would be an eligible use for the Arts Commission from this source at a baseline level of approximately $1 million. The Controller’s Office estimates an overall additional $13 million to arts spending in FY2022 as a result of this measure, depending on fluctuations in the tourist economy and growth of the hotel tax overall.

Homelessness Prevention Housing Bonds Measure

In November 2018 California voters approved Proposition 2, authorizing the state to bond against revenue from the so-called “millionaire’s tax” for homelessness prevention housing for persons in need of mental health services. San Francisco has a longstanding need for homelessness prevention housing and mental health services and facilities, and a full spending plan for these revenues is under development.

New Capital Sources: Special Finance Districts

Special Finance Districts

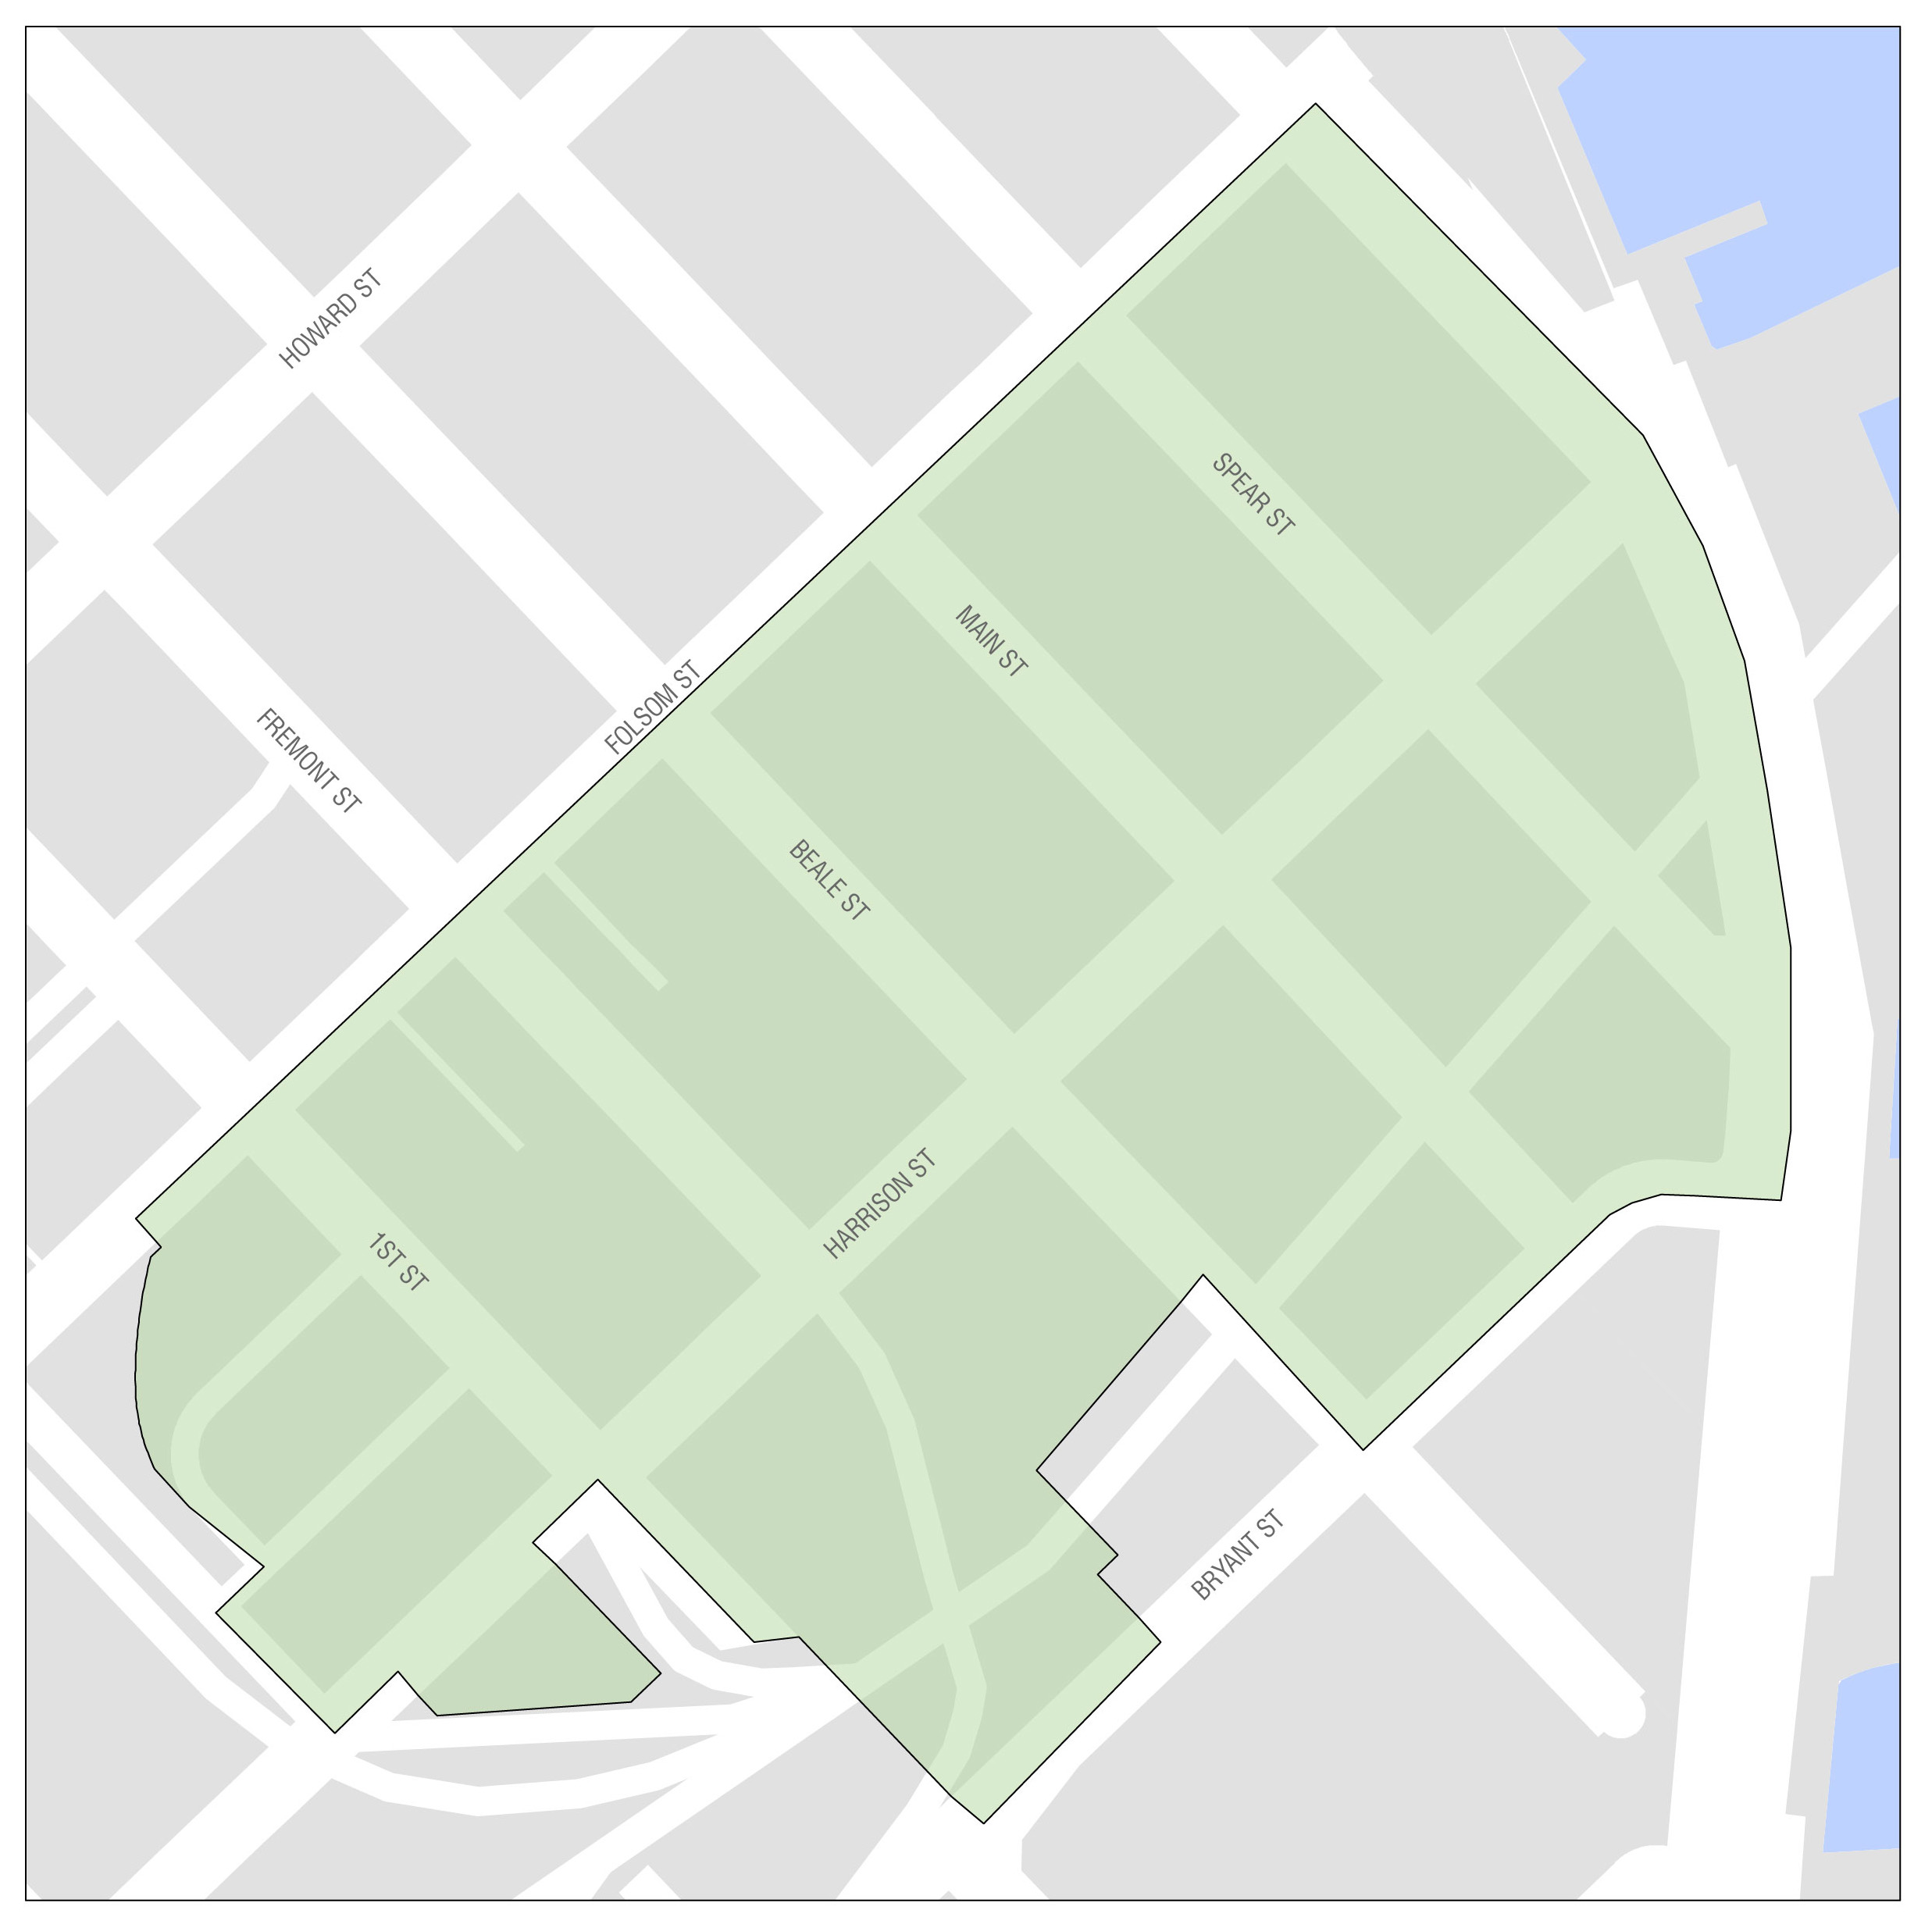
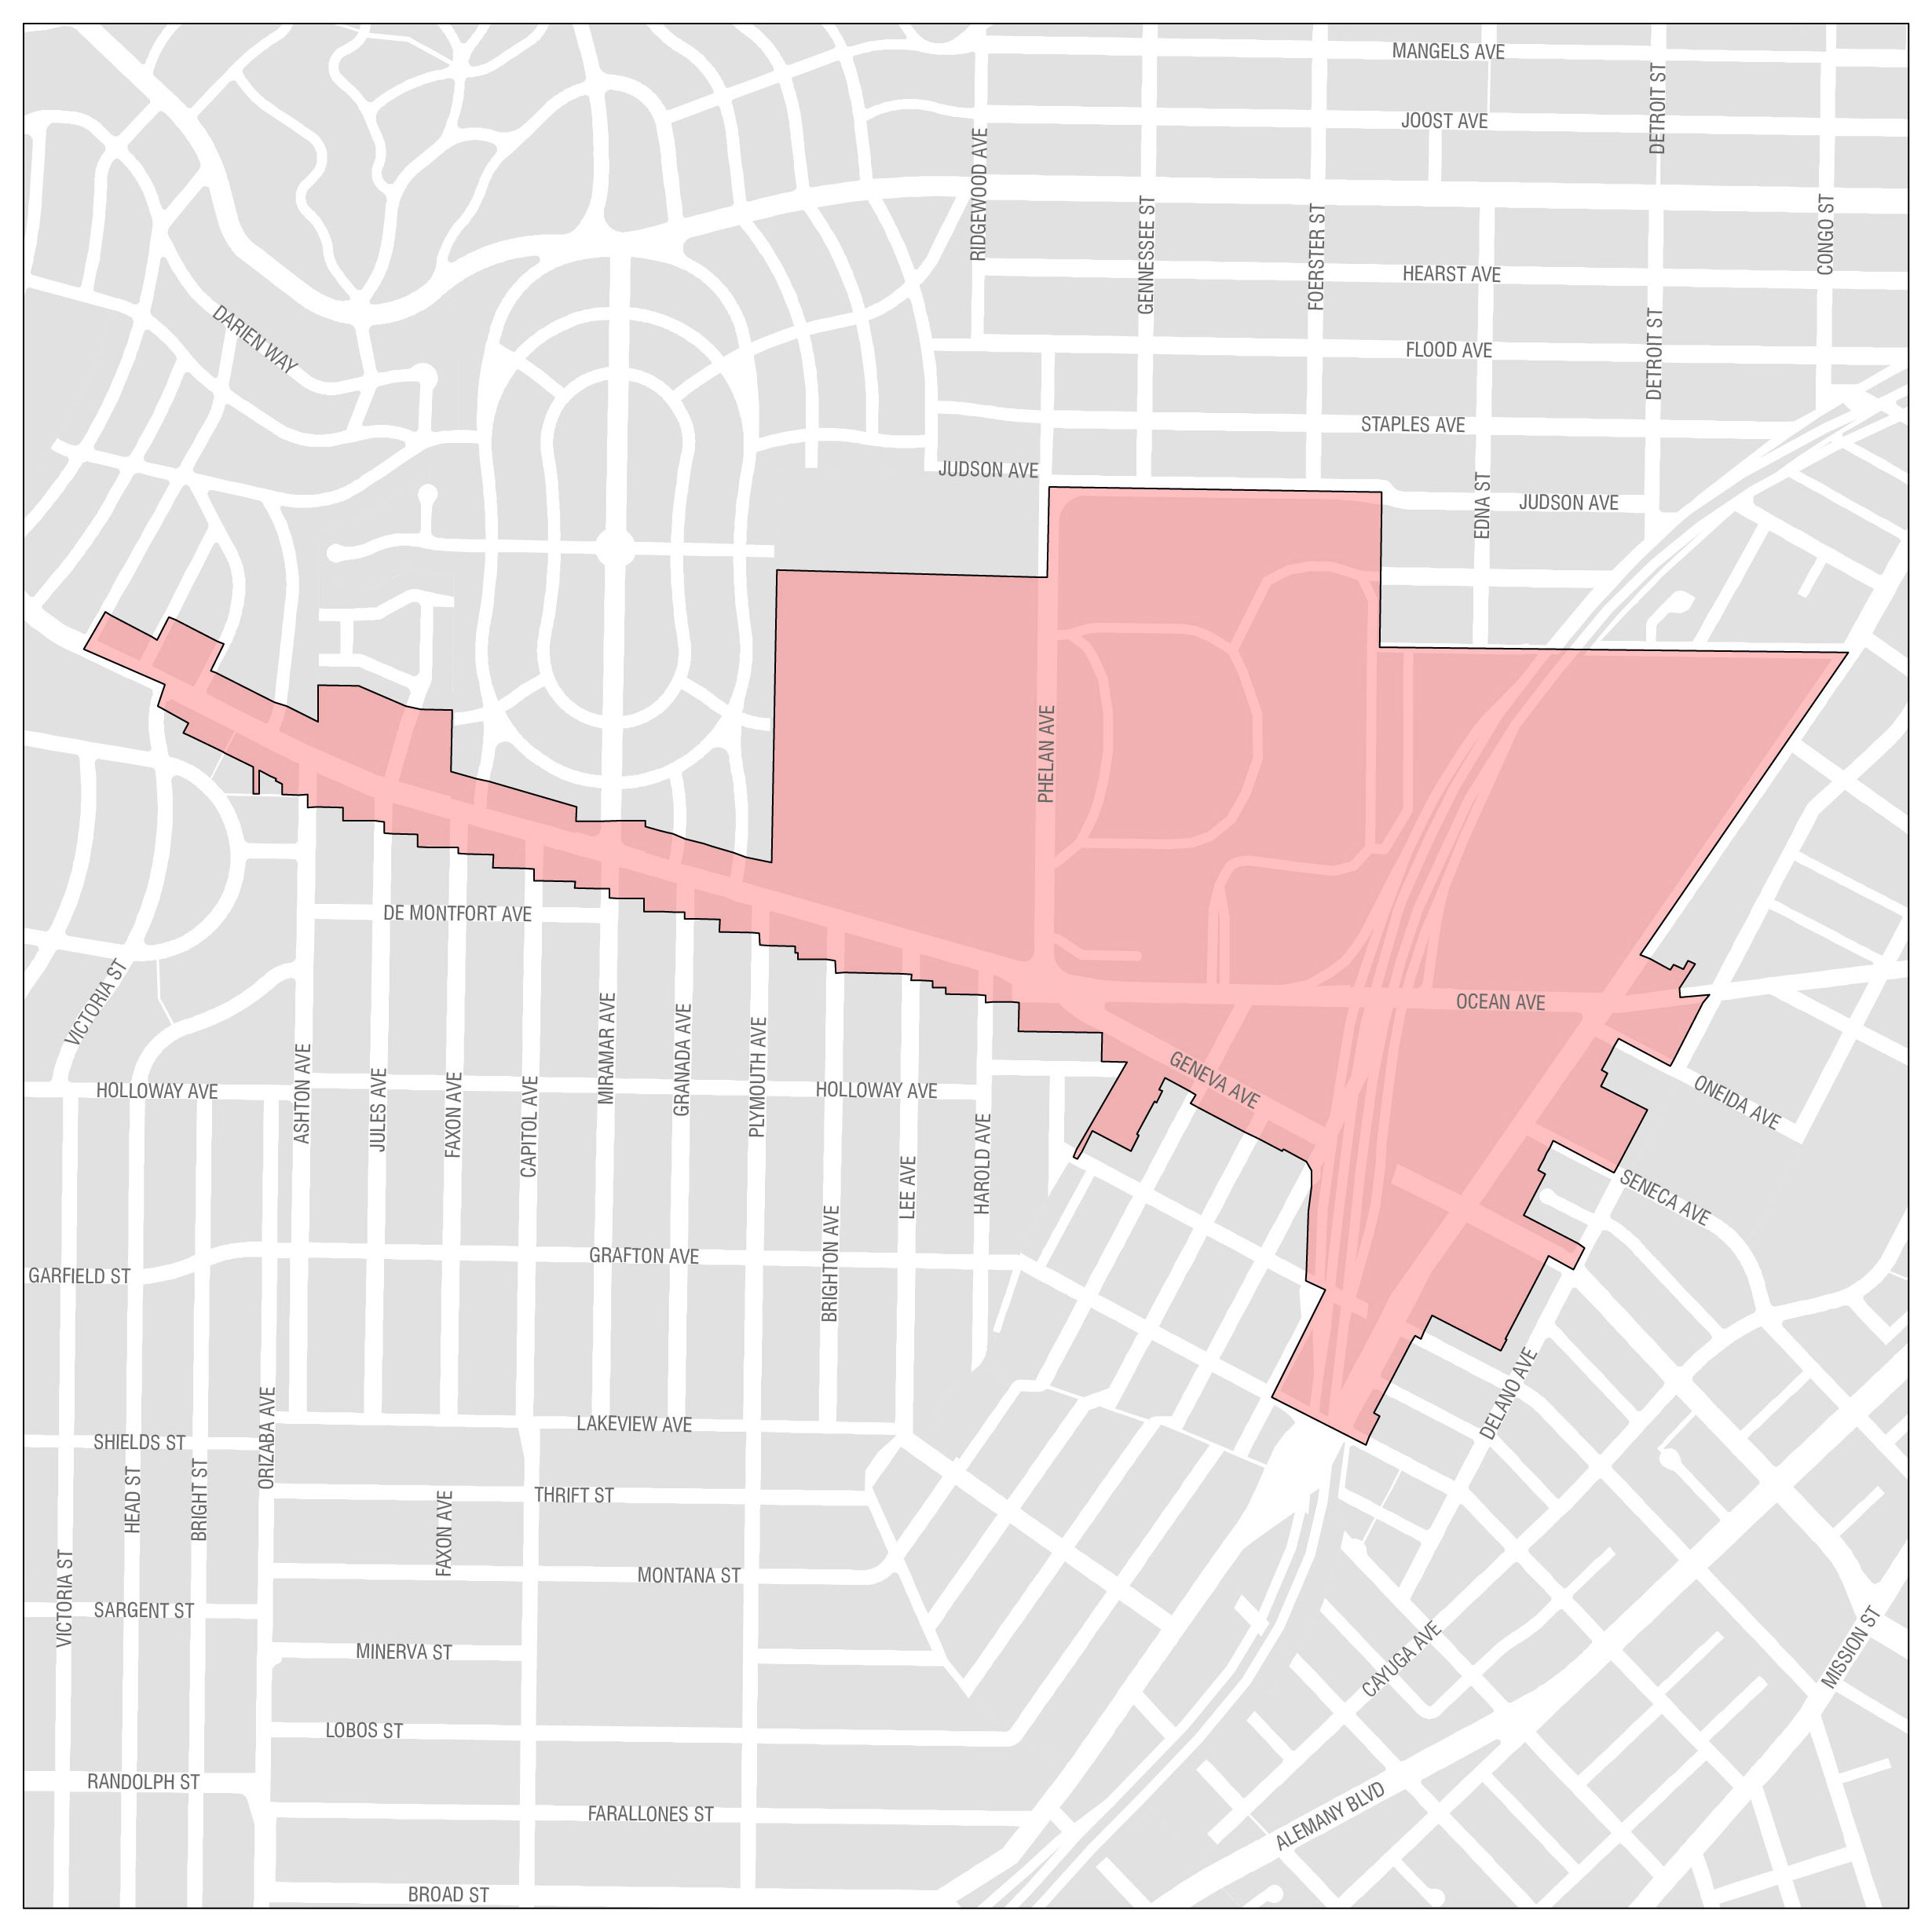
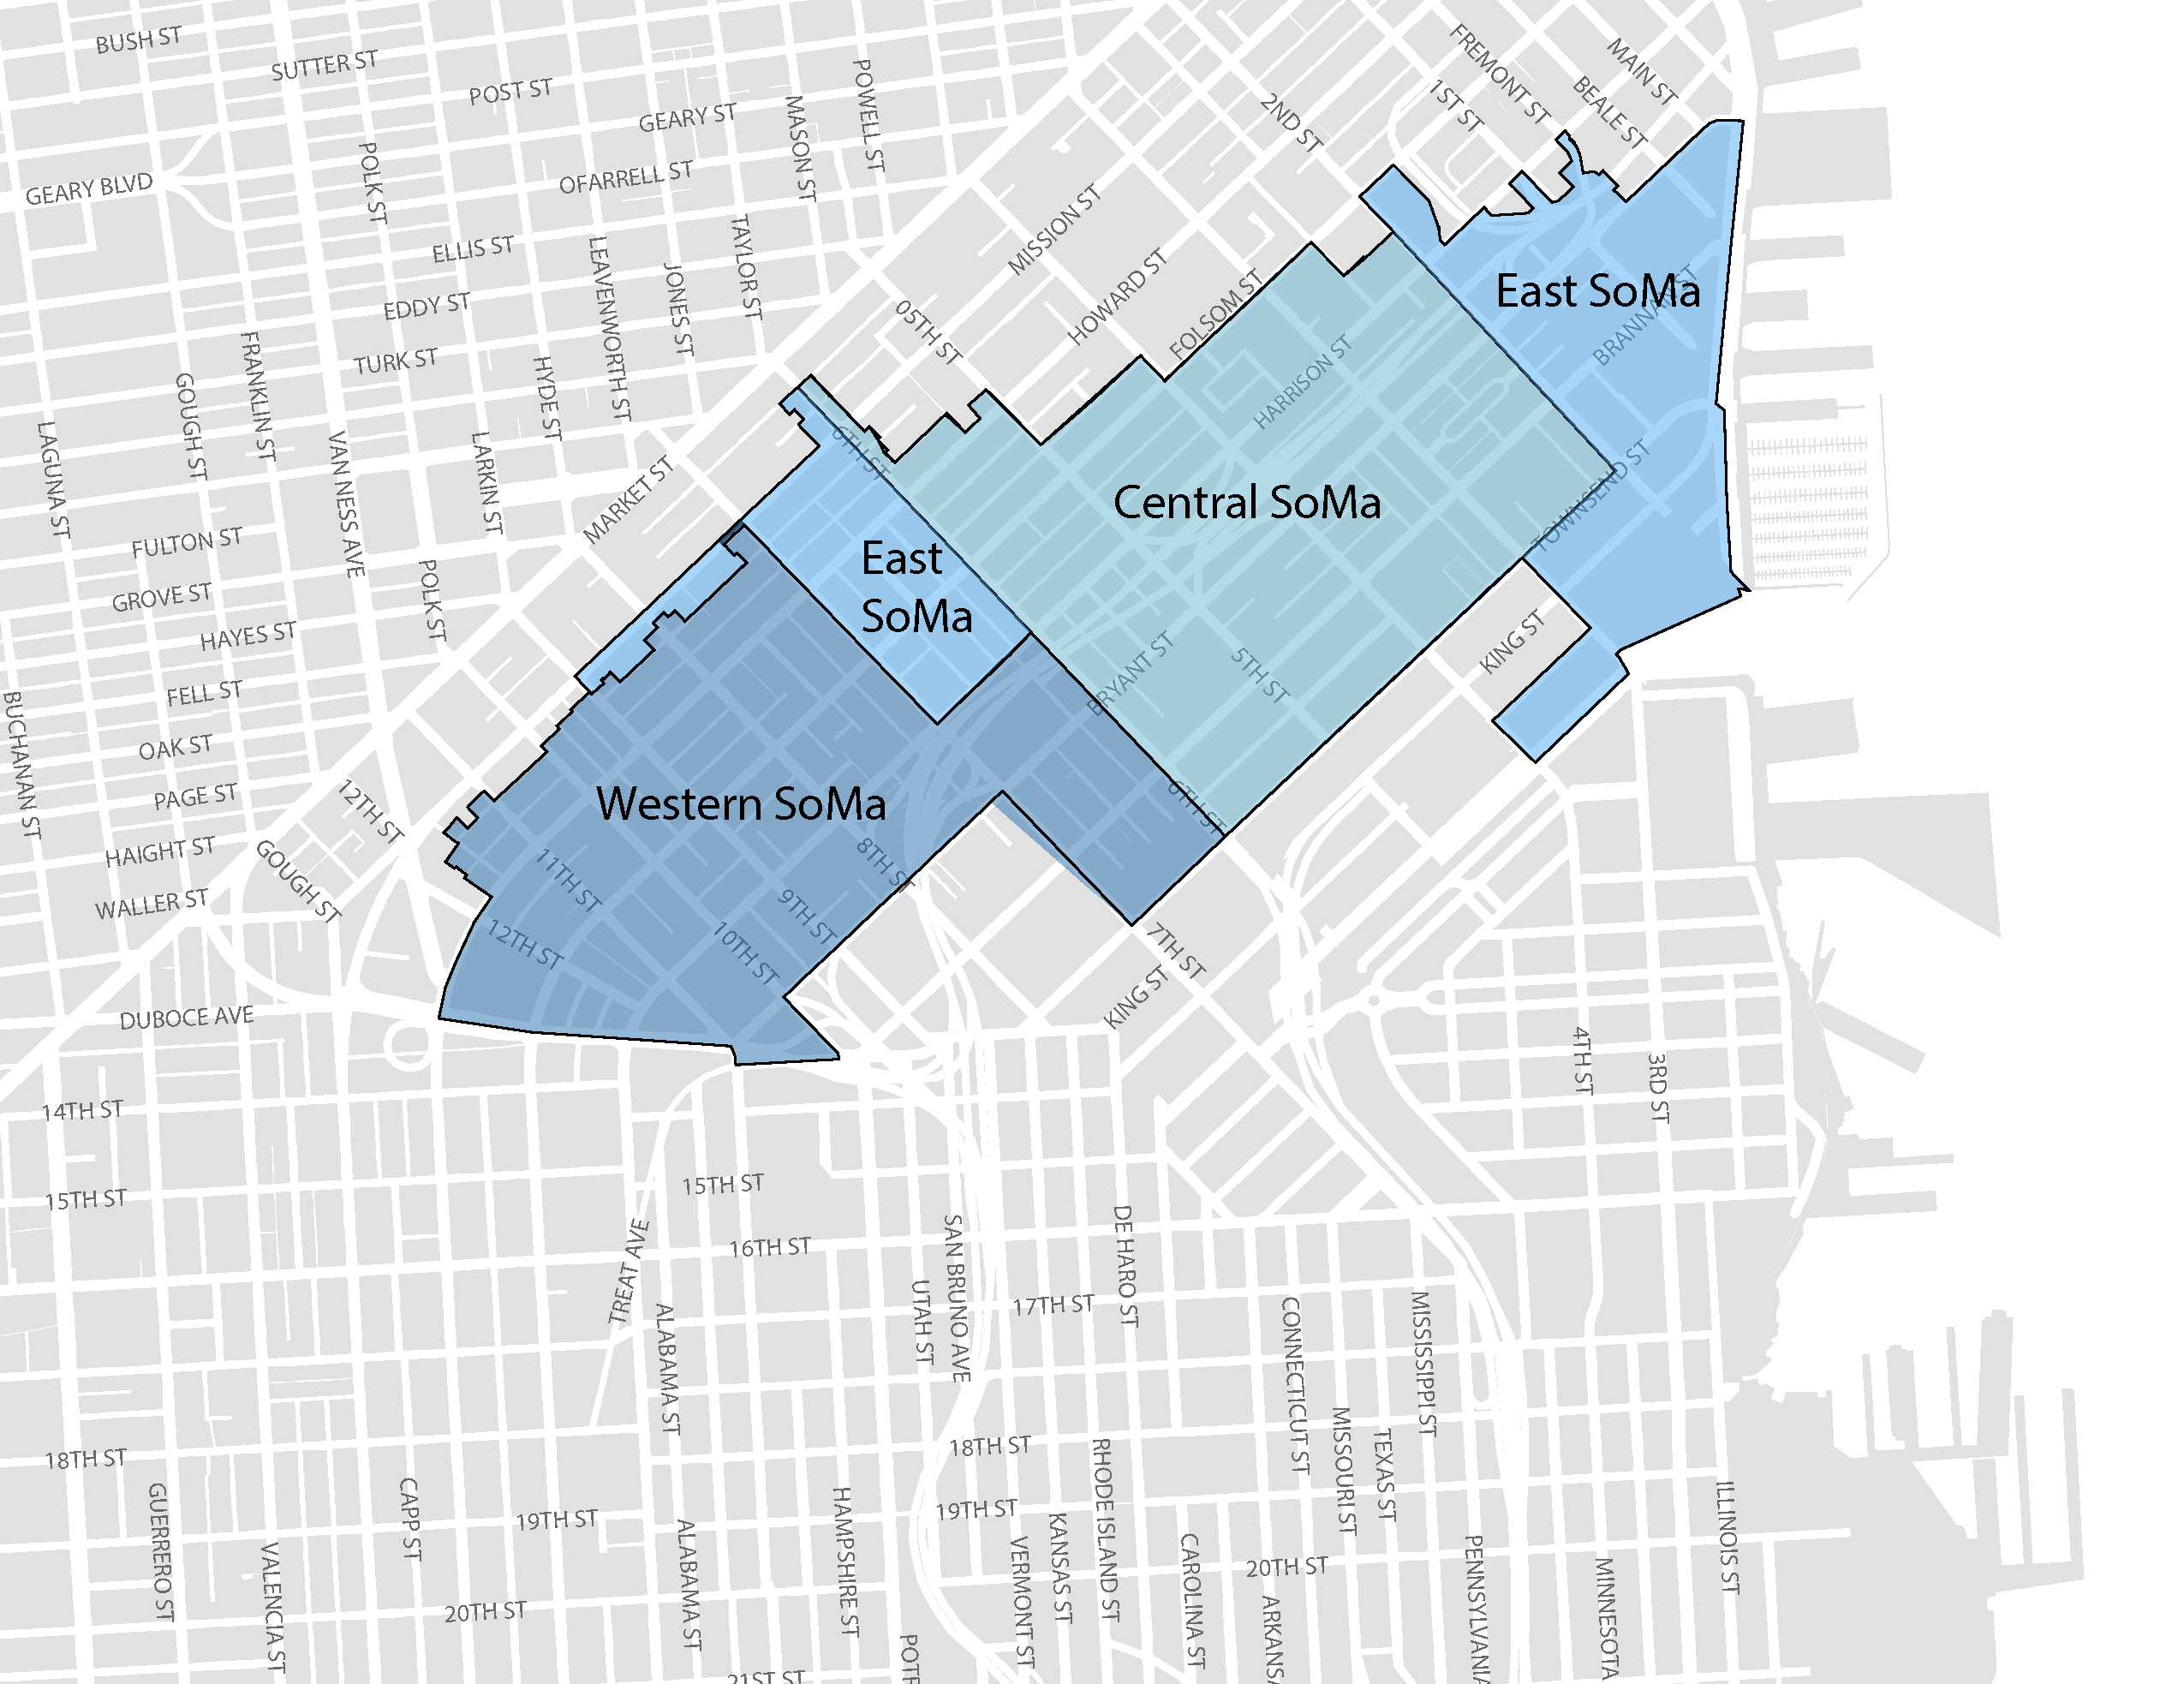
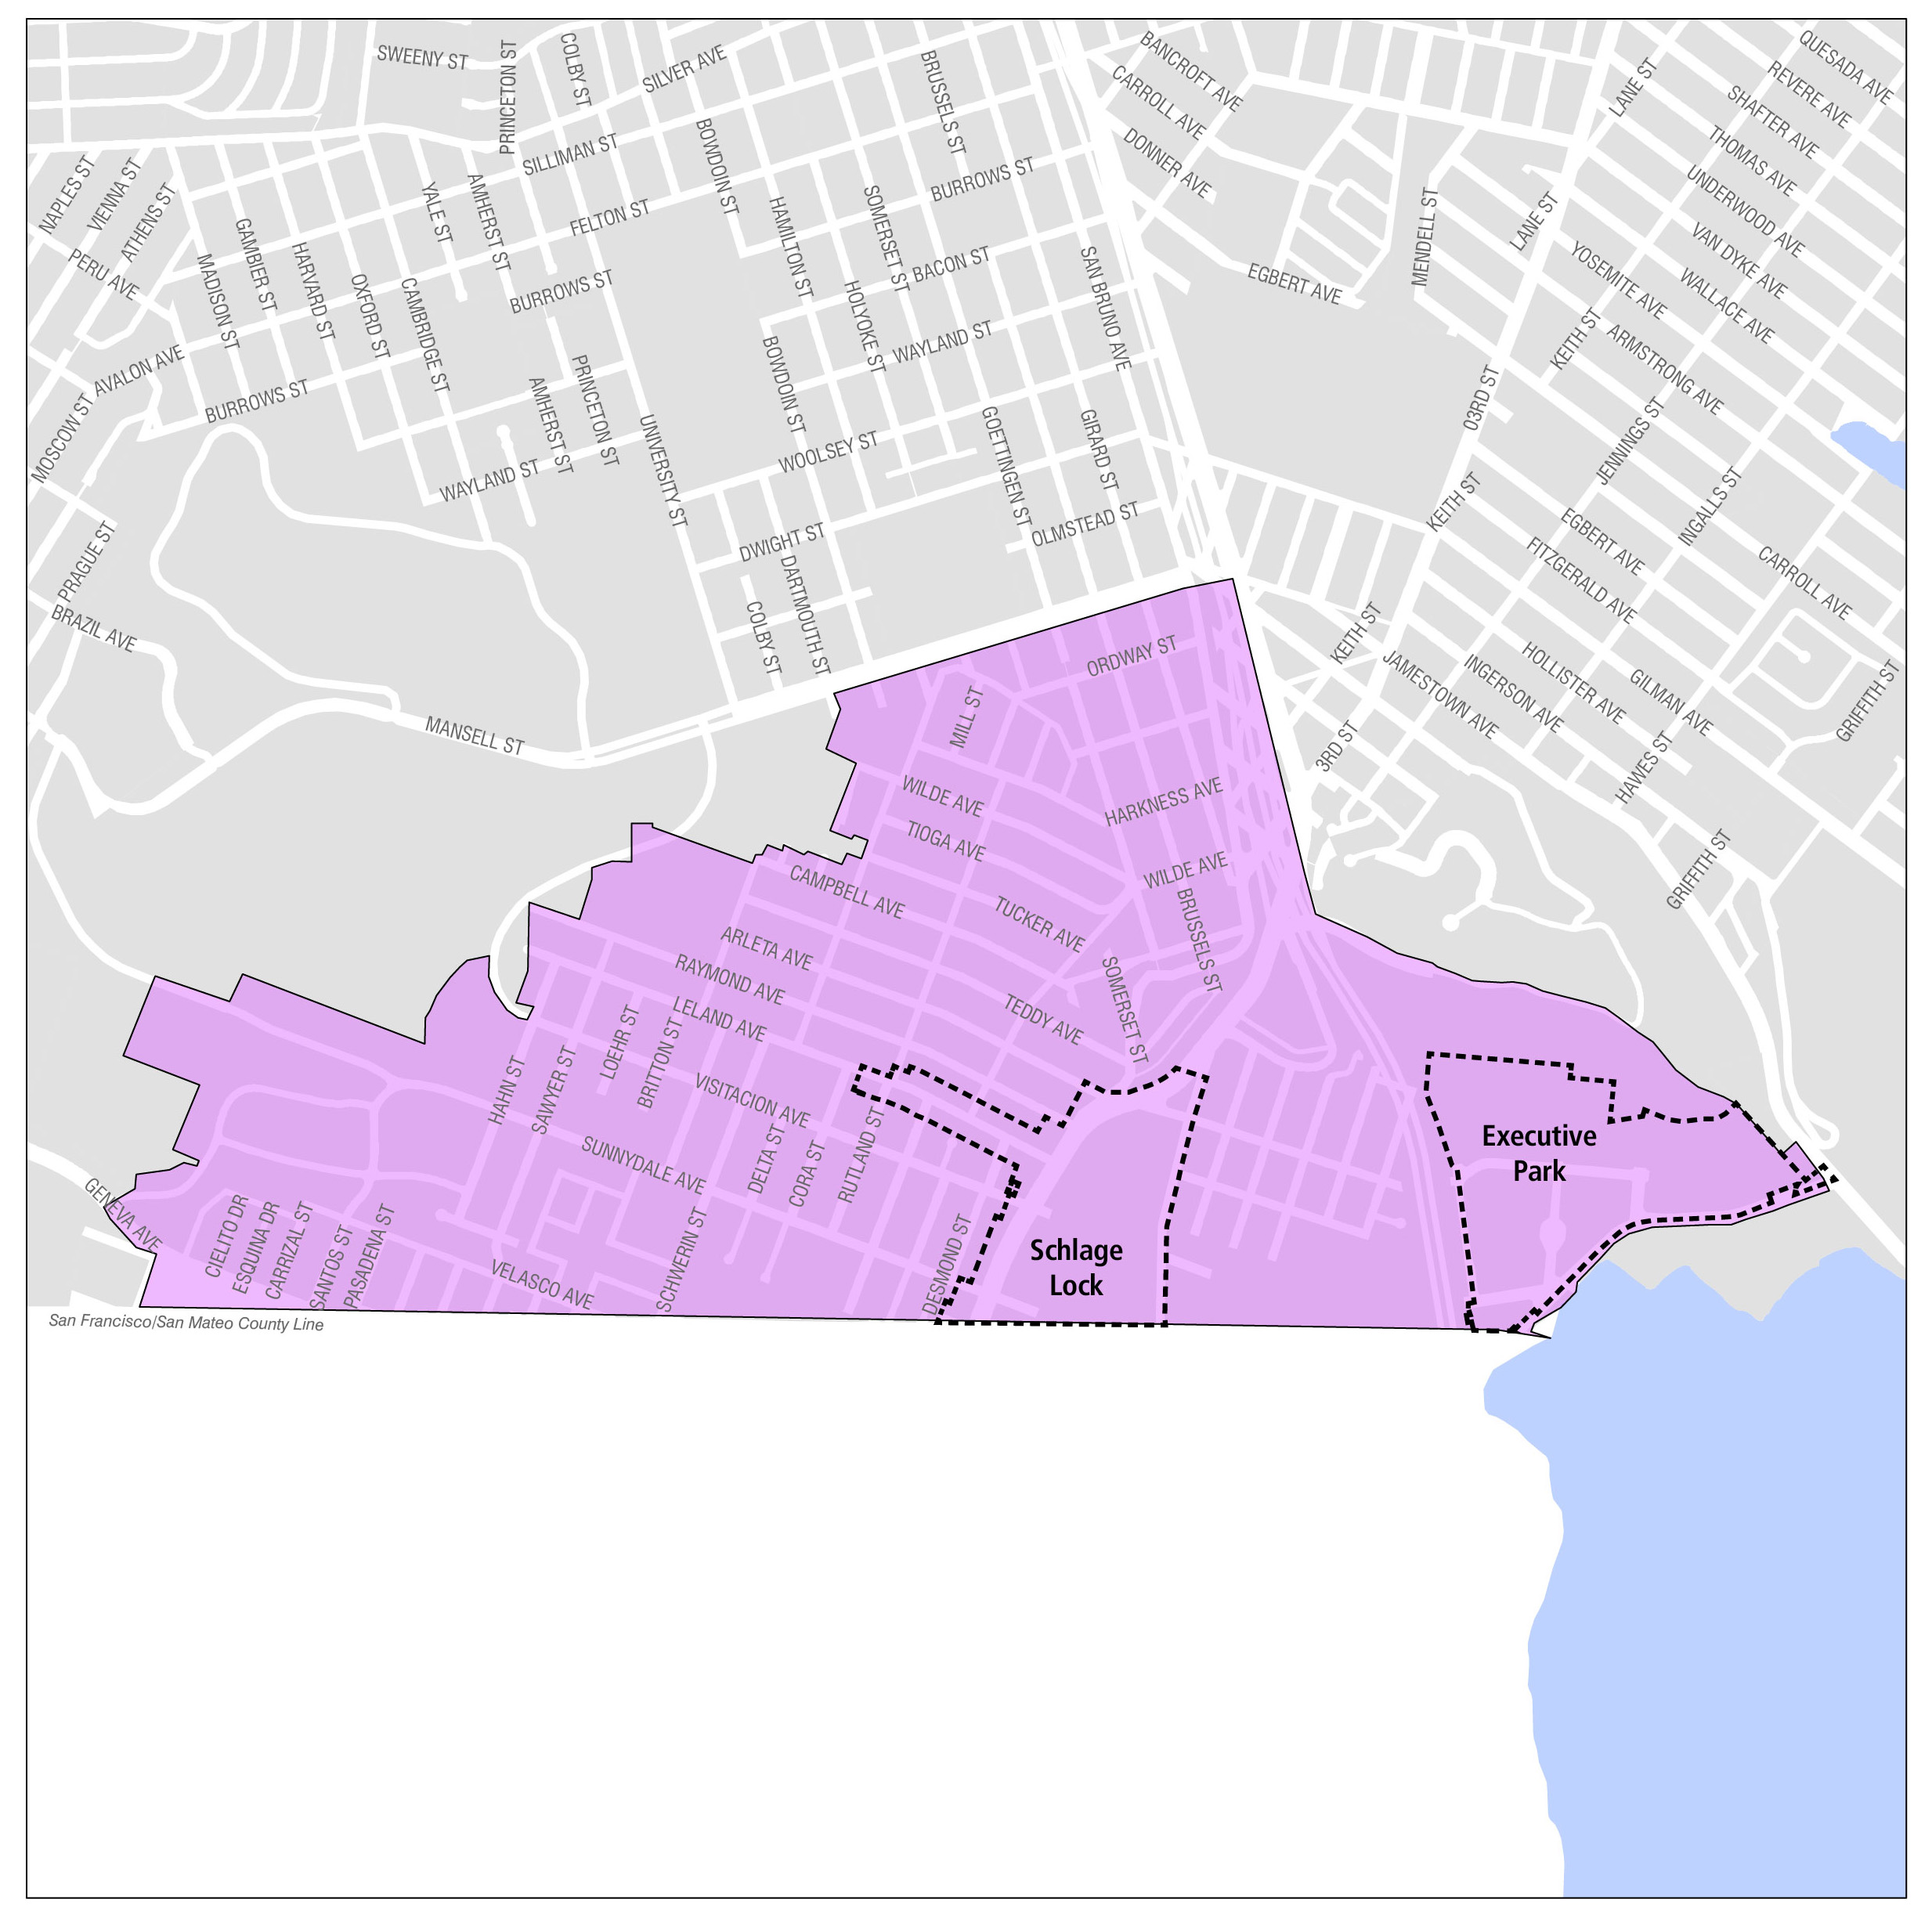
San Francisco has adopted numerous special financing districts in order to finance infrastructure improvements benefiting the public in newly developing areas of the City, such as Transbay and Mission Rock. Projects that may be financed by revenues from special finance districts include, but are not limited to streets, water and sewer systems, libraries, parks, and public safety facilities.
Authorized under the City’s Special Tax Financing Law, Community Facilities Districts (CFD) (also known as Mello-Roos Districts) assess a special tax lien against taxable property within a district to fund capital projects and/or ongoing operations and maintenance costs. These districts are typically established either by a two-thirds vote of property owners or registered voters within the district and by approval of the Board of Supervisors.

Infrastructure Finance Districts (IFD), which are authorized under the California State Government Code, allow municipalities to fund improvements within the IFD geographic boundary. IFDs capture increases in property tax revenue stemming from growth in assessed value as a result of new development and uses that revenue to finance infrastructure projects
and improvements.

Each district has as a unique implementing agency (or agencies) responsible for the formation process and plan of finance for the use of the special taxes and/or tax increment. Table 5.5 provides an overview of many of the planned and existing Special Finance Districts in San Francisco.

Table 5.5

Planned and Existing Special Finance Districts

(Dollars in Millions)

District Name 

Implementing Agency Type of District

Amount 

Transbay

TJPA/City CFD

 Existing

Treasure Island

TIDA CFD & IFD Existing

Central SOMA

SF Planning CFD

In Progress

 The Hub

SF Planning TBD

Planned

 Pier 70

Port CFD & IFD

In Progress

Mission Rock

Port CFD & IFD

In Progress

India Basin

Port CFD

Planned

Hunters Point

OCII CFD

Existing

 Mission Bay

OCII CFD

Existing


Capital Sources: Other Sources

Other Sources

The City has several sources of funding for capital projects that are derived from specific sources and designated for specific purposes. For example, the Marina Yacht Harbor Fund receives revenues generated by users of the Yacht Harbor and uses them for projects such as sediment remediation and security and lighting systems. The Open Space Fund sets aside funds from annual property tax revenues, outside private sources, and Recreation and Parks Department revenues, and applies those funds to open space expenditures. In the first year of the Capital Plan, these funds will provide $33.2 million for these projects, as shown in Table 5.5.

Table 5.5

Other Local Sources Budgeted in FY2018 

(Dollars in Millions)

Fund Title 

Amount 

Library Preservation Fund 

5.0 

Open Space Fund 

5.6 

Special Gas Tax Street Improvement Fund 

3.9 

Marina Yacht Harbor Fund 

3.1 

Convention & Facilities Fund 

3.0 

Gift Fund 

2.8 

San Francisco General Hospital 

2.6 

Road Fund 

2.2 

Other Special Revenue Fund 

1.7 

Laguna Honda Hospital 

1.7 

War Memorial Projects 

1.3 

Golf Fund 

0.3 

Total 

33.2


San Francisco also receives funding from the federal government and the State of California to execute some of our capital projects. Major funders include the Federal Aviation Administration, the Federal Transportation Administration, and the California Department of Transportation, to name a few. At present the City does not track which grants support capital projects, so no summary data on that subject is available. These sources have provided funding for important work including seismic retrofits and improvements to parks, first responder facilities, and libraries. 

2022 - Capital Sources: Development Impact Fees

05. Capital Sources

Development Impact Fees

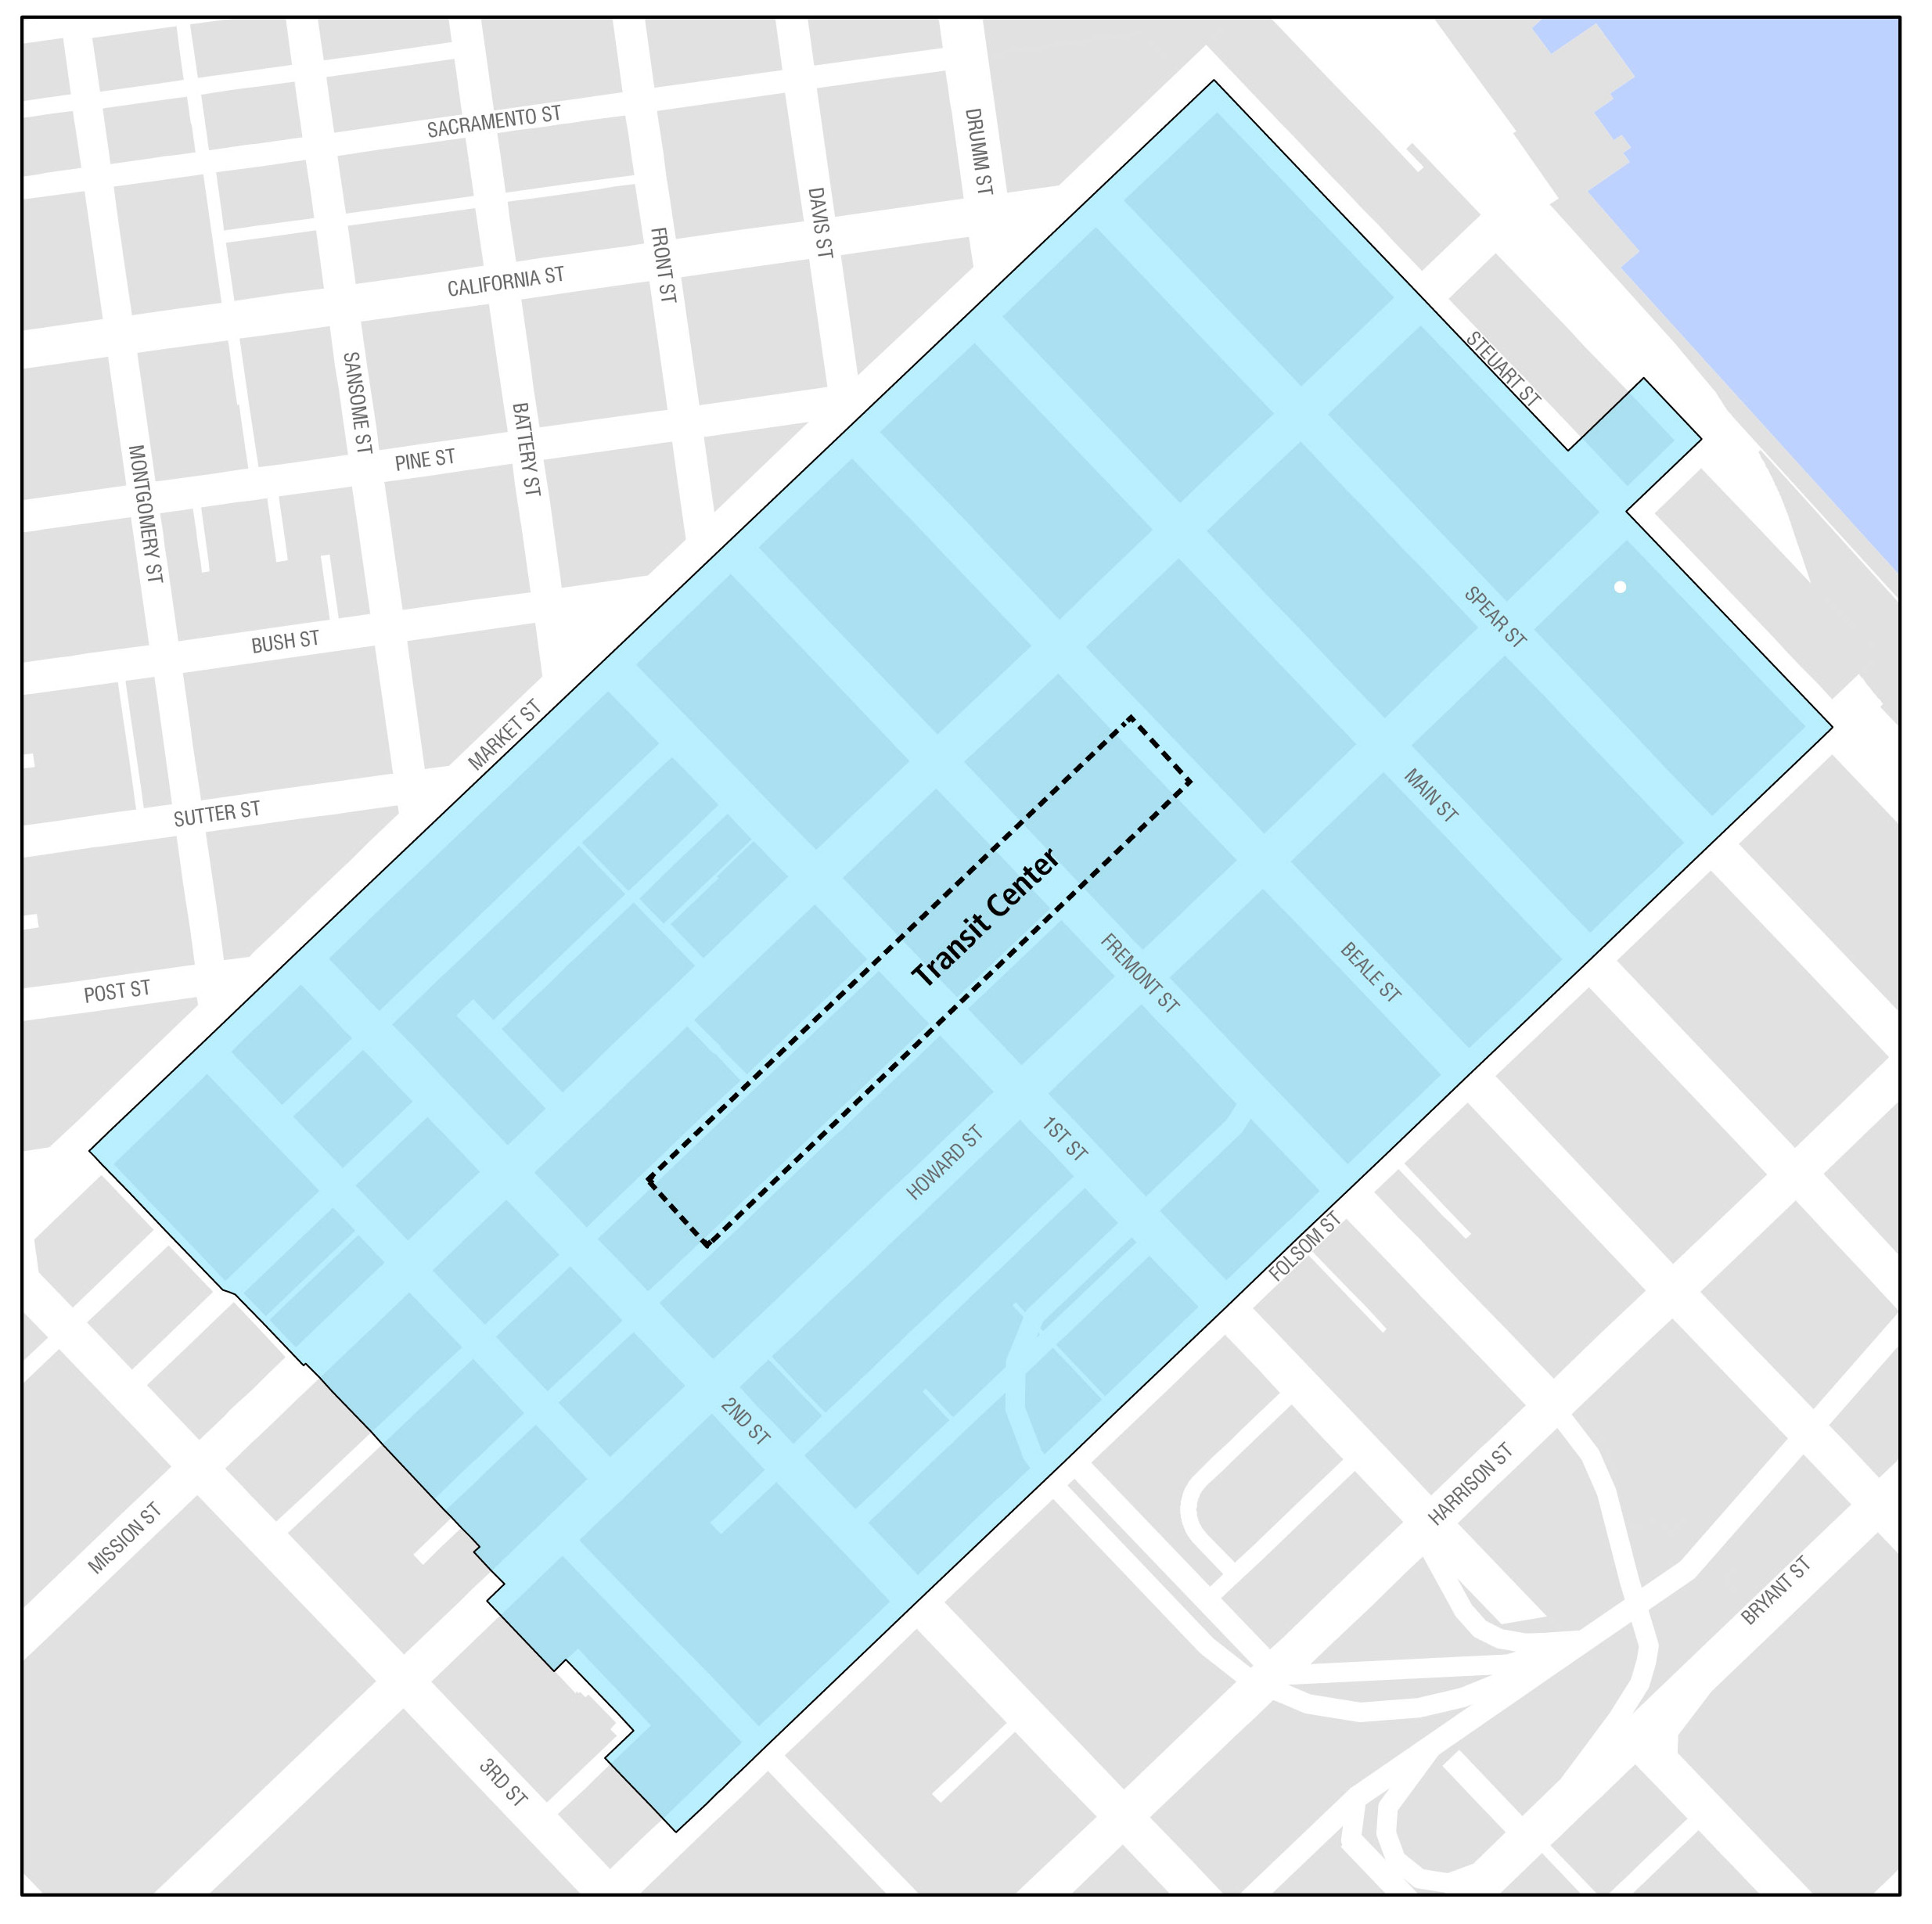
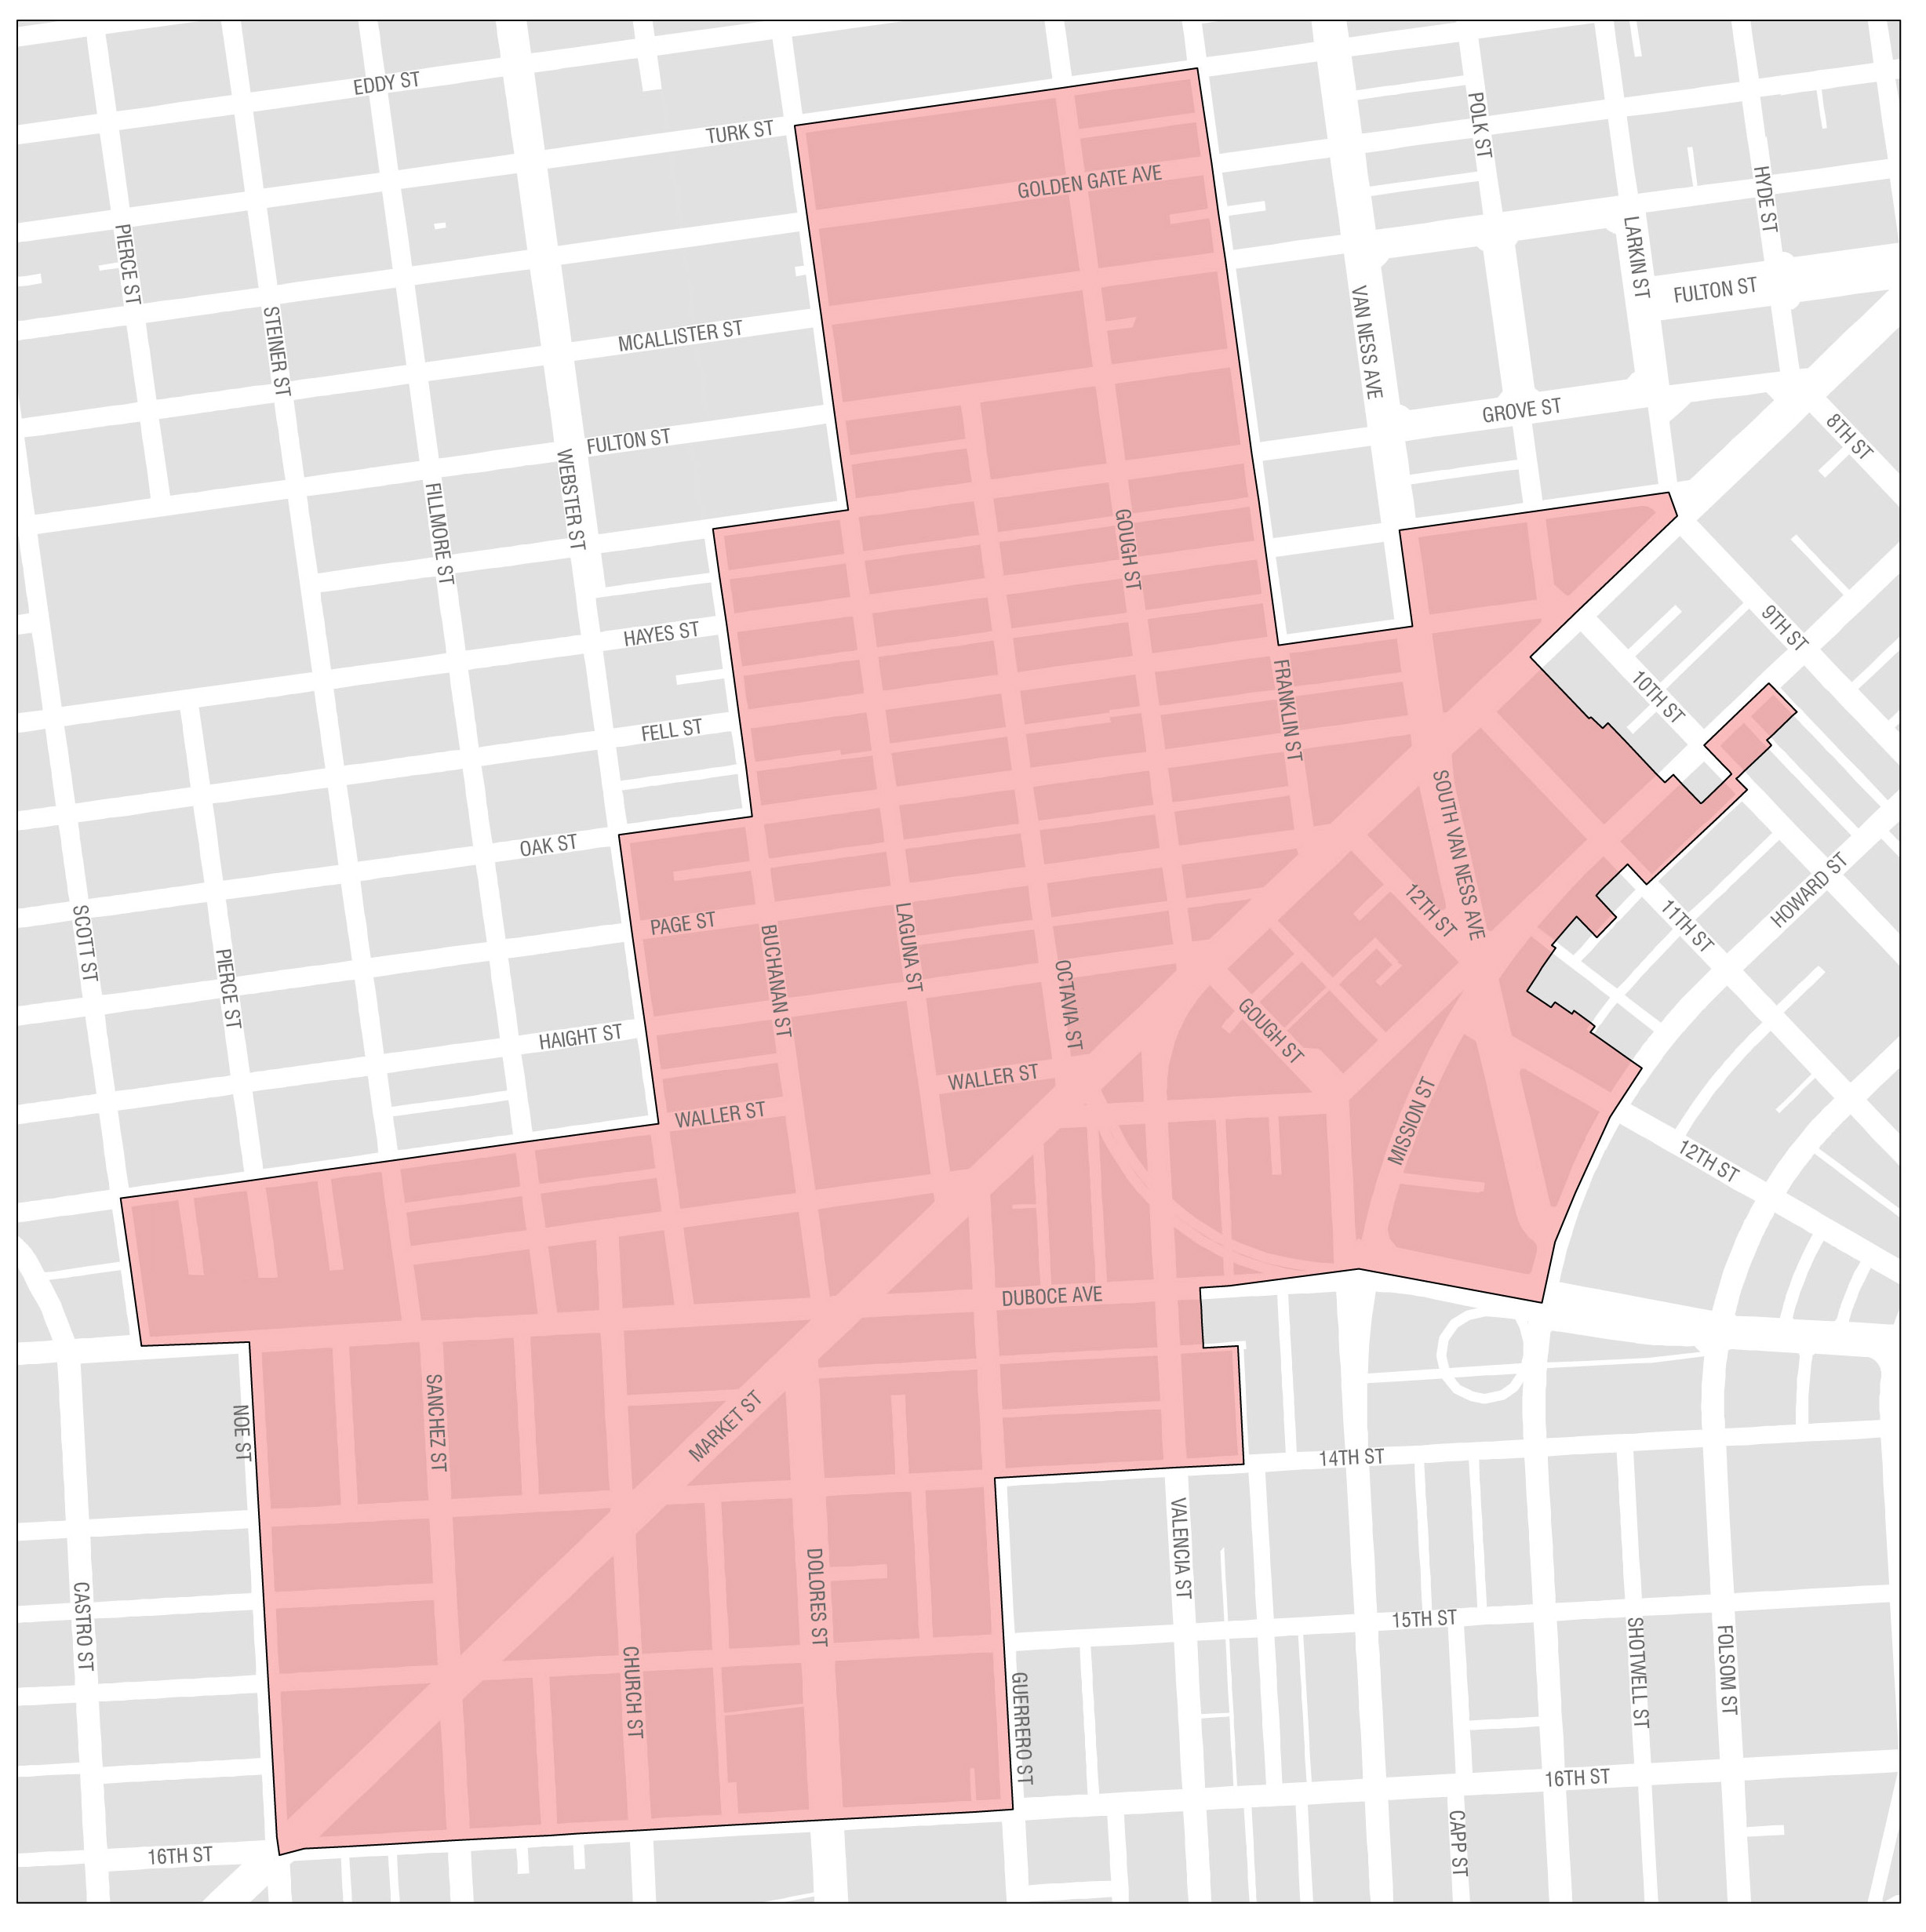
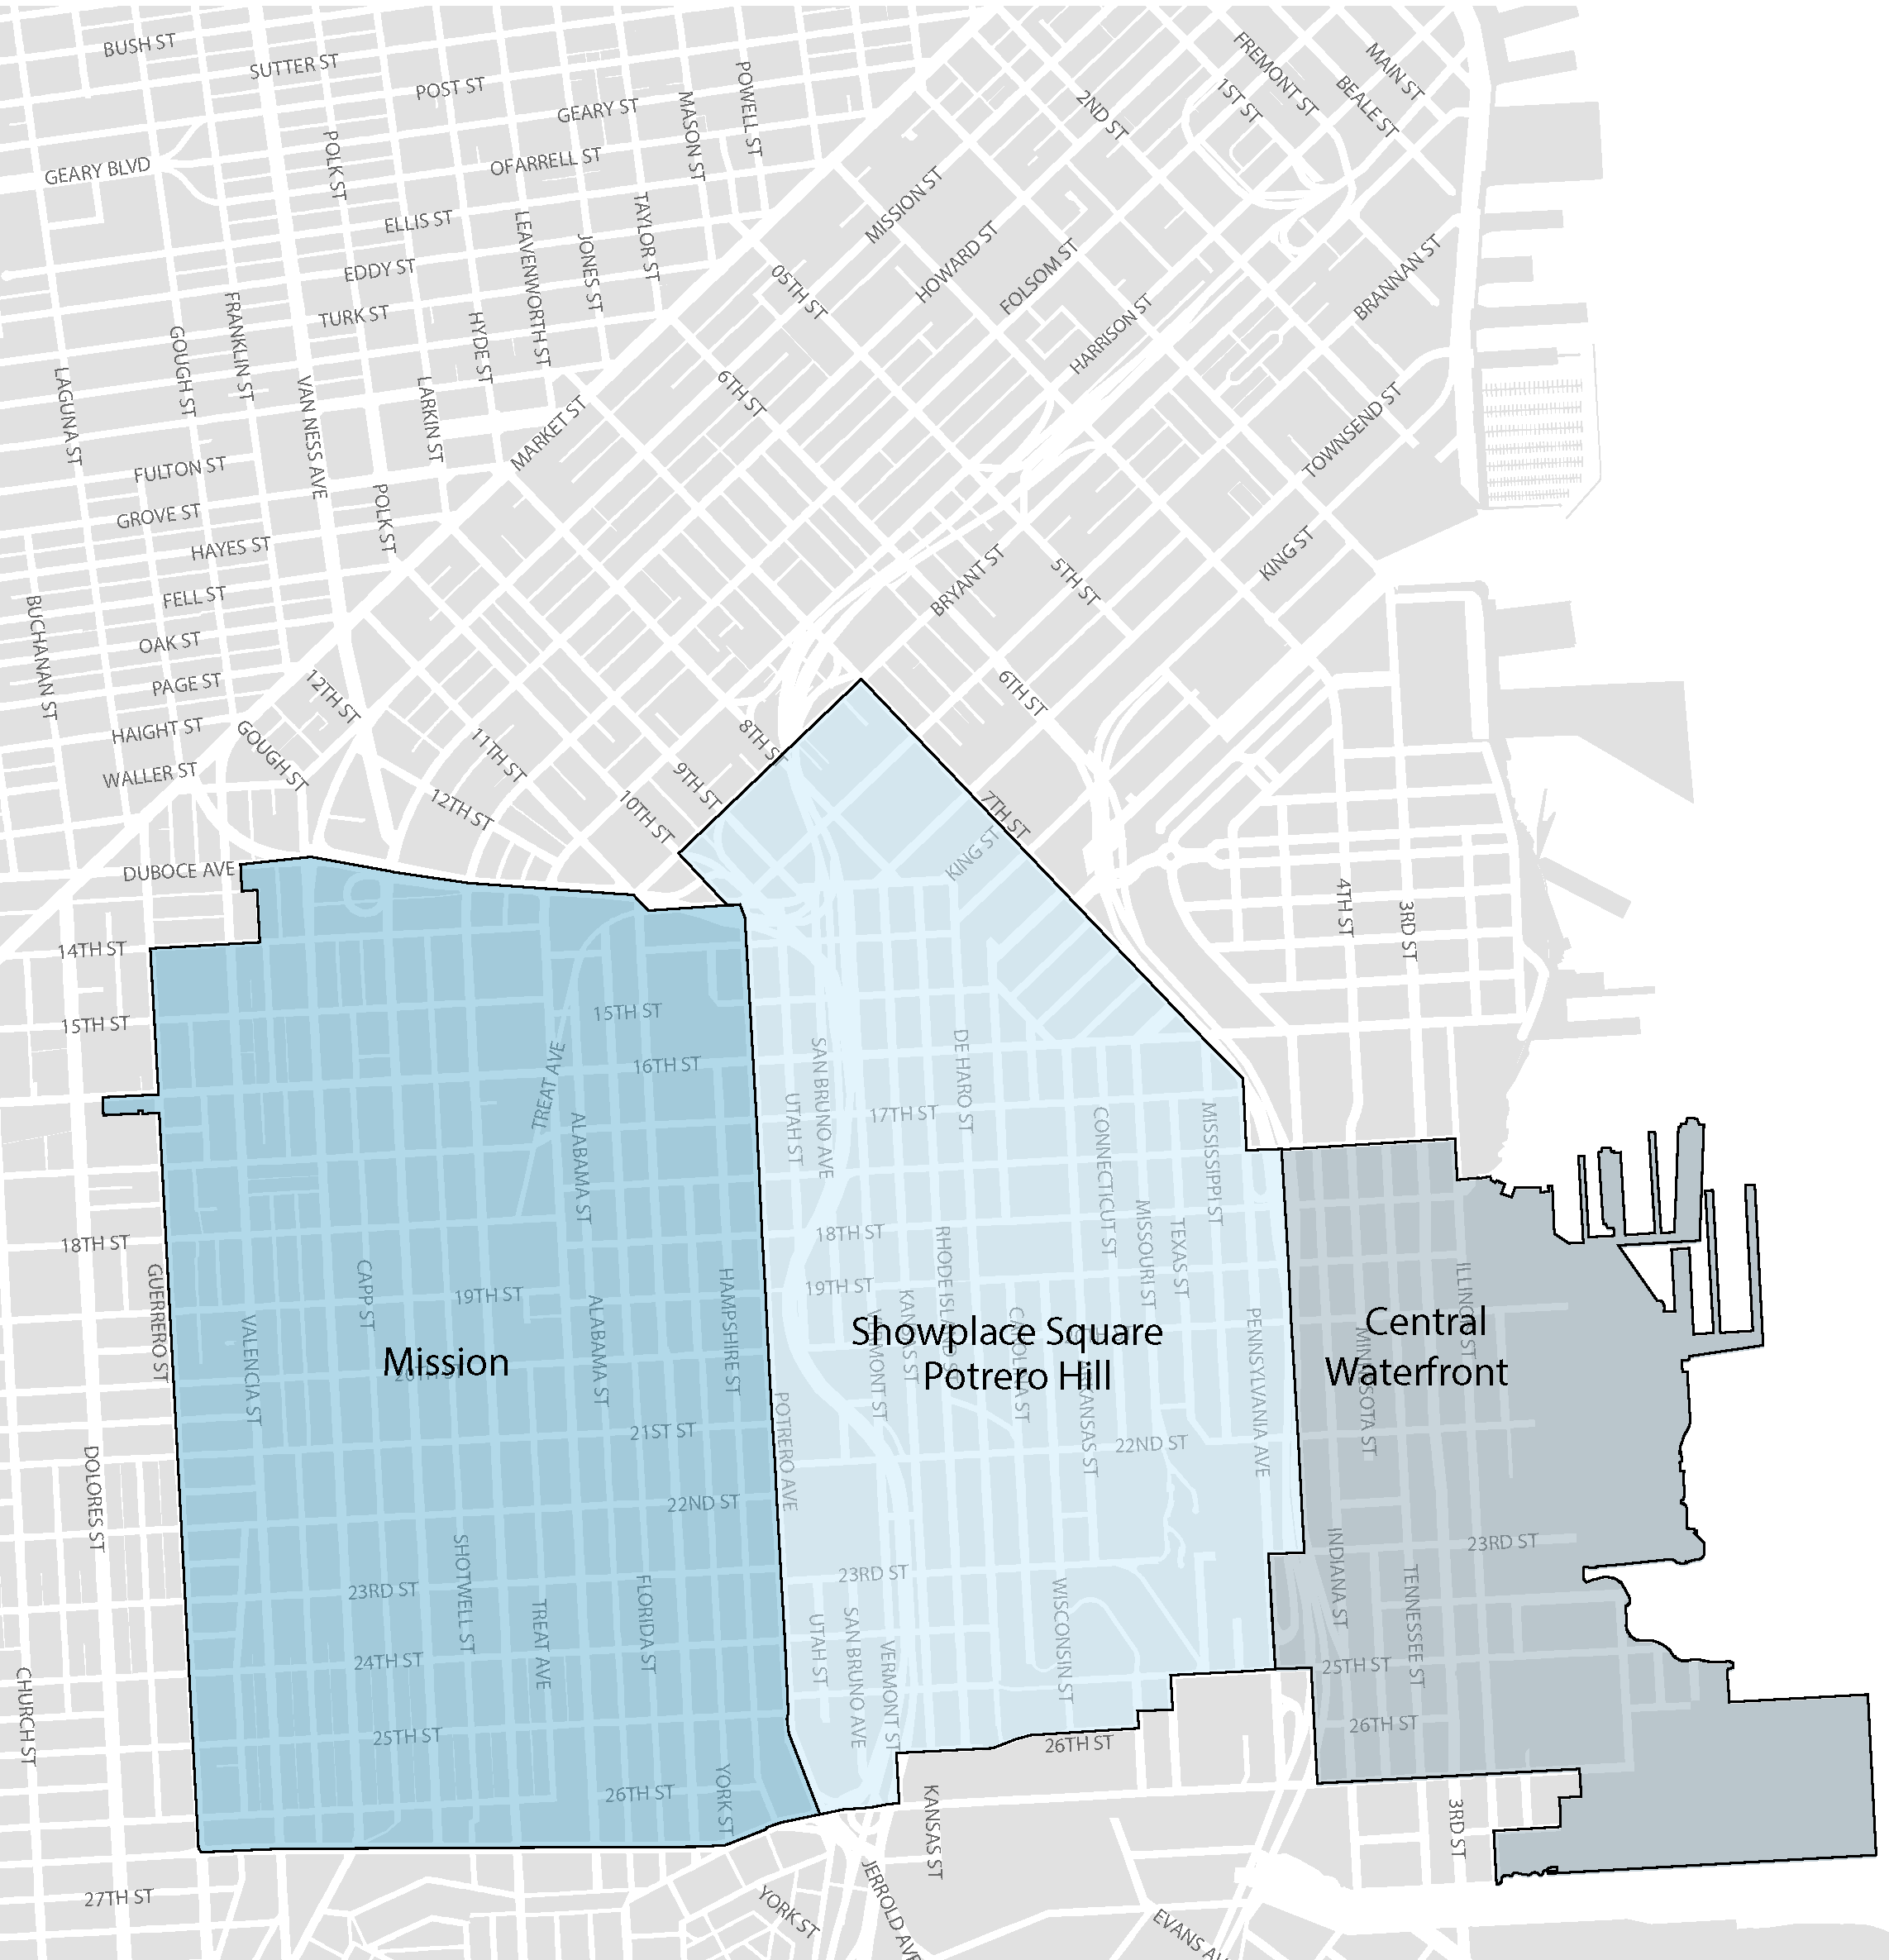
San Francisco must expand its infrastructure to manage the impacts of a growing population as more residents utilize transportation networks, streets, parks, utilities, and other public assets. A large proportion of this new growth is concentrated in a few specific areas, which include Eastern Neighborhoods, Market & Octavia, Visitacion Valley, Balboa Park, Rincon Hill, Transit Center, and most recently approved, Central SoMa. The City established development impact fees, which are paid by developers, to fund the services that are required by new residents of these areas. The City’s Planning Department has created specific Area Plans to focus new capital investments in those neighborhoods.

Development impact fees for the Plan Areas are programmed by the City’s Interagency Plan Implementation Committee (IPIC), which is chaired by the Planning Department. Each year, IPIC develops an expenditure plan for projects to be funded by impact fees with input from each Plan Area’s respective Citizen Advisory Committee. Funding for the expenditure plan is appropriated through the capital budget process each year. While impact fees are collected by the Planning Department, funds are transferred to the departments implementing those projects, such as Public Works, Recreation and Parks, or SFMTA.

The City estimates it will raise approximately $558.2 million in Plan Area impact fees over the next 10 years. Table 5.4 shows that estimate by program area. Not adopted at the time of publication but raised in the Economic Recovery Task Force was the possibility of reviving the impact fee deferral program, which San Francisco offered during the last recession.

Table 5.4

Ten-Year Area Plan Development Impact Fee Projections 
(Dollars in Millions)   
Program Area Impact Fees  FY2022-2031
Complete Streets 224
Open Space 142
Transit 137
Childcare 31
Program Administration 25
Total 558


Whenever they are received, the revenues projected from fees, though significant, are insufficient to cover all of the growth-related needs of the Plan Areas. The City will continue to seek opportunities to leverage these impact fees and identify complementary funding.

There are also impact development fees that apply to building projects citywide. Of these, the most relevant for capital is the Transportation Sustainability Fee (TSF), which replaced the Transit Impact Development Fee (TIDF) in 2015. The TSF Expenditure Program agreed to at that time assigned 63% of TSF revenue to transit capital maintenance, 30% to Muni transit service improvements, 3% to complete streets (bicycle and pedestrian infrastructure in this context), 2% to regional transit improvements, and 2% to program administration. The Planning Department prepares annual TSF revenue projections, and the Mayor's Office determines the budget and projects to be funded to regional transit providers, including BART. Approximately $380 million is projected in TSF revenue from FY2022-30, plus about $20 million more in that timeframe from grandfathered TIDF projects.

New Capital Sources: Development Impact Fees

Development Impact Fees

San Francisco must expand its infrastructure to manage the impacts of our growing population as more residents utilize transportation networks, parks, and other public assets. A large proportion of this new growth is concentrated in a few specific areas, which include Eastern Neighborhoods, Market & Octavia, Visitacion Valley, Balboa Park, Rincon Hill, and Transit Center. The City established development impact fees, which are
paid by developers, to fund the services that are required by new residents of these areas. The City’s Planning Department has created specific Area Plans to focus new capital investments in those neighborhoods.

Development impact fees for the Plan Areas are programmed by the City’s Interagency Plan Implementation Committee (IPIC), which is chaired by the Planning Department. Each year, IPIC develops an expenditure plan for projects to be funded by impact fees with input from each Plan Area’s respective Citizen Advisory Committee. Funding for the expenditure plan is appropriated through the capital budget process each year. While impact fees are collected by the Planning Department, funds are transferred to the departments implementing those projects, such as Public Works, Recreation and Parks, or SFMTA.

The City estimates it will raise approximately $255 million in Plan Area impact fees over the next 10 years. Table 5.4 shows that estimate by program area, not including the recently approved Central SoMa Area Plan. The revenues projected from fees are significant, but they are insufficient to cover all of the growth-related needs of the Plan Areas. The City will continue to seek opportunities to leverage these impact fees and identify complementary funding.

Table 5.4

Ten-Year Area Plan Development Impact Fee Projections

(Dollars in Millions)

Program Area Impact Fees FY2020-29

Complete Streets 

113

Open Space 

77

Transit

38

Childcare 

17

 Program Administration 

 10

Total 

255


There are also impact development fees that apply to building projects citywide. Of these, the most relevant for capital is the Transportation Sustainability Fee (TSF), which replaced the Transit Impact Development Fee (TIDF) in 2015. The TSF Expenditure Program agreed to at that time assigned 63% of TSF revenue to transit capital maintenance, 30% to Muni transit service improvements, 3% to complete streets (bicycle and pedestrian infrastructure in this context), 2% to regional transit improvements, and 2% to program administration. The Planning Department prepares annual TSF revenue projections, and the Mayor's Office determines the budget and projects to be funded to regional transit providers, including BART. Approximately $132 million is projected in TSF revenue from FY2020-25, plus about $62 million more in that timeframe from grandfathered TIDF projects.

Capital Sources: Development Impact Fees

Development Impact Fees

San Francisco must expand our infrastructure to manage the impacts of our growing population as more residents utilize transportation networks, parks, and other public assets. A large proportion of this new growth is concentrated in a few specific areas, which include Eastern Neighborhoods, Market/Octavia, Visitacion Valley, Balboa Park, Rincon Hill, and Transit Center. The City established development impact fees, which are paid by developers, to fund the services that are required by new residents of these areas. The City’s Planning Department has created specific Area Plans to focus new capital investments in those neighborhoods. 

Development impact fees for the Plan Areas are programmed through the City’s Interagency Plan Implementation Committee (IPIC) with input from each Plan Area’s respective Citizen Advisory Committee. IPIC is chaired by the Planning Department, and all IPIC projects’ appropriations are funneled through the capital budget process each year. While impact fees are collected by the Planning Department, funds are transferred to the departments implementing those projects, such as Public Works or SFMTA. 

The City estimates it will raise over $219 million in Plan Area impact fees over the next ten years. Table 5.4 shows the estimate of impact fees to be collected over the next 10 years by Plan Area.

Table 5.4

Ten-Year Plan Area Development Impact Fee Projections 

(Dollars in Millions)

Complete Streets 

68.2 

Recreation and Open Space 

67.5 

Transportation 

43.0 

Housing 

17.3 

Child Care 

14.2 

Administration 

9.7 

Total 

219.9 


While the revenues projected from development impact fees are significant, they are insufficient to cover all of the growth-related infrastructure needs of the Plan Areas. The City will continue to seek opportunities to leverage these impact fees and identify complementary funding for Plan Area projects.

2022 Capital Sources: Debt Programs

05. Capital Sources

Debt Programs

Many of San Francisco's capital improvements are funded with voter-approved General Obligation Bonds (G.O. Bonds), General Fund debt called Certificates of Participation (COPs), or revenue bonds.

Issuing debt is a typical method for financing capital enhancements with long useful lives and high upfront costs, which the City would not be able to cover through the Pay-Go Program. The use of debt also spreads the financial burden of paying for facilities between current residents and future generations who will also benefit from the projects. In the context of the COVID-19 pandemic, it is important to acknowledge the meaningful role that debt can play in San Francisco’s economic recovery, as documented in the Economic Recovery Task Force Report (see summary in Building our Future chapter). More so than in past Capital Plans, the debt programs are programmed with an eye towards local economic stimulus and building a more resilient, equitable San Francisco as part of the City’s recovery from the pandemic.

Health and Recovery Bond 2020

In November 2020, voters approved the Health and Recovery Bond, a multi-service area bond that will address some of San Francisco’s most urgent needs: addressing the twin challenges of mental health and homelessness; and investing in large, shovel-ready parks and street infrastructure projects that will serve as an engine for growth and create local jobs that will help jumpstart San Francisco’s economy. This $487.5 million bond provides $207 million  to invest in permanent supportive housing, shelters and facilities that deliver services to people struggling with mental health and substance use disorders; $239 million for capital needs in the City’s park system, including citywide parks like Golden Gate Park, Lake Merced, and McLaren Park, neighborhood parks like Buchanan Mall, Gene Friend Recreation Center, Herz Playground, and India Basin, community gardens, and trails; $41.5 million to address public right of way and public spaces, including street resurfacing, ADA curb ramp construction and maintenance, and repair and maintenance of street structures like the Third Street Bridge and Filbert Street Steps.

General Obligation Bonds

G.O. Bonds are backed by the City’s property tax revenue and are repaid directly out of property taxes through a fund held by the Treasurer’s Office.

The Plan structures the G.O. Bond schedule around the notion of rotating bond programs across areas of capital need, although the City’s debt capacity, election schedules, and capital needs also inform these levels. This approach was established in the original Capital Plan and has been maintained ever since.

Priority areas of need for capital improvements include Earthquake Safety & Emergency Response, Parks & Open Space, Transportation, Public Health, and the Waterfront. As part of incorporating Affordable Housing into the Capital Plan, there is also the first advance-planned bond in that area. The Plan occasionally recommends bonds outside these categories if there is a demonstrated capital need that the City would otherwise not be able to afford. Table 5.1 lays out the planned G.O. Bond schedule for upcoming elections.

Chart 5.1 illustrates the impact on the local tax rate of issued, expected, and planned G.O. Bond debt. The red line represents the property tax limit policy established in 2006 that sets the annual level of bond debt repayment. The space between the red line and the bars on the chart illustrates the projected capacity for bond debt for each year. All amounts attributed to future bonds are estimates and may need to be adjusted to account for new federal and state laws, programmatic changes, site acquisition, alternate delivery methods, changing rates of construction cost escalation, and/or newly emerged City needs.

The G.O. Bond program’s capacity is largely driven by changes in assessed value and associated property tax revenues within the city. The recent economic boom increased assessed value growth over the past several years, but that growth is expected to slow now due to the COVID-19 crisis. While the passage of recent bonds is a sign of the effectiveness of the capital planning process, it also impacts the available bond capacity going forward. The passage of three large bonds totaling $1.7 billion since 2019 means there is considerably less capacity for this 10-year capital planning cycle compared to previous ones. For more information on the G.O. Bond policies and past bonds, please see the Introduction chapter.

In addition to this program, external agencies may also issue G.O. Bonds. For example, City College passed a $845 million bond in FY2020, and SFUSD has plans for a $1 billion bond on the November 2022 ballot.

Table 5.1

G.O. Bond Program    
(Dollars in Millions)    
Election Date Bond Program Amount
Jun-22 Transportation 400
Nov-23 Public Health 187
Nov-24 Affordable Housing 160
Nov-26 Waterfront Safety 130
Nov-27 Earthquake Safety & Emergency Response 217
Nov-28 Parks and Open Space 151
Nov-31 Public Health TBD
Total   1,245


Chart 5.1

GO Bond Chart


Certificates of Participation

Certificates of Participation (COPs) are backed by a physical asset in the City’s capital portfolio and supported through annual General Fund appropriations or revenue that would otherwise flow to the General Fund. The City utilizes COPs to leverage the General Fund to finance capital projects and acquisitions. Funding from COPs is planned to support basic City responsibilities such as relocating City staff from seismically deficient buildings.

Table 5.2 shows the Capital Plan’s COP Program for the next ten years. This Program includes two years of issuances for critical repairs totaling $111 million, as well as two years of issuances for street resurfacing totaling $60 million. Together, these four issuances help mitigate cuts to the Pay-Go Program due to the recession. In addition, this program also includes two years of issuances for recovery stimulus totaling $125 million. These issuances will support projects that serve as local economic stimulus and help build a more resilient and equitable San Francisco as part of the city’s recovery from the COVID-19 pandemic. Chart 5.2 shows the planned COP Program against the policy constraint for General Fund debt not to exceed 3.25% of General Fund Discretionary Revenue, represented by the red horizontal line. The black line depicts the annual lease costs related to the Hall of Justice Administrative Exit efforts approved in 2018, which are also counted against this Program’s constraint.

The bottom portions of the columns represent debt service commitments for previously issued and authorized but unissued COPs, including the debt issued for the Moscone Center, the War Memorial Veterans Building, and the Animal Care & Control Shelter replacement. New obligations are represented in discrete colors, beginning in FY2022. As with the G.O. Bond Program, all amounts attributed to future COP-funded programs are estimates and may need to be adjusted in future plans to account for new federal and state laws, programmatic changes, site acquisition, alternate delivery methods, changing rates of construction cost escalation, and/or newly emerged
City needs.

Table 5.2

COP Program  
(Dollars in Millions)  
Fiscal Year of Issuance Project Amount
FY2022 Critical Repairs 61
FY2022 Recovery Stimulus 50
FY2023 Relocation of HSA Headquarters 70
FY2023 Critical Repairs 50
FY2023 Recovery Stimulus 75
FY2023 Street Resurfacing 30
FY2024 Street Resurfacing 30
FY2025 HOJ Consolidation Project 367
FY2031 Public Works Yard Consolidation 32
Total    765 


Chart 5.2

GO Bond Chart


Revenue Bonds

Revenue bonds are a type of debt that is repaid from department or other revenue streams. Revenue bonds are typically used by the City’s enterprise departments (SFMTA, Port, SFPUC, and SFO), which generate their own revenues from fees paid by users of services provided by those agencies. This type of debt is repaid solely by users of those projects and therefore does not require payments from the General Fund. Examples of projects funded by revenue bonds are the SFPUC’s Water Systems Improvement Program and the Airport’s Terminal Renovation Program.

Table 5.3 shows the currently planned amount of revenue bonds to be issued over the 10-year term of this Plan.
All revenue bond issuances are subject to change based on market conditions and cash flow needs of the associated projects.

Table 5.3

Planned Revenue Bond Issuances FY2022-31
(Dollars in Millions)    
Agency FY22-26 FY27-31 Total
SFPUC 4,549  2,236  6,785 
Airport 1,189  1,189 
Total 5,738  2,236  7,974 


New Capital Sources: Debt Programs

Debt Programs
Howard Street Improvements

Many of San Francisco's capital improvements are funded with voter-approved General Obligation Bonds (G.O. Bonds), General Fund debt called Certificates of Participation (COPs), or revenue bonds.

Issuing debt is a typical method for financing capital enhancements with long useful lives and high upfront costs, which the City would not be able to cover through the Pay-Go Program. The use of debt also spreads the financial burden of paying for facilities between current residents and future generations who will also benefit from the projects.

For planning purposes department-level allocations have been assigned in this document for planned G.O. Bond and COP programs. These allocations are subject to change and will be refined prior to approval from the Capital Planning Committee based on information from Citywide needs assessments such as the HAZUS analysis and from evolving
departmental priorities.

General Obligation Bonds

G.O. Bonds are backed by the City’s property tax revenue and are repaid directly out of property taxes through a fund held by the Treasurer’s Office.

The Plan structures the G.O. Bond schedule around the notion of rotating bond programs across areas of capital need, although the City’s debt capacity, election schedules, and capital needs also inform these levels. This approach was established in the original Capital Plan and has been maintained ever since.

Priority areas of need for capital improvements include Earthquake Safety & Emergency Response, Parks & Open Space, Transportation, and Public Health; however, the Plan occasionally recommends bonds outside these categories if there is a demonstrated capital need that the City would otherwise not be able to afford. Table 5.1 lays out the planned G.O. Bond schedule for upcoming elections.

Chart 5.1 illustrates the impact on the local tax rate of issued, expected, and planned G.O. Bond debt. The red line represents the property tax limit policy established in 2006 that sets the annual level of bond debt repayment. The space between the red line and the bars on the chart illustrates the projected capacity for bond debt for each year. This capacity is largely driven by changes in assessed value and associated property tax revenues within the City. The recent economic boom has increased assessed value growth over the past several years, but there is an expectation that this will level off when the economy turns.

Table 5.1

G.O. Bond Program 

(Dollars in Millions)

Election Date 

Bond Program 

Proposed Amount 

November 2019

Affordable Housing

500

March 2020

Earthquake Safety & Emergency Response

628.5

November 2020 

Parks & Open Space 

255

June 2022 

Transportation

500 

November 2023

Public Health

220

November 2026

Waterfront Safety

150

November 2027

Earthquake Safety & Emergency Response

271.5

November 2028 Parks & Open Space 200

Total 


2,725


Chart 5.1

Capital Plan G.O. Bond Program


Certificates of Participation

Certificates of Participation (COPs) are backed by a physical asset in the City’s capital portfolio, and repayments are appropriated each year repaid from the City’s General Fund or revenue that would otherwise flow to the General Fund. The City utilizes COPs to leverage the General Fund to finance capital projects and acquisitions.

Funding from COPs is planned to support critical City responsibilities such as relocating City staff from seismically deficient buildings and modernizing the Public Works Operations Yard.

Table 5.2 shows the Capital Plan’s COP Program for the next ten years. This Program also includes two years of $60 million each for critical repairs in a recession or economic slowdown, which reserves capacity for capital needs in the event of a downturn and associated impact to the Pay-Go Program.

Chart 5.2 shows the planned COP Program against the policy constraint for General Fund debt not to exceed 3.25% of General Fund Discretionary Revenue, represented by the red horizontal line. The black line depicts the annual lease costs related to the Hall of Justice Administrative Exit efforts approved in 2018, which are also counted against this Program’s constraint.

The bottom portions of the columns represent debt service commitments for previously issued and authorized but unissued COPs, including the debt issued for the Moscone Center, the War Memorial Veterans Building, and the Animal Care & Control Shelter replacement. New obligations are represented in discrete colors, beginning in FY2020. As with the G.O. Bond Program, all amounts attributed to future COP-funded programs are estimates and may need to be adjusted in future plans to account for new federal and state laws, programmatic changes, site acquisition, alternate delivery methods, changing rates of construction cost escalation, and/or newly emerged City needs.

Table 5.2

COP Program

(Dollars in Millions)

Fiscal Year of Issuance 

Project 

Amount 

FY2019

Public Health 101 Grove Exit

108

FY2019

HOPE SF Horizontal Infrastructure

57

FY2020

 Family Services Center/City Offices

50

FY2020

 Hall of Justice Relocation Projects

131

FY2022

Critical Repairs Recession Allowance

60

FY2023

Critical Repairs Recession Allowance

60

FY2025

Hall of Justice Demolition & Enclosure

55

FY2026

Public Works Yards Consolidation

25

FY2028 Hall of Justice Consolidation Plan 417

Total 


963 


Chart 5.2


Capital Plan General Fund Debt Program


Revenue Bonds

Revenue bonds are a type of debt that is repaid from revenues generated by projects that the debt was used to finance. Revenue bonds are typically used by the City’s enterprise departments (SFMTA, Port, SFPUC, and SFO), which generate their own revenues from fees paid by users of services provided by those agencies. This type of debt is repaid solely by users of those projects and therefore does not require payments from the General Fund. Examples of projects funded by revenue bonds are the SFPUC’s Water Systems Improvement Program or the Airport’s Terminal Renovation Program.

Table 5.3 shows the currently planned amount of revenue bonds to be issued over the 10-year term of this Plan. All revenue bond issuances are subject to change based on market conditions and cash flow needs of the associated projects.

Table 5.3

Planned Revenue Bond Issuances FY2020-29 

(Dollars in Millions)

Agency 

FY20-24
Amount

FY25-29
Amount

Total 

SFPUC 

3,882.1 

976.2

4,858.3 

Airport 

2,882.9

0.0

2,882.9

SFMTA 

0.1

0.0

0.1 

Total 

6,765.1

976.2 

7,741.3

Capital Sources: Debt Programs

Debt Programs

BART at SFO Station

The majority of the capital investments outlined in the General Fund Summary Table are funded with voter-approved General Obligation Bonds (G.O. Bonds), General Fund debt called Certificates of Participation (COPs), or revenue bonds. 

Issuing debt is a typical method for financing capital enhancements with long useful lives and high upfront costs which the City would not be able to cover through the Pay-Go Program. The use of debt also spreads the financial burden of paying for facilities between current residents and future generations who will also benefit from the projects. 

For planning purposes department-level allocations have been assigned in this document for all planned G.O. Bond and COP programs. These allocations are subject to change and will be refined prior to approval from the Capital Planning Committee based on information from Citywide needs assessments such as the HAZUS analysis described in Chapter Four: Building Our Future, as well as evolving department priorities.

General Obligation Bonds

G.O. Bonds are backed by the City’s property tax revenue and are repaid directly out of property taxes through a fund held by the Treasurer’s Office. 

The Plan structures the G.O. Bond schedule around the notion of rotating bond programs that target specific areas of capital need approximately every six years, although the City’s debt capacity, election schedules, and capital needs also determine these levels. This approach was established in the original 2007 Capital Plan and has been maintained ever since. 

Specific areas of need for capital improvements include Earthquake Safety, Parks & Open Space, and Public Health; however, the Plan occasionally recommends bonds outside these categories if there is a demonstrated capital need that the City would otherwise not be able to afford. Recently approved G.O. Bond measures include the 2015 Affordable Housing Bond and the 2016 Public Health & Safety Bond.

Table 5.1

G.O. Bond Program 

(Dollars in Millions)

Election Date 

Bond Program 

Proposed Amount 

November 2018 

Seawall Fortification 

350 

November 2019 

Parks and Open Space 

185 

November 2020 

Earthquake Safety & Emergency Response 

290 

November 2022 

Public Health 

300 

November 2024 

Transportation 

500 

June 2025 

Parks and Open Space 

185 

November 2026 

Earthquake Safety & Emergency Response 

290 

Total 


2,100

Table 5.1 shows the Capital Plan’s G.O. Bond Program for the next 10 years. The next scheduled bond is a Seawall Bond scheduled for the November 2018 ballot, a new addition to the G.O. Bond Program to meet infrastructure fortification needs for San Francisco’s waterfront. All amounts attributed to future bond programs are estimates and may need to be adjusted in future plans to account for new federal and state laws, programmatic changes, site acquisition, alternate delivery methods, changing rates of construction cost escalation, and/or newly emerged City needs.

Chart 5.1

Capital Plan G.O. Bond Program

Chart 5.1 illustrates the impact on the local tax rate of issued, expected, and planned G.O. Bond debt. The red line represents the property tax limit policy established in 2006 that sets the annual level of bond debt repayment. The space between the red line and the bars on the chart illustrates the projected capacity for bond debt for each year. This capacity is largely driven by changes in assessed value and associated property tax revenues within the City. The recent economic boom has increased assessed value growth over the past several years but there is an expectation that this will level off when the economy turns.

Certificates of Participation

Certificates of Participation (COPs) are backed by a physical asset in the City’s capital portfolio, and repayments are appropriated each year repaid from the City’s General Fund or revenue that would otherwise flow to the General Fund. The City utilizes COPs to leverage the General Fund to finance capital projects and acquisitions, many of which provide direct revenue benefit or cost savings. 

Funding from COPs is planned to support critical City responsibilities such as replacing the seismically deficient Animal Care & Control Shelter, reducing the local jail population and relocating prisoners and City staff from the seismically deficient Hall of Justice, and modernizing the Public Works Operations Yard. Table 5.2 shows the Capital Plan’s COP Program for the next ten years. Vacating seismically unsafe buildings like 101 Grove Street and the Hall of Justice remains top priority. The COP Program also includes a three-year $50 million annual recession allowance for critical repairs, which reserves capacity in the event of an economic downturn and associated impact to the Pay-Go Program.

Table 5.2

Proposed COPs FY2018-2027 

(Dollars in Millions)

Year of Issuance 

Project 

Amount 

FY2018 

DPH 101 Grove Exit & JUV Admin Relocation 

155 

FY2019 

CJ#2 Improvements Match 

12 

FY2020-22 

Critical Repairs - Recession Allowance ($50M Annually) 

150 

FY2021 

JFIP – HOJ Admin Relocation 

308 

FY2021 

JFIP – Prisoner Exit 

190 

FY2025 

101 Grove Retrofit 

50 

FY2025 

PW Yard Consolidation 

50 

FY2026 

JFIP – HOJ Demolition & Enclosure 

48 

Total 


963 

The bottom portions of the columns represent debt service commitments for previously issued and authorized but unissued COPs, including the debt issued for the Moscone Center, San Bruno jail, City office buildings in the Civic Center, the War Memorial Veterans Building, and the Animal Care & Control Shelter replacement. New obligations are represented in discrete colors, beginning in 2018. As with the G.O. Bond Program, all amounts attributed to future COP-funded programs are estimates and may need to be adjusted in future plans to account for new federal and state laws, programmatic changes, site acquisition, alternate delivery methods, changing rates of construction cost escalation, and/or newly emerged City needs.

Chart 5.2

Capital Plan General Fund Debt Program

Chart 5.2 shows the planned COP Program against the policy constraint for General Fund debt not to exceed 3.25% of General Fund Discretionary Revenue, represented by the red horizontal line. 

Revenue Bonds

Revenue bonds are a type of debt that is repaid from revenues generated by projects that the debt was used to finance. Revenue bonds are typically used by the City’s enterprise departments (SFMTA, Port, SFPUC, and SFO), which generate their own revenues from fees paid by users of services provided by those agencies. This type of debt is repaid solely by users of those projects and therefore does not require payments from the General Fund. Examples of projects funded by revenue bonds are the SFPUC’s Water Systems Improvement Program or the Airport’s Terminal Renovation Program.

Table 5.3 shows the current amount of revenue bonds to be issued over the 10-year term of this Plan. All revenue bond issuances are subject to change based on market conditions and cash flow needs of the associated projects. There is no line for the Port, as that agency does not have any additional issuance planned in the next ten years.

Table 5.3

Planned Revenue Bond Issuances FY2018-2027 

(Dollars in Millions)

Agency 

FY18-22 

Amount 

FY23-27 

Amount 

Total 

SFPUC 

5,458 

1,375 

6,834 

Airport 

5,217 


5,217

SFMTA 

150 

100 

250 

Total 

10,825 

1,475 

12,301 

Subscribe to

back to top