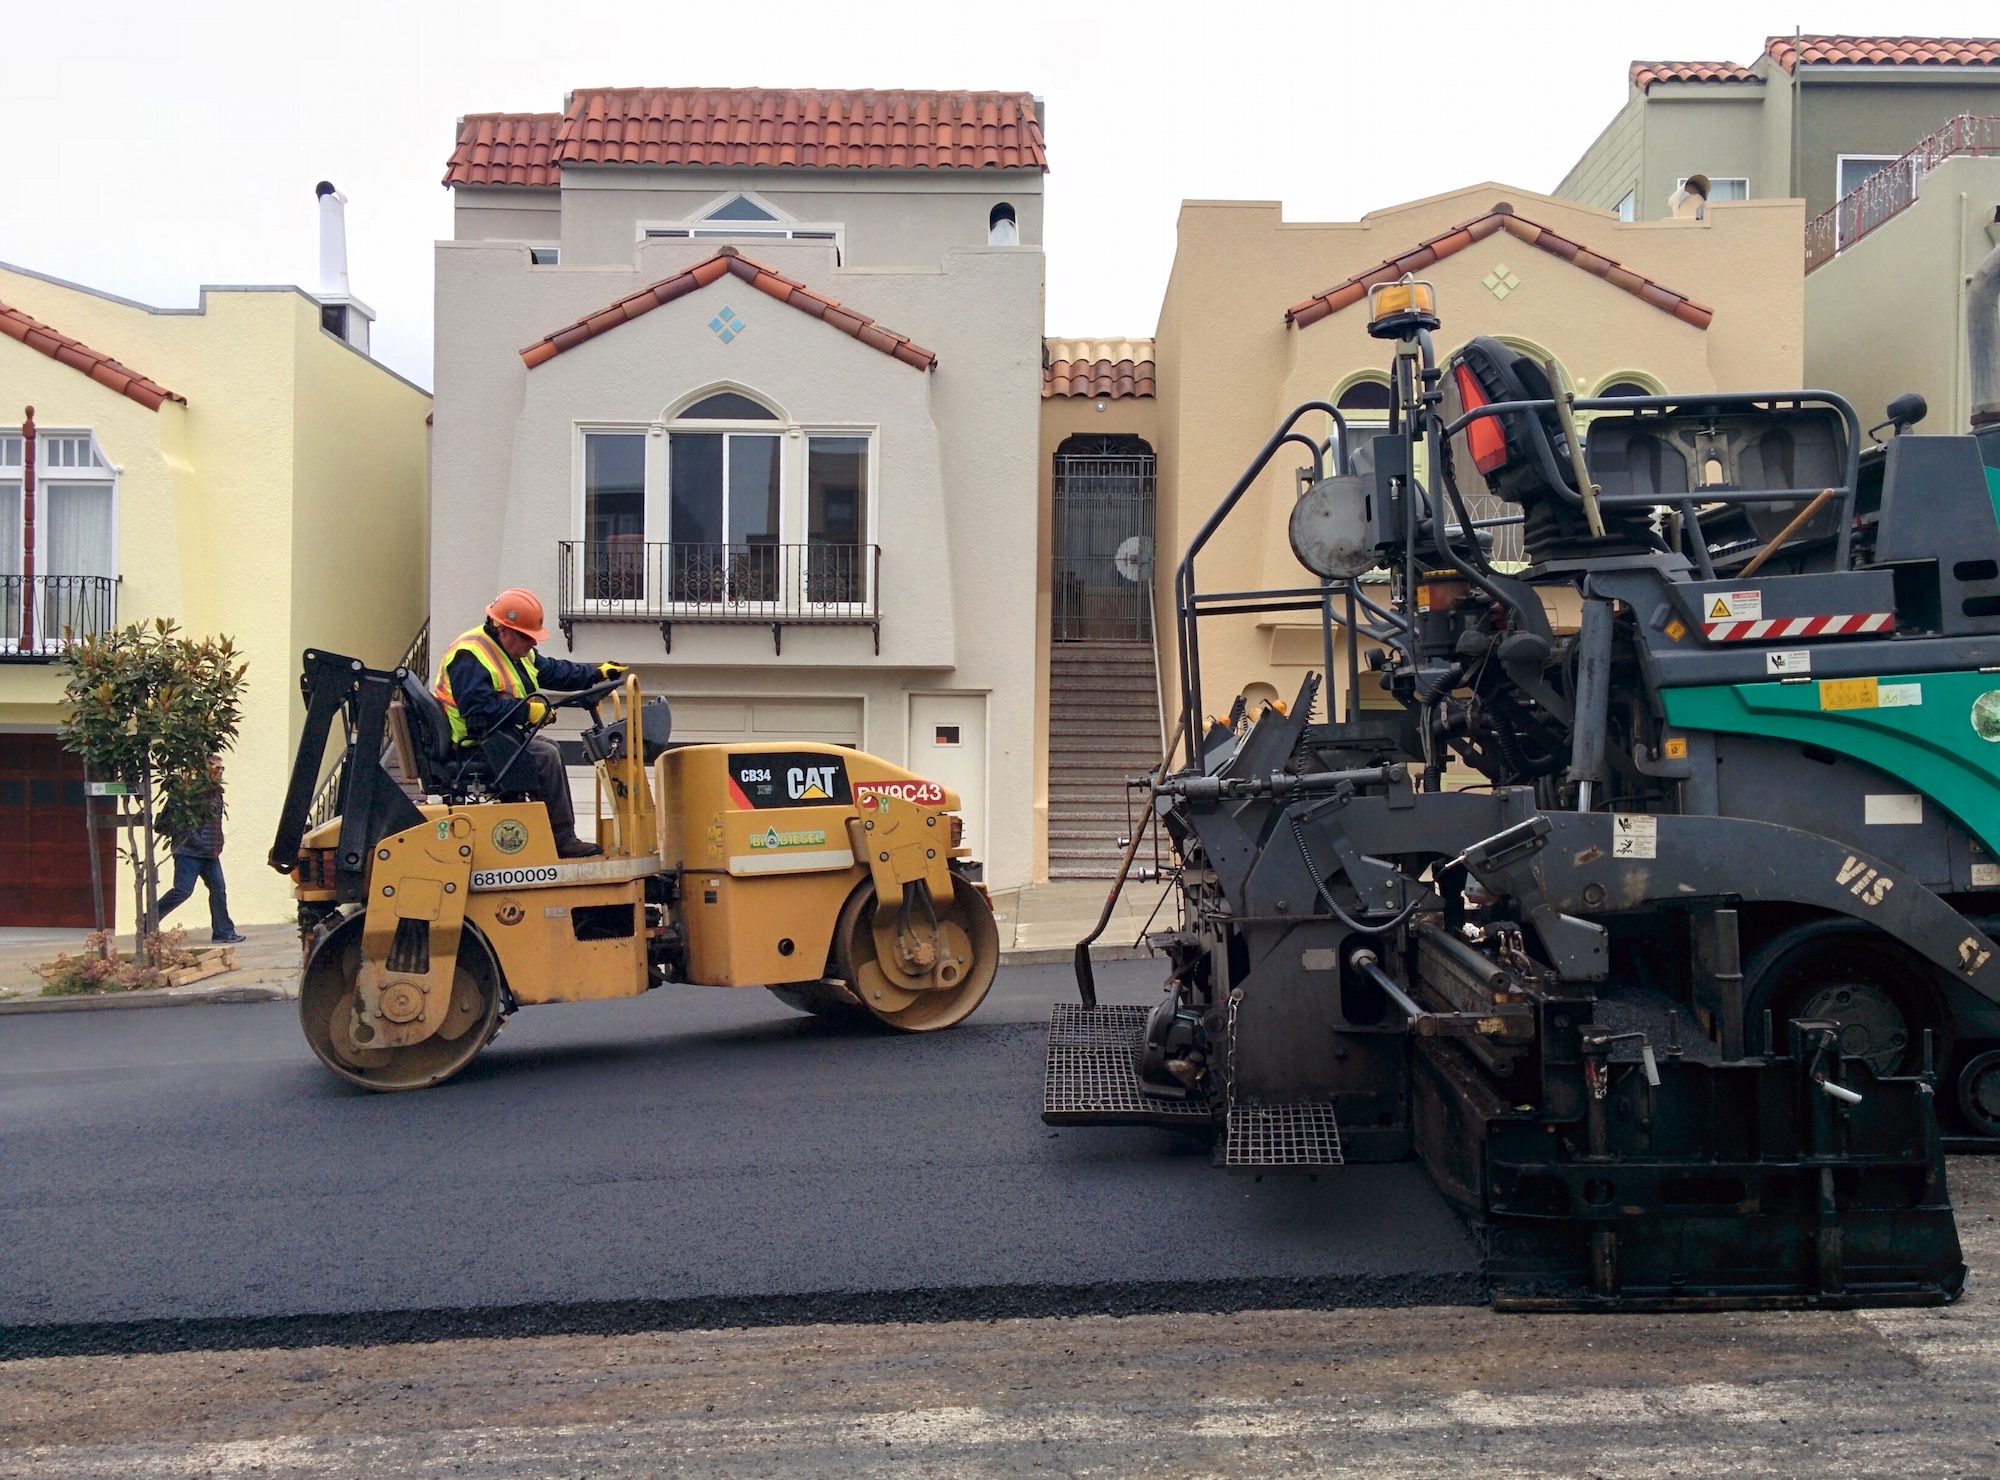
The Fiscal Year (FY) 2018-2027 City and County of San Francisco Capital Plan (the Plan) is the City’s commitment to building a more resilient and vibrant future for the residents, workers, and visitors of San Francisco. Updated every odd-numbered year, the Plan is a fiscally constrained expenditure plan that lays out infrastructure investments over the next decade. This document is the product of input from Citywide stakeholders, who have put forth their best ideas and most realistic estimates of San Francisco’s future needs.
Through the application of consistent funding principles and fiscal policies, the Plan prioritizes departmental capital needs against clearly defined fiscal constraints. The result is a road map for investments in San Francisco’s streets facilities, utilities, parks, waterfront, and transportation systems.

Developed on the centennial of the 1906 earthquake, San Francisco’s first Capital Plan described the City’s renewed dedication to investing in public facilities and infrastructure for FY2007- 2016. Since that first Plan, the City’s commitment to our capital portfolio has grown substantially. The first Plan called for $15.7 billion to address earthquake safety, modernization, and maintenance needs for City buildings and infrastructure. The level of recommended funding steadily grew as better capital planning practices were employed, infrastructure systems and facilities reached the end of their useful life, and the City dug out of extremely low levels of investment from the mid-1970s to 2008.
The current Plan recommends a record $35 billion in critical infrastructure improvements over the next 10 years. This is $3 billion more than the previous Plan.
The primary drivers of this increase are (1) large investments in newly developing areas along the waterfront and at Treasure Island; (2) continued use of G.O. Bonds and other forms of debt to address the transportation network, parks and open space, sewers, and key facilities that improve services and resilience for current and future generations; and (3) year-over-year growth to keep existing City assets in a state of good repair.

This growth reflects increased confidence in the City’s capacity to administer our capital program in a responsible and transparent manner that employs best practices in financial management. This includes establishing constraints around each funding program to promote long-term viability, listing what is unfunded or deferred, and establishing funding principles, among others. It also recognizes an appreciation for the long-term benefits of investing in public infrastructure.
Ignoring the needs of our existing assets results in greater costs down the road as they become less efficient and more costly to repair or replace.
Table 2.1
| G.O. Bond Program | Amount (Dollars in Millions) |
|
|---|---|---|
| 2008 | Neighborhood Parks and Open Space | 180 |
| 2008 | Public Health Seismic Facilities (SFGH rebuild) |
887 |
| 2010 | Earthquake Safety and Emergency Response |
412 |
| 2011 | Road Resurfacing and Street Safety | 248 |
| 2012 | Neighborhood Parks and Open Space | 195 |
| 2014 | Earthquake Safety and Emergency Response | 400 |
| 2014 | Transportation | 500 |
| 2015 | Affordable Housing | 310 |
| 2016 | Public Health and Safety | 350 |
| Total | 3,482 |

